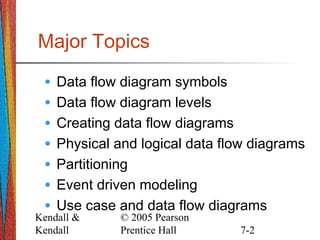
Submit Search
Upload
DFD
•
Download as PPT, PDF
•
1 like
•
2,201 views
Farooq Mian
Follow
all about data flow diagrams.
Read less
Read more
Education
Report
Share
Report
Share
1 of 44
Download now
Recommended
ABC Company Presentation
ABC-GROEP.BE
Practical Malware Analysis: Ch 4 A Crash Course in x86 Disassembly
Sam Bowne
Freemind
Freemind
DertyD
Chapter 2 - Basic Elements of Java
Adan Hubahib
GC in C#
GC in C#
Kamal1997
Excel presentation (short)
dhawal mehta
RE processes and process models
Syed Zaid Irshad
Using data flow diagram
Kiran Ajudiya
Intermediate Excel
Intermediate Excel
Lisa De Castro, Ph.D.
Manufacturing and sales management system
Smit Patel
Google Productivity Tools.pptx
Excellence Foundation for South Sudan
Ms access
Ms access
RoshanMaharjan13
Ch07 records management
xtin101
Trees
Trees
VIKAS SINGH BHADOURIA
Star schema PPT
Star schema PPT
Swati Kulkarni Jaipurkar
Chapter 12 user interface design
SHREEHARI WADAWADAGI
Element of an electronic speadsheet ms excel
eVidhya
School Website Project
Vijay Baidya
Data flow diagrams (2)
Ujjwal 'Shanu'
Excel Lesson 1: Excel Basics
Novus Business and IT Training Program
R.A.D. - Rapid Application Development
Mediotype .
Linked list
Linked list
MahammadAdil
Heaps
Heaps
invertis university
Software Development Life Cycle (SDLC)
Al-Mamun Sarkar
Software Project Management
NoorHameed6
System analysis and design
Kiruthika Veerappan Nagappan
Generic process model
Madhar Khan Pathan
01 Excel interface
01 Excel interface
Buffalo Seminary
Data Flow Diagram
Data Flow Diagram
nethisip13
Hi600 u05_inst_slides
ljmcneill33
More Related Content
What's hot
Intermediate Excel
Intermediate Excel
Lisa De Castro, Ph.D.
Manufacturing and sales management system
Smit Patel
Google Productivity Tools.pptx
Excellence Foundation for South Sudan
Ms access
Ms access
RoshanMaharjan13
Ch07 records management
xtin101
Trees
Trees
VIKAS SINGH BHADOURIA
Star schema PPT
Star schema PPT
Swati Kulkarni Jaipurkar
Chapter 12 user interface design
SHREEHARI WADAWADAGI
Element of an electronic speadsheet ms excel
eVidhya
School Website Project
Vijay Baidya
Data flow diagrams (2)
Ujjwal 'Shanu'
Excel Lesson 1: Excel Basics
Novus Business and IT Training Program
R.A.D. - Rapid Application Development
Mediotype .
Linked list
Linked list
MahammadAdil
Heaps
Heaps
invertis university
Software Development Life Cycle (SDLC)
Al-Mamun Sarkar
Software Project Management
NoorHameed6
System analysis and design
Kiruthika Veerappan Nagappan
Generic process model
Madhar Khan Pathan
01 Excel interface
01 Excel interface
Buffalo Seminary
What's hot
(20)
Intermediate Excel
Intermediate Excel
Manufacturing and sales management system
Google Productivity Tools.pptx
Ms access
Ms access
Ch07 records management
Trees
Trees
Star schema PPT
Star schema PPT
Chapter 12 user interface design
Element of an electronic speadsheet ms excel
School Website Project
Data flow diagrams (2)
Excel Lesson 1: Excel Basics
R.A.D. - Rapid Application Development
Linked list
Linked list
Heaps
Heaps
Software Development Life Cycle (SDLC)
Software Project Management
System analysis and design
Generic process model
01 Excel interface
01 Excel interface
Viewers also liked
Data Flow Diagram
Data Flow Diagram
nethisip13
Hi600 u05_inst_slides
ljmcneill33
becan
becan
manas0770
Introduction to Data Flow Diagram (DFD)
Gurpreet singh
Biometric-based Security for Data Authentication in Wireless Body Area Networ...
Shreyas Tote
How to Data Flow Diagram
جلال مصطفیٰ
Understanding Data Flow Diagram
Ankur Biswas
Data Flow Diagram
Data Flow Diagram
Shreya Chatterjee
Data Flow Diagram (DFD)
sadique_ghitm
Vehicle Parking System Project
Farooq Mian
Theory of Automata
Theory of Automata
Farooq Mian
Dfd final
Dfd final
Mukund Trivedi
Example of dfd with answer
Mahmoud Bakeer
Data Flow Diagrams
Data Flow Diagrams
Sinhaa Yash
Data Flow Diagram Example
Kaviarasu D
Viewers also liked
(15)
Data Flow Diagram
Data Flow Diagram
Hi600 u05_inst_slides
becan
becan
Introduction to Data Flow Diagram (DFD)
Biometric-based Security for Data Authentication in Wireless Body Area Networ...
How to Data Flow Diagram
Understanding Data Flow Diagram
Data Flow Diagram
Data Flow Diagram
Data Flow Diagram (DFD)
Vehicle Parking System Project
Theory of Automata
Theory of Automata
Dfd final
Dfd final
Example of dfd with answer
Data Flow Diagrams
Data Flow Diagrams
Data Flow Diagram Example
Similar to DFD
Question 1 1. A data flow element in a DFD must be conntected.docx
IRESH3
Data Flow Diagram or DFD
Mubassira Mahmuda Supty
System design
System design
Gheethu Joy
__Stude_DATA FLOW DIAGRAMS.ppt
VinayShekarReddy
Using data flow diagrams
Alyana Mae Velasquez
chapter05-120827115357-phpapp01.pdf
AxmedMaxamuud6
SYSTEM MODELLING
SYSTEM MODELLING
FLYMAN TECHNOLOGY LIMITED
Chapter 5 Data and Process Modeling .pptx
AxmedMaxamuudYoonis
PPT01
PPT01
Demi Hotahot
Tableau - Learning Objectives for Data, Graphs, Filters, Dashboards and Advan...
Srinath Reddy
Final presentation of tools and techniques of structure analysis (Management ...
Rohan Naik
Lecture10WebVer.ppt SAD
Nasasirahjossy
Software Architecture Lecture 10 web version
Vivekananda Gn
Lecture10WebVer.ppt
Lecture10WebVer.ppt
AndrewBeka
Seminar@UNIVR 31/05/2016 Montali: Data-aware business processes - balancing b...
Faculty of Computer Science - Free University of Bozen-Bolzano
Module 2 Unit 3
Module 2 Unit 3
ljmcneill33
Hi600 ch05_text_slides
ljmcneill33
Kendall7e ch02
Kendall7e ch02
sayAAhmad
001 More introduction to big data analytics
Dendej Sawarnkatat
AIS PPt.pptx
AIS PPt.pptx
dereje33
Similar to DFD
(20)
Question 1 1. A data flow element in a DFD must be conntected.docx
Data Flow Diagram or DFD
System design
System design
__Stude_DATA FLOW DIAGRAMS.ppt
Using data flow diagrams
chapter05-120827115357-phpapp01.pdf
SYSTEM MODELLING
SYSTEM MODELLING
Chapter 5 Data and Process Modeling .pptx
PPT01
PPT01
Tableau - Learning Objectives for Data, Graphs, Filters, Dashboards and Advan...
Final presentation of tools and techniques of structure analysis (Management ...
Lecture10WebVer.ppt SAD
Software Architecture Lecture 10 web version
Lecture10WebVer.ppt
Lecture10WebVer.ppt
Seminar@UNIVR 31/05/2016 Montali: Data-aware business processes - balancing b...
Module 2 Unit 3
Module 2 Unit 3
Hi600 ch05_text_slides
Kendall7e ch02
Kendall7e ch02
001 More introduction to big data analytics
AIS PPt.pptx
AIS PPt.pptx
More from Farooq Mian
Scrum Model
Scrum Model
Farooq Mian
Basic Web Page, Twitter, Facebook introduction
Farooq Mian
Business Report Writing
Farooq Mian
Database Join
Database Join
Farooq Mian
SDLC of Shareef Oxygen Company
Farooq Mian
Basic C concepts.
Basic C concepts.
Farooq Mian
Traffic Problems in Cities.
Farooq Mian
More from Farooq Mian
(7)
Scrum Model
Scrum Model
Basic Web Page, Twitter, Facebook introduction
Business Report Writing
Database Join
Database Join
SDLC of Shareef Oxygen Company
Basic C concepts.
Basic C concepts.
Traffic Problems in Cities.
Recently uploaded
call girls in Kamla Market (DELHI) 🔝 >༒9953330565🔝 genuine Escort Service 🔝✔️✔️
9953056974 Low Rate Call Girls In Saket, Delhi NCR
Sanyam Choudhary Chemistry practical.pdf
sanyamsingh5019
Crayon Activity Handout For the Crayon A
UnboundStockton
BASLIQ CURRENT LOOKBOOK LOOKBOOK(1) (1).pdf
SoniaTolstoy
Alper Gobel In Media Res Media Component
InMediaRes1
Enzyme, Pharmaceutical Aids, Miscellaneous Last Part of Chapter no 5th.pdf
Sumit Tiwari
TataKelola dan KamSiber Kecerdasan Buatan v022.pdf
Sarwono Sutikno, Dr.Eng.,CISA,CISSP,CISM,CSX-F
POINT- BIOCHEMISTRY SEM 2 ENZYMES UNIT 5.pptx
Sayali Powar
A Critique of the Proposed National Education Policy Reform
Chameera Dedduwage
How to Make a Pirate ship Primary Education.pptx
manuelaromero2013
Incoming and Outgoing Shipments in 1 STEP Using Odoo 17
Celine George
How to Configure Email Server in Odoo 17
Celine George
Separation of Lanthanides/ Lanthanides and Actinides
FatimaKhan178732
Presentation by Andreas Schleicher Tackling the School Absenteeism Crisis 30 ...
EduSkills OECD
Paris 2024 Olympic Geographies - an activity
GeoBlogs
Presiding Officer Training module 2024 lok sabha elections
anshu789521
MENTAL STATUS EXAMINATION format.docx
PoojaSen20
The Most Excellent Way | 1 Corinthians 13
Steve Thomason
“Oh GOSH! Reflecting on Hackteria's Collaborative Practices in a Global Do-It...
Marc Dusseiller Dusjagr
Introduction to ArtificiaI Intelligence in Higher Education
pboyjonauth
Recently uploaded
(20)
call girls in Kamla Market (DELHI) 🔝 >༒9953330565🔝 genuine Escort Service 🔝✔️✔️
Sanyam Choudhary Chemistry practical.pdf
Crayon Activity Handout For the Crayon A
BASLIQ CURRENT LOOKBOOK LOOKBOOK(1) (1).pdf
Alper Gobel In Media Res Media Component
Enzyme, Pharmaceutical Aids, Miscellaneous Last Part of Chapter no 5th.pdf
TataKelola dan KamSiber Kecerdasan Buatan v022.pdf
POINT- BIOCHEMISTRY SEM 2 ENZYMES UNIT 5.pptx
A Critique of the Proposed National Education Policy Reform
How to Make a Pirate ship Primary Education.pptx
Incoming and Outgoing Shipments in 1 STEP Using Odoo 17
How to Configure Email Server in Odoo 17
Separation of Lanthanides/ Lanthanides and Actinides
Presentation by Andreas Schleicher Tackling the School Absenteeism Crisis 30 ...
Paris 2024 Olympic Geographies - an activity
Presiding Officer Training module 2024 lok sabha elections
MENTAL STATUS EXAMINATION format.docx
The Most Excellent Way | 1 Corinthians 13
“Oh GOSH! Reflecting on Hackteria's Collaborative Practices in a Global Do-It...
Introduction to ArtificiaI Intelligence in Higher Education
DFD
1.
Chapter 7 Using Data
Flow Diagrams Systems Analysis and Design Kendall & Kendall Sixth Edition
2.
Kendall & Kendall © 2005
Pearson Prentice Hall 7-2 Major Topics • Data flow diagram symbols • Data flow diagram levels • Creating data flow diagrams • Physical and logical data flow diagrams • Partitioning • Event driven modeling • Use case and data flow diagrams
3.
Kendall & Kendall © 2005
Pearson Prentice Hall 7-3 Data Flow Diagrams • DFDs are one of the main methods available for analyzing data-oriented systems. • DFDs emphasize the logic underlying the system. • The systems analysts can put together a graphical representation of data movement through the organization.
4.
Kendall & Kendall © 2005
Pearson Prentice Hall 7-4 Advantages of the Data Flow Diagram Approach Four advantages over narrative explanations of data movement: • Freedom from committing to the technical implementation too early. • Understanding of the interrelationships of systems and subsystems. • Communicating current system knowledge to users. • Analysis of the proposed system.
5.
Kendall & Kendall © 2005
Pearson Prentice Hall 7-5 Basic Symbols Four basic symbols are: • A double square for an external entity--a source or destination of data. • An arrow for movement of data from one point to another. • A rectangle with rounded corners for the occurrence of transforming process. • An open-ended rectangle for a data store.
6.
Kendall & Kendall © 2005
Pearson Prentice Hall 7-6 Basic Symbols
7.
Kendall & Kendall © 2005
Pearson Prentice Hall 7-7 External Entities • Represent people or organizations outside of the system being studied • Shows the initial source and final recipient of data and information • Should be named with a noun, describing that entity Customer
8.
Kendall & Kendall © 2005
Pearson Prentice Hall 7-8 External Entities (Continued) • External entities may be: • A person, such as CUSTOMER or STUDENT. • A company or organization, such as BANK or SUPPLIER. • Another department within the company, such as ORDER FULFILLMENT. • Another system or subsystem, such as the INVENTORY CONTROL SYSTEM.
9.
Kendall & Kendall © 2005
Pearson Prentice Hall 7-9 Processes • Represent either: • A whole system • A subsystem • Work being done, an activity • Names should be in the form verb- adjective-noun • The exception is a process that represents an entire system or subsystem. 1 Add New Customer 2 Customer Inquiry Subsystem
10.
Kendall & Kendall © 2005
Pearson Prentice Hall 7-10 Data Stores • Name with a noun, describing the data • Data stores are usually given a unique reference number, such as D1, D2, D3. • Include any data stored, such as: • A computer file or database. • A transaction file . • A set of tables . • A manual file of records. D 1 Customer Master
11.
Kendall & Kendall © 2005
Pearson Prentice Hall 7-11 Data Flow • Data flow shows the data about a person, place, or thing that moves through the system. • Names should be a noun that describes the data moving through the system. • Arrowhead indicates the flow direction. • Use double headed-arrows only when a process is reading data and updating the data on the same table or file. Customer Record New Customer
12.
Kendall & Kendall © 2005
Pearson Prentice Hall 7-12 Developing Data Flow Diagrams Use the following guidelines: • Create the context level diagram, including all external entities and the major data flow to or from them. • Create Diagram 0 by analyzing the major activities within the context process. • Include the external entities and major data stores. • Create a child diagram for each complex process on Diagram 0.
13.
Kendall & Kendall © 2005
Pearson Prentice Hall 7-13 Creating Data Flow Diagrams Detailed data flow diagrams may be developed by: • Making a list of business activities. • Analyzing what happens to an input data flow from an external entity. • Analyzing what is necessary to create an output data flow to an external entity.
14.
Kendall & Kendall © 2005
Pearson Prentice Hall 7-14 Creating Data Flow Diagrams Detailed data flow diagrams may be developed by (continue): • Examining the data flow to or from a data store. • Analyzing a well-defined process for data requirements and the nature of the information produced. • Noting and investigating unclear areas.
15.
Kendall & Kendall © 2005
Pearson Prentice Hall 7-15 Data Flow Diagram Levels • Data flow diagrams are built in layers. • The top level is the Context level. • Each process may explode to a lower level. • The lower level diagram number is the same as the parent process number. • Processes that do not create a child diagram are called primitive.
16.
Kendall & Kendall © 2005
Pearson Prentice Hall 7-16 Context-Level Data Flow Diagram • It contains only one process, representing the entire system. • The process is given the number zero. • All external entities are shown on the context diagram as well as major data flow to and from them. • The diagram does not contain any data stores.
17.
Kendall & Kendall © 2005
Pearson Prentice Hall 7-17 DFD Levels • Insert Figure 4.3 here NOTE: confirm correct figure with author.
18.
Kendall & Kendall © 2005
Pearson Prentice Hall 7-18 Diagram 0 • Diagram 0 is the explosion of the context level diagram. • It should include up to 7 or 9 processes. • Any more will result in a cluttered diagram. • Processes are numbered with an integer. • The major data stores and all external entities are included on Diagram 0.
19.
Kendall & Kendall © 2005
Pearson Prentice Hall 7-19 Child Diagrams • Each process on diagram zero may be exploded to create a child diagram. • Each process on a lower-level diagram may be exploded to create another child diagram. • These diagrams found below Diagram 0 are given the same number as the parent process. • Process 3 would explode to Diagram 3.
20.
Kendall & Kendall © 2005
Pearson Prentice Hall 7-20 Child Diagrams (Continued) • Each process is numbered with the parent diagram number, a period, and a unique child diagram number. • Examples are: • 3.2 on Diagram 3, the child of process 3. • 5.2.7 on Diagram 5.2, child of process 5.2. • On Diagram 3, the processes would be numbered 3.1, 3.2, 3.3 and so on. 3 . 2 Edit Customer 5 . 2 . 7 Calculate Customer Discount
21.
Kendall & Kendall © 2005
Pearson Prentice Hall 7-21 Child Diagrams (Continued) • External entities are usually not shown on the child diagrams below Diagram 0. • If the parent process has data flow connecting to a data store, the child diagram may include the data store as well.
22.
Kendall & Kendall © 2005
Pearson Prentice Hall 7-22 Child Diagrams (Continued) • A lower-level diagram may contain data stores not shown on the parent process, such as: • A file containing a table of information (such as a tax table). • A file linking two processes on the child diagram. • Minor data flow, such as an error line, may be included on a child diagram.
23.
Kendall & Kendall © 2005
Pearson Prentice Hall 7-23 Child Diagrams (Continued) • An interface data flow is data that are input or output from a child diagram that matches the parent diagram data flow. • Processes that do not create a child diagram are called primitive processes. • Logic is written for these processes.
24.
Kendall & Kendall © 2005
Pearson Prentice Hall 7-24 Data Flow Diagram Errors • The following conditions are errors that occur when drawing a data flow diagram: • A process with only input data flow or only output data flow from it. Add New Customer 1 Add New Customer 2
25.
Kendall & Kendall © 2005
Pearson Prentice Hall 7-25 Data Flow Diagram Errors (Continued) • Data stores or external entities are connected directly to each other, in any combination. Customer D1 Customer Vendor D2 Vendor Master
26.
Kendall & Kendall © 2005
Pearson Prentice Hall 7-26 Data Flow Diagram Errors (Continued) • Incorrectly labeling data flow or objects • Examples are: • Labels omitted from data flow or objects. • Data flow labeled with a verb. • Processes labeled with a noun. • Too many processes on a data flow diagram. • Nine is the suggested maximum.
27.
Kendall & Kendall © 2005
Pearson Prentice Hall 7-27 Data Flow Diagram Errors (Continued) • Omitting data flow from the diagram • Unbalanced decomposition between a parent process and a child diagram • The data flow in and out of a parent process must be present on the child diagram.
28.
Kendall & Kendall © 2005
Pearson Prentice Hall 7-28 Logical Data Flow Diagrams • Logical data flow diagrams show how the business operates. • They have processes that would exist regardless of the type of system implemented.
29.
Kendall & Kendall © 2005
Pearson Prentice Hall 7-29 Data Flow Diagram Progression The progression of creating data flow diagrams is: • Create a logical DFD of the current system. • Next add all the data and processes not in the current system that must be present in the new system. • Finally derive the physical data flow diagram for the new system.
30.
Kendall & Kendall © 2005
Pearson Prentice Hall 7-30 Data Flow Diagram Progression
31.
Kendall & Kendall © 2005
Pearson Prentice Hall 7-31 Logical Data Flow Diagrams Advantages Advantages of logical DFDs are: • Better communication with users. • More stable systems, since the design is based on a business framework. • Increased understanding of the business by analysts. • The system will have increased flexibility and be easier to maintain. • Elimination of redundancy.
32.
Kendall & Kendall © 2005
Pearson Prentice Hall 7-32 Physical Data Flow Diagrams Physical data flow diagrams show how the system operates or how the new system will be implemented. • Physical data flow diagrams include: • Clarifying which processes are manual and which are automated. • Describing processes in greater detail. • Sequencing processes in the order they must be executed.
33.
Kendall & Kendall © 2005
Pearson Prentice Hall 7-33 Physical Data Flow Diagrams Physical data flow diagrams include (continued): • Temporary data stores and transaction files. • Specifying actual document and file names. • Controls to ensure accuracy and completeness.
34.
Kendall & Kendall © 2005
Pearson Prentice Hall 7-34 CRUD • Physical data flow diagrams include processes for adding, reading, changing, and deleting records. • CRUD is an acronym for Create, Read, Update, Delete. • A CRUD matrix shows which programs or processes add, read, update, or delete master file records.
35.
Kendall & Kendall © 2005
Pearson Prentice Hall 7-35 Transaction Files • Master or transaction database tables or files are used to link all processes that operate at different times. • They are required to store the data from the process that creates the data to the process that uses the data.
36.
Kendall & Kendall © 2005
Pearson Prentice Hall 7-36 Triggers and Events • An input flow from an external entity is sometimes called a trigger, since it starts activities. • Events cause the system to do something. • An approach used to create a data flow fragment is to analyze events, which are summarized in an event table.
37.
Kendall & Kendall © 2005
Pearson Prentice Hall 7-37 Event Tables • An event table is used to create a data flow diagram by analyzing each event and the data used and produced by the event. • Every row in an event table represents a unique activity and is used to create one process on the data flow diagram.
38.
Kendall & Kendall © 2005
Pearson Prentice Hall 7-38 Use Case and Data Flow Diagrams • A use case is another approach used to develop a data flow diagram. • A use case is used to create a data flow diagram by providing a framework for obtaining processes, input, output, and data stores required for user activities. • A use case shows the steps performed to accomplish a task.
39.
Kendall & Kendall © 2005
Pearson Prentice Hall 7-39 Use Case The major sections of a use case are: • Use case name. • Description. • Trigger. • Trigger type. • Input name and source. • Output name and destination. • Steps performed. • Information required for each step.
40.
Kendall & Kendall © 2005
Pearson Prentice Hall 7-40 Partitioning • Partitioning is the process of analyzing a data flow diagram and deriving a series of manual procedures and computer programs. • A dashed line is drawn around a group of processes that are included in each computer program or manual procedure.
41.
Kendall & Kendall © 2005
Pearson Prentice Hall 7-41 Reasons for Partitioning • The reasons for partitioning a data flow diagram into separate computer programs are: • Different user groups should have different programs. • Processes that execute at different times must be in separate programs. • Processes may be separated into different programs for security.
42.
Kendall & Kendall © 2005
Pearson Prentice Hall 7-42 Reasons for Partitioning (Continued) • Similar tasks may be included in the same program. • Several batch processes may be included in the same program for efficiency. • Several processes may be included in the same program or job stream for consistency of data.
43.
Kendall & Kendall © 2005
Pearson Prentice Hall 7-43 Partitioning Web Sites Web sites are partitioned into pages. • Improves speed of processing • Easier Web page maintenance • Different pages when reading different data • Partitioned for security, separating pages using a secure connection from those that do not
44.
Kendall & Kendall © 2005
Pearson Prentice Hall 7-44 Communicating Using Data Flow Diagrams Data flow diagrams can be used for several different purposes: • Unexploded data flow diagrams are useful to identify information requirements. • Meaningful labels should be used for good communication.
Download now