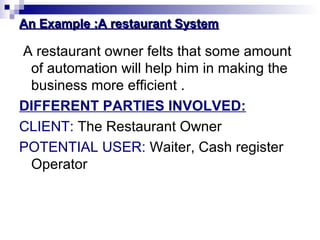
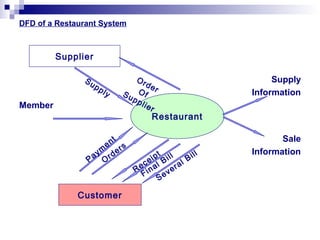
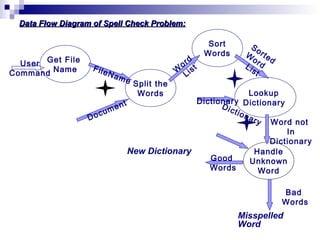
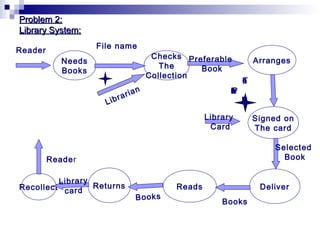
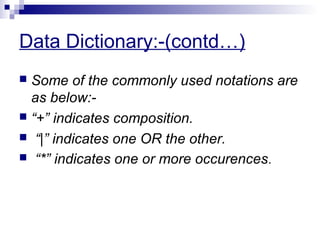
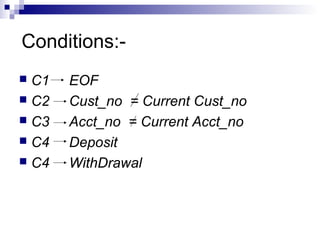
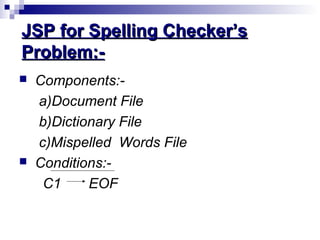
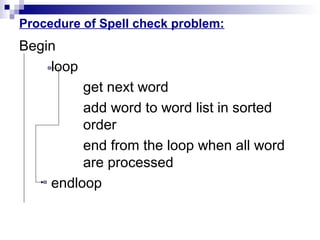
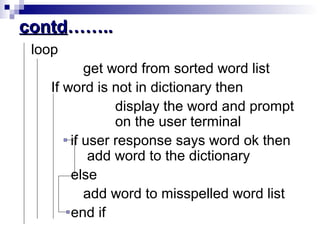
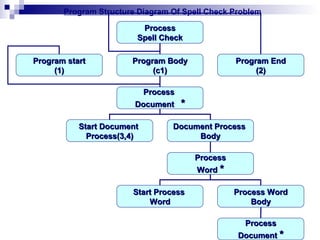
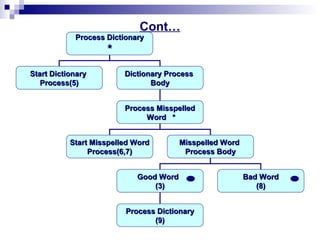
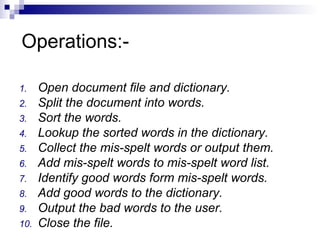
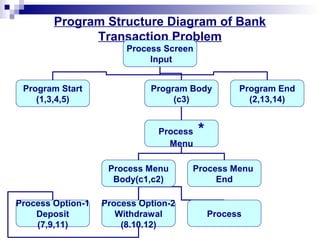
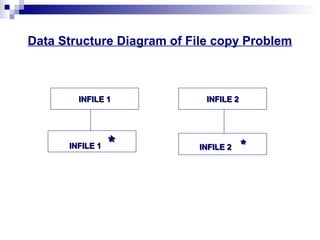
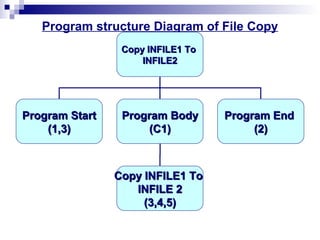
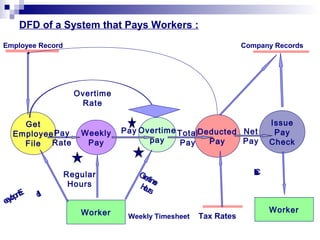
This document describes data flow diagrams and Jackson Structured Programming. It provides details on how to construct DFDs, including leveled DFDs for large systems. It explains how DFDs differ from flowcharts by focusing on data flow rather than control flow. The document also provides an example DFD for a payroll system. It then describes Jackson Structured Programming and how to develop the data structure diagram, program structure diagram, and list operations and conditions. An example JSP is provided for an accounting processing system.
This document discusses software design principles and methods. It covers topics like abstraction, modularity, coupling and cohesion, and information hiding. It also describes different design methods including functional decomposition, data flow design, design based on data structures, and object-oriented design. Key aspects of these methods are explained, such as the stages of object-oriented analysis and design. The document provides examples to illustrate different design concepts and metrics.
This document describes an ATM system project. The key functions of an ATM include balance inquiries, cash withdrawals, and changing PIN numbers. The hardware requirements include a 32-bit screen with high resolution and sufficient storage capabilities. The software is developed using C++ with graphics. The system allows transactions, maintains and updates master files, and generates documents. It also describes screens for authentication, selecting account type, withdrawing amounts, and confirmation screens.
Quality Function Deployment (QFD) is a systematic method that transfers customer wants and needs into product and process characteristics. QFD uses a House of Quality matrix to identify customer needs, how the product will meet those needs, relationships between customer needs and engineering requirements, and target values and specifications. QFD was developed to integrate the voice of the customer into new product and service development.
This document discusses UML class and object diagrams. It explains that class diagrams depict classes and their relationships, while object diagrams show instantiated classes at a point in time. The document uses examples of a billing system and job posting process to illustrate identifying classes, attributes, behaviors, and drawing class and object diagrams.
QFD (Quality Function Deployment) was developed in Japan in the 1960s to link customer needs to product development and help organizations focus on customers. It involves cross-functional teams identifying customer wants and using tools like the House of Quality to prioritize them and ensure they are addressed throughout the organization from design to manufacturing. The process aims to improve communication of customer needs and lead to more complete specifications that directly meet those needs.
The document discusses the purpose and importance of a data dictionary for systems analysis and design. It explains that a data dictionary defines the data about data (metadata) and includes information about entities, attributes, relationships, data flows, structures, elements and data stores. It provides examples of how these components are defined and categorized in a data dictionary. The document also outlines the process of analyzing inputs and outputs, developing data stores, and creating the overall data dictionary.
The document discusses Quality Function Deployment (QFD), a requirements management technique that involves translating customer needs into technical requirements and product design criteria. It covers the basic concepts and phases of QFD, including how to build a House of Quality matrix to prioritize requirements. The document also compares QFD to other software development life cycles such as Cleanroom, SASD, JAD, PD, RAD, SSM, RUP, and XP.
1) The data dictionary is a virtual database that contains metadata (data about data) such as the definition of tables, fields, domains and other database objects. It provides information for data manipulation and processing.
2) Key data dictionary objects include domains, which define field attributes like type and length; data elements, which define field semantics; and tables, which store records of data. Transparent tables can be created to store custom tables.
3) System fields store system-related data like date and time, while structures store temporary data during runtime and views combine data from multiple tables.
Quality Function Deployment (QFD) Seminar PresentationOrange Slides
Quality Function Deployment (QFD) is a method to translate customer needs into technical requirements for new product development. It was developed in Japan in the 1970s and involves capturing customer needs, prioritizing them, benchmarking competitors, and setting target values. The process results in a comprehensive product specification. Key tools include affinity diagrams, relations diagrams, matrices, and the House of Quality which maps customer and technical requirements. QFD aims to design products that meet customer needs and satisfy them better than competitors.
The document discusses requirements analysis, which involves understanding customer needs and expectations for a proposed system. Requirements analysis is necessary to ensure projects align with business goals and specifications. The requirements analysis process includes identifying system boundaries, customers, eliciting requirements through stakeholder interviews, analyzing requirements, documenting requirements in a specification, and managing evolving requirements. An effective software requirements specification establishes agreement between customers and developers on system functionality.
An ATM allows customers to access financial services without a human bank teller. It uses a card with unique account information and a PIN for security. An ATM has components like a card reader, keypad, screen and cash dispenser to withdraw and deposit money, check balances, transfer funds and more. The first ATM was installed in 1967 in London. Now ATMs are widely used, come in various types, and occasionally experience fraud, but precautions can help users stay safe.
This document provides a summary of requirements for a Library Management System. It includes 3 sections:
1. Introduction - Defines the purpose, scope and intended audience of the system which is to manage library processes like book borrowing online.
2. Overall Description - Outlines key product functions for administrators and users, the operating environment, user characteristics and design constraints.
3. External Interfaces - Specifies the user interface requirements including login, search and categories. Hardware and software interfaces are also listed.
The document provides a high-level overview of the essential functions, behaviors and non-functional requirements for the library management software.
The document discusses entity relationship diagrams and database design. It defines key concepts such as entities, attributes, relationships and cardinalities. Entities can have single-valued or multi-valued attributes. Relationships connect entities and can be one-to-one, one-to-many, many-to-one, or many-to-many. Primary keys uniquely identify entities and foreign keys define relationships between entities. Together these elements form a conceptual model of entities and their relationships within a database.
Software requirements specification of Library Management SystemSoumili Sen
The document provides requirements for a Library Management System. It includes 3 or less sentences:
The Library Management System aims to computerize library processes like book borrowing and maintain member and book details in a database. It will allow librarians and members to search for books, view member accounts, and generate reports. The system needs to be secure, fast, and compatible with common browsers and operating systems.
The document describes the requirements for an ATM network software system. It allows customers to complete banking transactions through off-premise ATMs. The software must interface with individual bank computers to process transactions. Key requirements include supporting account balance inquiries, withdrawals, and transfers according to each bank's business rules while ensuring security of customer authentication and funds. The system must also have high availability, safety protections, and handle concurrent access to accounts correctly.
A data dictionary is a central repository that contains metadata about the data in a database. It describes the structure, elements, relationships and other attributes of the data. A well-designed database will include a data dictionary to provide information about the type of data in each table, row and column without accessing the actual database. This ensures data consistency when multiple users access the database. A data dictionary can be integrated with the database management system or be a standalone tool. It should be easily accessible and searchable by all database users.
The document outlines a 7-step process for mapping an entity-relationship (ER) schema to a relational database schema. The steps include mapping regular and weak entity types, binary 1:1, 1:N, and M:N relationship types, multivalued attributes, and n-ary relationship types to tables. For each type of schema element, the document describes how to represent it as a table with primary keys and foreign key attributes that preserve the relationships in the original ER schema.
The document describes data flow diagrams (DFDs), including how they differ from flowcharts by showing the flow of data rather than control flow. It then provides steps for creating DFDs using an example of a lemonade stand: 1) List activities, 2) Create a context-level DFD identifying sources and sinks, 3) Create a level 0 DFD identifying subprocesses, and 4) Create level 1 DFDs decomposing subprocesses and identifying data stores.
The document discusses database design and relational database management systems. It covers key concepts like normalization, primary keys, foreign keys, and relationships between tables. Normalization is the process of organizing data to eliminate redundancy and ensure data is stored correctly. There are five normal forms with third normal form being sufficient for most applications. Tables are related through primary and foreign keys and different types of relationships can exist between tables like one-to-one, one-to-many, and many-to-many.
ER DIAGRAM TO RELATIONAL SCHEMA MAPPING ARADHYAYANA
1) Entity types from ER diagrams are converted to tables, with attributes becoming columns and the entity's key becoming the primary key. Multi-valued attributes become separate tables linked by foreign keys.
2) Weak entities become tables with a composite primary key of the strong entity's primary key and the weak entity's key.
3) Relationships are represented by either adding foreign keys between tables or creating a separate table for many-to-many relationships containing foreign keys from the related tables.
Library mangement system project srs documentation.docjimmykhan
The document describes a library management system created in Java. It has four main modules: inserting data into the database, extracting data from the database, generating reports on borrowed and available books, and a search facility. The proposed system automates library processes like adding members and books, searching, borrowing and returning books. This makes transactions faster and reduces errors compared to the manual existing system. The system was implemented using Java, MS Access for the database, and designed to run on Windows operating systems. Testing was done to check functionality and ensure all requirements were met.
This document provides an overview of functional modeling and the Object Modeling Technique (OMT) methodology for object-oriented systems analysis and design. It describes functional modeling using data flow diagrams and the key components of OMT, including the analysis, design, and implementation phases. The analysis phase involves creating object, dynamic, and functional models to specify the system. Comparisons are made between OMT and other methodologies like Structured Analysis/Design and Jackson Structured Design.
This document discusses functional modeling and data flow diagrams (DFDs) for object-oriented systems. It provides an overview of the following topics:
1. Functional modeling uses DFDs to represent how input and output values are derived in a program through processes and data flows.
2. DFDs graphically show the flow of data through a system using processes, data stores, flows, and external entities. They can be layered with increasing specificity.
3. Specifying operations for a functional model involves identifying inputs/outputs, building the DFD, describing functions, identifying constraints, and specifying optimization criteria.
4. The document also briefly introduces the Object Modeling Technique (OMT) methodology
The document discusses rules and guidelines for creating data flow diagrams (DFDs). It explains the key components of DFDs including external entities, data stores, data flows, and processes. It provides rules for how these components can and cannot be connected and used. It also discusses creating context diagrams, level-0 diagrams, and decomposing DFDs into lower levels through a balancing process.
This document provides an overview of data flow diagrams (DFDs) and context diagrams. It discusses what DFDs are used for, including communicating requirements to stakeholders and analyzing existing and proposed systems. The key elements of DFDs are described as external entities, processes, data stores, and data flows. Context diagrams show the major information flows between external entities and the system at a high level. Lower level DFDs then decompose the processes into more detail.
Data Flow Diagrams (DFDs) are graphical tools used in software engineering to visualize how data moves through a system. A DFD shows the flow of data between external entities and processes, as well as data storage components. It uses standard symbols like rectangles, circles, and arrows. DFDs are hierarchical, with multiple levels showing increasing detail. A 0-level DFD provides an overview of the entire system as a single bubble, while 1-level and 2-level DFDs decompose this into subprocesses and further detail. Key aspects like inputs, outputs, processes, and data storage are represented. DFDs do not show control flow or logic.
Data flow diagrams (DFDs) are a visual way to represent how data moves through a system or process. DFDs show the four major components of a system - entities, processes, data stores, and data flows. Entities are sources or destinations of data outside the system boundary. Processes perform functions to transform data. Data stores hold data between processes. Data flows represent the movement of data between components. DFDs are hierarchical, with a high-level overview in a Level 0 diagram drilled down into more detail in lower-level diagrams. DFDs help analysts, designers and others understand how a current or planned system will work at a glance.
SWE-401 - 6. Software Analysis and Design Toolsghayour abbas
The document discusses several software analysis and design tools used by software designers including:
- Data Flow Diagrams (DFDs) which graphically depict the flow of data in a system. DFDs come in logical and physical types.
- Structure Charts which represent the hierarchical structure and functions of system modules in greater detail than DFDs.
- HIPO Diagrams which decompose system functions hierarchically and depict functions performed without data or control flow.
- Additional tools discussed are Structured English, Pseudo-Code, Decision Tables and Entity-Relationship Models.
The document discusses process modeling and data flow diagrams (DFDs). It defines process modeling as a technique used to organize and document a system's processes and flow of data through those processes. DFDs are introduced as a type of process model that depict the flow of data through a system using various symbols like processes, data stores, external entities, and data flows. The document outlines the benefits of process modeling and DFDs, provides examples, and describes the basic components, guidelines, and steps for creating DFDs, including drawing a context diagram and decomposing it into level-0 and level-1 DFDs.
Data flow diagrams (DFDs) are used to represent the flow of data in a system. They consist of symbols including external entities, data stores, processes, and data flows. There are several rules for constructing accurate and useful DFDs:
- External entities interact with the system from outside and represent sources or sinks of data, while processes and data stores are internal.
- Processes must have at least one input and output, and cannot create or destroy data. Data stores represent data at rest within the system.
- Data flows represent data in motion, connecting different symbols, but data cannot flow directly between some symbols like stores and sinks.
- DFDs are developed through an iterative process
The document provides information on data flow diagrams (DFDs), including how to construct multi-level DFDs through context diagrams, level 0 diagrams, and lower level diagrams. It gives steps for developing DFDs, including identifying external entities, major processes, and data flows. Examples are provided to demonstrate a DFD for a home security system and a lemonade stand business.
The document discusses data flow diagrams (DFDs), including their purpose, components, levels, and how to construct them. DFDs model the flow of data through a system and are made up of external entities, processes, data stores, and data flows. They are constructed at multiple levels of detail, with level 0 providing an overview and level 1 diagrams decomposing level 0 processes. The document provides an example of constructing DFDs for a lemonade stand system to demonstrate the key steps of identifying activities, creating a context diagram, developing a level 0 diagram, and decomposing into level 1 diagrams.
A Data Flow Diagram (DFD) visually represents the flow of information within a system using symbols like circles, arrows, and parallel lines. It shows how data enters and leaves the system as well as where data is stored. DFDs are broken into levels that depict increasing functional detail, starting with a context-level diagram representing the entire system as one process and external entities, then breaking the system into sub-processes at lower levels. Key elements are uniquely named and DFDs avoid logical decisions or excessive detail to clearly depict data flows.
A data flow diagram (DFD) is a graphical representation of the "flow" of data through an information system, modeling its process aspects.
Why DFD technique is so Popular?
Symbols used in DFD
Constructing DFD Models
Data Dictionary
Developing the DFD model of System
Level O DFD or Context Diagram
Level 1 DFD
Strengths of DFD Model
Weaknesses of DFD Model
Data flow diagrams (DFDs) are used to model systems by showing how data inputs are transformed through processes into output results. DFDs consist of four main components: entities that are external sources or destinations of data, processes that manipulate data, data stores that hold data between processes, and data flows that show the movement of data between components. DFDs use simple symbols and syntax to represent these components and how they interact in a clear, easy to understand way for both technical and non-technical audiences.
Here we uploaded E workshop system design with complete details. This details helpful for students who are freshers. Even software developers can refer this document. For project source code visit www.studentprojectguide.com
- Data flow diagrams (DFDs) graphically describe the flow of data within an organization using four basic elements: data sources and destinations, data flows, transformation processes, and data stores. DFDs are subdivided into lower levels to provide more detail. The highest-level DFD is called the context diagram.
- Flowcharts are used to describe business processes and document flows using standard symbols divided into four categories: input/output, processing, storage, and miscellaneous. Types of flowcharts include program, system, document, and internal control flowcharts.
- Business process diagrams visually describe the steps in a business process.
Data flow diagrams (DFDs) graphically represent the flow of data through a system. This document discusses DFDs, including their components, levels, and an example. DFDs show data flowing between external entities and processes, and stored in data stores. They are used to understand business processes, document existing systems, and find logic in data flow. The document presents a DFD for an SMS notification system, including a context diagram, level-0 diagram, and level-1 diagram for the "Buy/add SMS" process. In summary, DFDs are a useful tool for system development and understanding data flow through a process.
The document discusses data flow diagrams (DFDs), including their purpose and standard symbols. It explains that a DFD visually represents the flow of data in a system and can be decomposed into multiple levels of increasing detail, starting with a high-level 0-level DFD and then breaking processes down into 1-level and 2-level DFDs. Standard DFD symbols include bubbles for processes, arrows for data flows, parallel lines for data stores, and sources or sinks for external entities.
2. Overview:-Overview:-
Data flow diagrams(DFD) are commonly
used during problem analysis.
DFD is an useful tool for software engg as
well as for the developmnet of other
systems.
In fact, dfds have in use long before the
discipline of software engg started.
3. Salient features of any DFD:-Salient features of any DFD:-
DFDs are basically used to show the flow
of data through a system.
The System may be an organization,a
manual procedure, a software system, a
mechanical system,a hardware system or
any possible combination of these.
There are several processes in a dfd.
Each process is shown by named
circles(or bubbles).
4. Salient features of any DFD(contd….)Salient features of any DFD(contd….)
Data flows are represented by named arrows
entering (or leaving) the bubbles.
A rectangle represents the source which is either
a net originator or consumer of data.
All external files are shown as a labeled straight
line.
When multiple data flows are required by a
system this is represented by a ‘*’ between the
data flows.This symbol represents the AND
operation.
5. How is a DFD different from aHow is a DFD different from a
flowchart?flowchart?
One must always remember that a dfd is not a
flowchart.
While a DFD represents the “flow of data” a flow
chart shows the “flow of control”.
A dfd does not represent procedural
information.For eg:- considerations of loops and
decisions must be ignored.
In drawing the dfd the designer has to specify
what are the major transforms in the flow of the
data from the input to the output.
6. How is a DFD different from aHow is a DFD different from a
flowchart?(contd…)flowchart?(contd…)
How the transforms are occurring is not
the concern of the designer.
Error messages are not shown in the dfd.
7. DFDs for large systems(LeveledDFDs for large systems(Leveled
DFDs)DFDs)
Many systems are too large for a single dfd to
represent the entire data processing clearly.
So, it becomes necessary that some
decomposition and abstraction mechanisms be
used for such large systems.
DFDs can be hierarchically organized which
helps in progressive partitioning and analyzing of
large systems.
Such dfds are called “Leveled DFD set”
8. How to draw a Leveled DFD set?How to draw a Leveled DFD set?
A leveled DFD set has a starting dfd, which is a
very abstract representation of the system
identifying the major inputs ,outputs and the
major processes in the system.
Then each process is refined and a dfd is shown
for the corresponding refinements.
In other words, a bubble in a dfd is expanded
into another dfd during refinement.
For the hierarchy to be consistent ,it is necessary
that the net inputs and outputs
9. How to draw a Leveled DFD set?(contd…)How to draw a Leveled DFD set?(contd…)
of a dfd for a process are the same as the
inputs and the outputs of the process in
the higher level dfd.
This refinement stops if each bubble is
considered to be “atomic” ; in that case
each bubble can be easily specified or
understood.
The top level dfd is sometimes called the
“context-diagram”.
10. Suggestions for DFD construction:-Suggestions for DFD construction:-
Start with a data flow graph with a few
major transforms describing the entire
transformation form the inputs to the
outputs and then refining each transform
with more detailed transforms.
We must never try to show the control
logic.If we find ourselves to be thinking in
terms of loops and decisions then it is time
to stop and start again.
11. Suggestions(contd….)Suggestions(contd….)
Label each arrow with proper data elements and
inputs and outputs of each transform needs to be
carefully identified.
Make use of ‘*’ and ‘+’ signs and show sufficient
data in the data flow graph.
Try and draw alternate data flow graphs before
settling on one.
After drawing the dfd the next step is to establish
a man-machine boundary by specifying what will
be automated and what will remain manual in the
dfd for the new system.
12. Data Dictionary:-Data Dictionary:-
Data dictionary is almost a data structure
that keeps track of information about data
flows.
Data dictionary states precisely the
structure of each data flow in the dfd.
The structure of a data could be defined
with different notations which are almost
similar to those used for regular
expressions.
13. Data Dictionary:-(contd…)
Some of the commonly used notations are
as below:-
“+” indicates composition.
“|” indicates one OR the other.
“*” indicates one or more occurences.
14. DFD of a System that Pays Workers :
Employee Record Company Records
Weekly Timesheet Tax Rates
Get
Employee
File
Weekly
Pay
Overtime
pay
Deducted
Pay
Issue
Pay
Check
Worker
Overtime
Rate
Overtime
Hours
Regular
Hours
Employee
Id
Pay
Rate
Pay Net
Pay
Total
Pay
Check
Worker
15. Analysis of the dfd system for
payment of worker’s:-
In this dfd there is one basic input data
flow and that is the weekly time sheet,
which originates form the source
worker.
The basic output is the paycheck, the
sink for which is also the worker.
In this system first the employee’s
record is retrieved using the employee
id,which is contained in the timesheet.
16. Analysis of the dfd system for
payment of worker’s:-
From the employee record the rate of
payment and overtime rate are
obtained.These rates and the regular
overtime hours(from the timesheet) are
used to compute the pay.
After the total pay is determined,taxes are
deducted.
17. Analysis of the dfd system for
payment of worker’s:-
To compute the tax deduction,information
from the tax-rate file is used.The amount
of tax deducted is recorded in the
company and employee records.
Finally the paycheck is issued for the net-
pay.The amount paid is also recorded in
the company records.
18. A sample Data dictionary:-
The data dictionary for the problem involving the
payment of workers is as below:-
Weekly
timesheet=Employee_name+Employee_id+
[Regular Hours+Overtime Hours]*
Pay_rate=[Hourly|daily|weekly]+Dollar_Amount
Employee_name=First+Middle+Last
Employee_id=digit+digit+digit+digit
19. An Example :A restaurant SystemAn Example :A restaurant System
A restaurant owner felts that some amount
of automation will help him in making the
business more efficient .
DIFFERENT PARTIES INVOLVED:
CLIENT: The Restaurant Owner
POTENTIAL USER: Waiter, Cash register
Operator
20. DFD of a Restaurant System
Supply
Information
Member
Sale
Information
Restaurant
Supplier
Customer
Supply
OrderOfSupplier
Paym
ent
O
rders
Receipt
Final Bill
Several Bill
21. Data Flow Diagram of Spell Check Problem:Data Flow Diagram of Spell Check Problem:
New Dictionary
Misspelled
Word
Get File
Name
Split the
Words
Sort
Words
Lookup
Dictionary
Handle
Unknown
Word
User
Command
FileName
Document
W
ord
List
Sorted
W
ordList
Dictionary
Word not
In
Dictionary
Dictionary
Good
Words
Bad
Words
22. Problem 2:Problem 2:
Library System:Library System:
Needs
Books
Checks
The
Collection
Arranges
Signed on
The card
DeliverReadsReturnsRecollect
File name
Reader
Preferable
Book
Librarian
Books
The
Particular
Book
Library
Card
Selected
BookReader
Library
card
Books
24. Jagson’s Structured
Programming(JSP):-
JSP is a systematic technique for mapping the
structure of any problem into a program
structure.
The 3 steps for construction of any JSP are:-
To draw the “data structure diagram” for each
data set.
Form a “program structure diagram” from the
data structure diagram.
List all “operations” ,”functional components” and
“conditions”.
26. Data Structure Diagram:
Transaction File
File Header File Body End of File Masker
Customer
Accounts
Account Header Account Body
Transaction
Deposit With Drawal
27. Program Structure Diagram
ProcessProcess TransactionTransaction
FileFile
Program StartProgram Start
(1,3)(1,3)
Program BodyProgram Body
(c1)(c1)
Program EndProgram End
(2,6)(2,6)
Process CustomerProcess Customer
(c1 or c2)(c1 or c2)
Process Customer StartProcess Customer Start
(7)(7)
Process Customer BodyProcess Customer Body
Process accountProcess account
Process Account StartProcess Account Start
(3,8)(3,8)
Process Account BodyProcess Account Body
(c1 or c2 or c3)(c1 or c2 or c3)
Process TransactionProcess Transaction
Process DepositProcess Deposit
(3,4)(3,4)
Process WithdrawalProcess Withdrawal
(3,5)(3,5)
28. Operations:-
1. Open Transaction File.
2. Close Transaction File.
3. Read a Record form the file.
4. Add Amount deposited to the total amount.
5. Add amount withdrawn to the total amount.
6. Output the two totals.
7. Set Current Cust_no Cust_no
8. Set Current Acct_no Account_no
30. JSP for Spelling Checker’sJSP for Spelling Checker’s
Problem:-Problem:-
Components:-
a)Document File
b)Dictionary File
c)Mispelled Words File
Conditions:-
C1 EOF
31. Spell Check Problem
This problem took each word used in a
document and in a dictionary. If a word
appears in the dictionary then the word is
correct .Otherwise it is displayed in the
user terminal, The user then decides if the
word is misspelled ,the word is held in a
file of misspelled words and if correctly
spelled then it is added to the dictionary
32. Procedure of Spell check problem:
Begin
loop
get next word
add word to word list in sorted
order
end from the loop when all word
are processed
endloop
33. contdcontd……..……..
loop
get word from sorted word list
If word is not in dictionary then
display the word and prompt
on the user terminal
if user response says word ok then
add word to the dictionary
else
add word to misspelled word list
end if
37. Program Structure Diagram Of Spell Check Problem
ProcessProcess
Spell CheckSpell Check
Program startProgram start
(1)(1)
Program BodyProgram Body
(c1)(c1)
Program EndProgram End
(2)(2)
ProcessProcess
DocumentDocument **
Start DocumentStart Document
Process(3,4)Process(3,4)
Document ProcessDocument Process
BodyBody
ProcessProcess
WordWord **
Start ProcessStart Process
WordWord
Process WordProcess Word
BodyBody
ProcessProcess
DocumentDocument **
38. Cont…
Process DictionaryProcess Dictionary
**
Start DictionaryStart Dictionary
Process(5)Process(5)
Dictionary ProcessDictionary Process
BodyBody
Process MisspelledProcess Misspelled
Word *Word *
Start Misspelled WordStart Misspelled Word
Process(6,7)Process(6,7)
Misspelled WordMisspelled Word
Process BodyProcess Body
Good WordGood Word
(3)(3)
Bad WordBad Word
(8)(8)
Process DictionaryProcess Dictionary
(9)(9)
39. Operations:-
1. Open document file and dictionary.
2. Split the document into words.
3. Sort the words.
4. Lookup the sorted words in the dictionary.
5. Collect the mis-spelt words or output them.
6. Add mis-spelt words to mis-spelt word list.
7. Identify good words form mis-spelt words.
8. Add good words to the dictionary.
9. Output the bad words to the user.
10. Close the file.
40. Bank Problem:-
A problem is received to process Bank transaction
keyed in at a terminal .The Program is to be
menu driven & the menu gives user three
option
1. Input of deposit
2. For input of withdrawal
3. Terminate program ( option-9)
Deposit are to be written to the deposit file and
withdraw are to be written in withdrawal file.
Additionally file trailers are to be appended to
deposit and withdrawal file containing the total
deposit and withdraw respectively
41. Data Structure Diagram of Bank Transaction
(Screen Data Structure Diagram)
Screen InputScreen Input
(1)(1)
Input BodyInput Body
(2)(2)
Option-9Option-9
Terminate(3)Terminate(3)
MenuMenu **
Option -1Option -1
Deposit (4)Deposit (4)
Option -2Option -2
Withdraw (4)Withdraw (4)
InvalidInvalid
OptionOption
42. Data Structure Diagram Of Deposit File and Withdrawal
File
Deposit FileDeposit File
(1)(1)
File BodyFile Body
(2)(2)
File TrailerFile Trailer
(3)(3)
DepositDeposit **
(4)(4)
Withdrawal FileWithdrawal File
(1)(1)
File BodyFile Body
(2)(2)
File TrailerFile Trailer
(3)(3)
WithdrawalWithdrawal **
(5)(5)
43. Program Structure Diagram of Bank
Transaction Problem
Process Screen
Input
Program Start
(1,3,4,5)
Program Body
(c3)
Program End
(2,13,14)
Process *
Menu
Process Menu
Body(c1,c2)
Process Menu
End
Process Option-1
Deposit
(7,9,11)
Process Option-2
Withdrawal
(8.10.12)
Process
44. Data Structure Diagram of File copy Problem
INFILE 1INFILE 1
INFILE 1INFILE 1 ** INFILE 2INFILE 2 **
INFILE 2INFILE 2
45. Program structure Diagram of File Copy
Copy INFILE1 ToCopy INFILE1 To
INFILE2INFILE2
Program StartProgram Start
(1,3)(1,3)
Program BodyProgram Body
(C1)(C1)
Program EndProgram End
(2)(2)
Copy INFILE1 ToCopy INFILE1 To
INFILE 2INFILE 2
(3,4,5)(3,4,5)