This document provides an overview of data flow diagrams (DFDs) and context diagrams. It defines key elements such as external entities, data flows, processes, and data stores. It explains how to construct a context diagram and DFDs at different levels of detail. Guidelines are provided around labeling processes and flows correctly. Examples of good and bad DFD design are shown. The document is intended to teach users how to create accurate and useful DFDs and context diagrams.
Overview of DFDs and context diagrams, provided by Mark Kelly at McKinnon Secondary College.
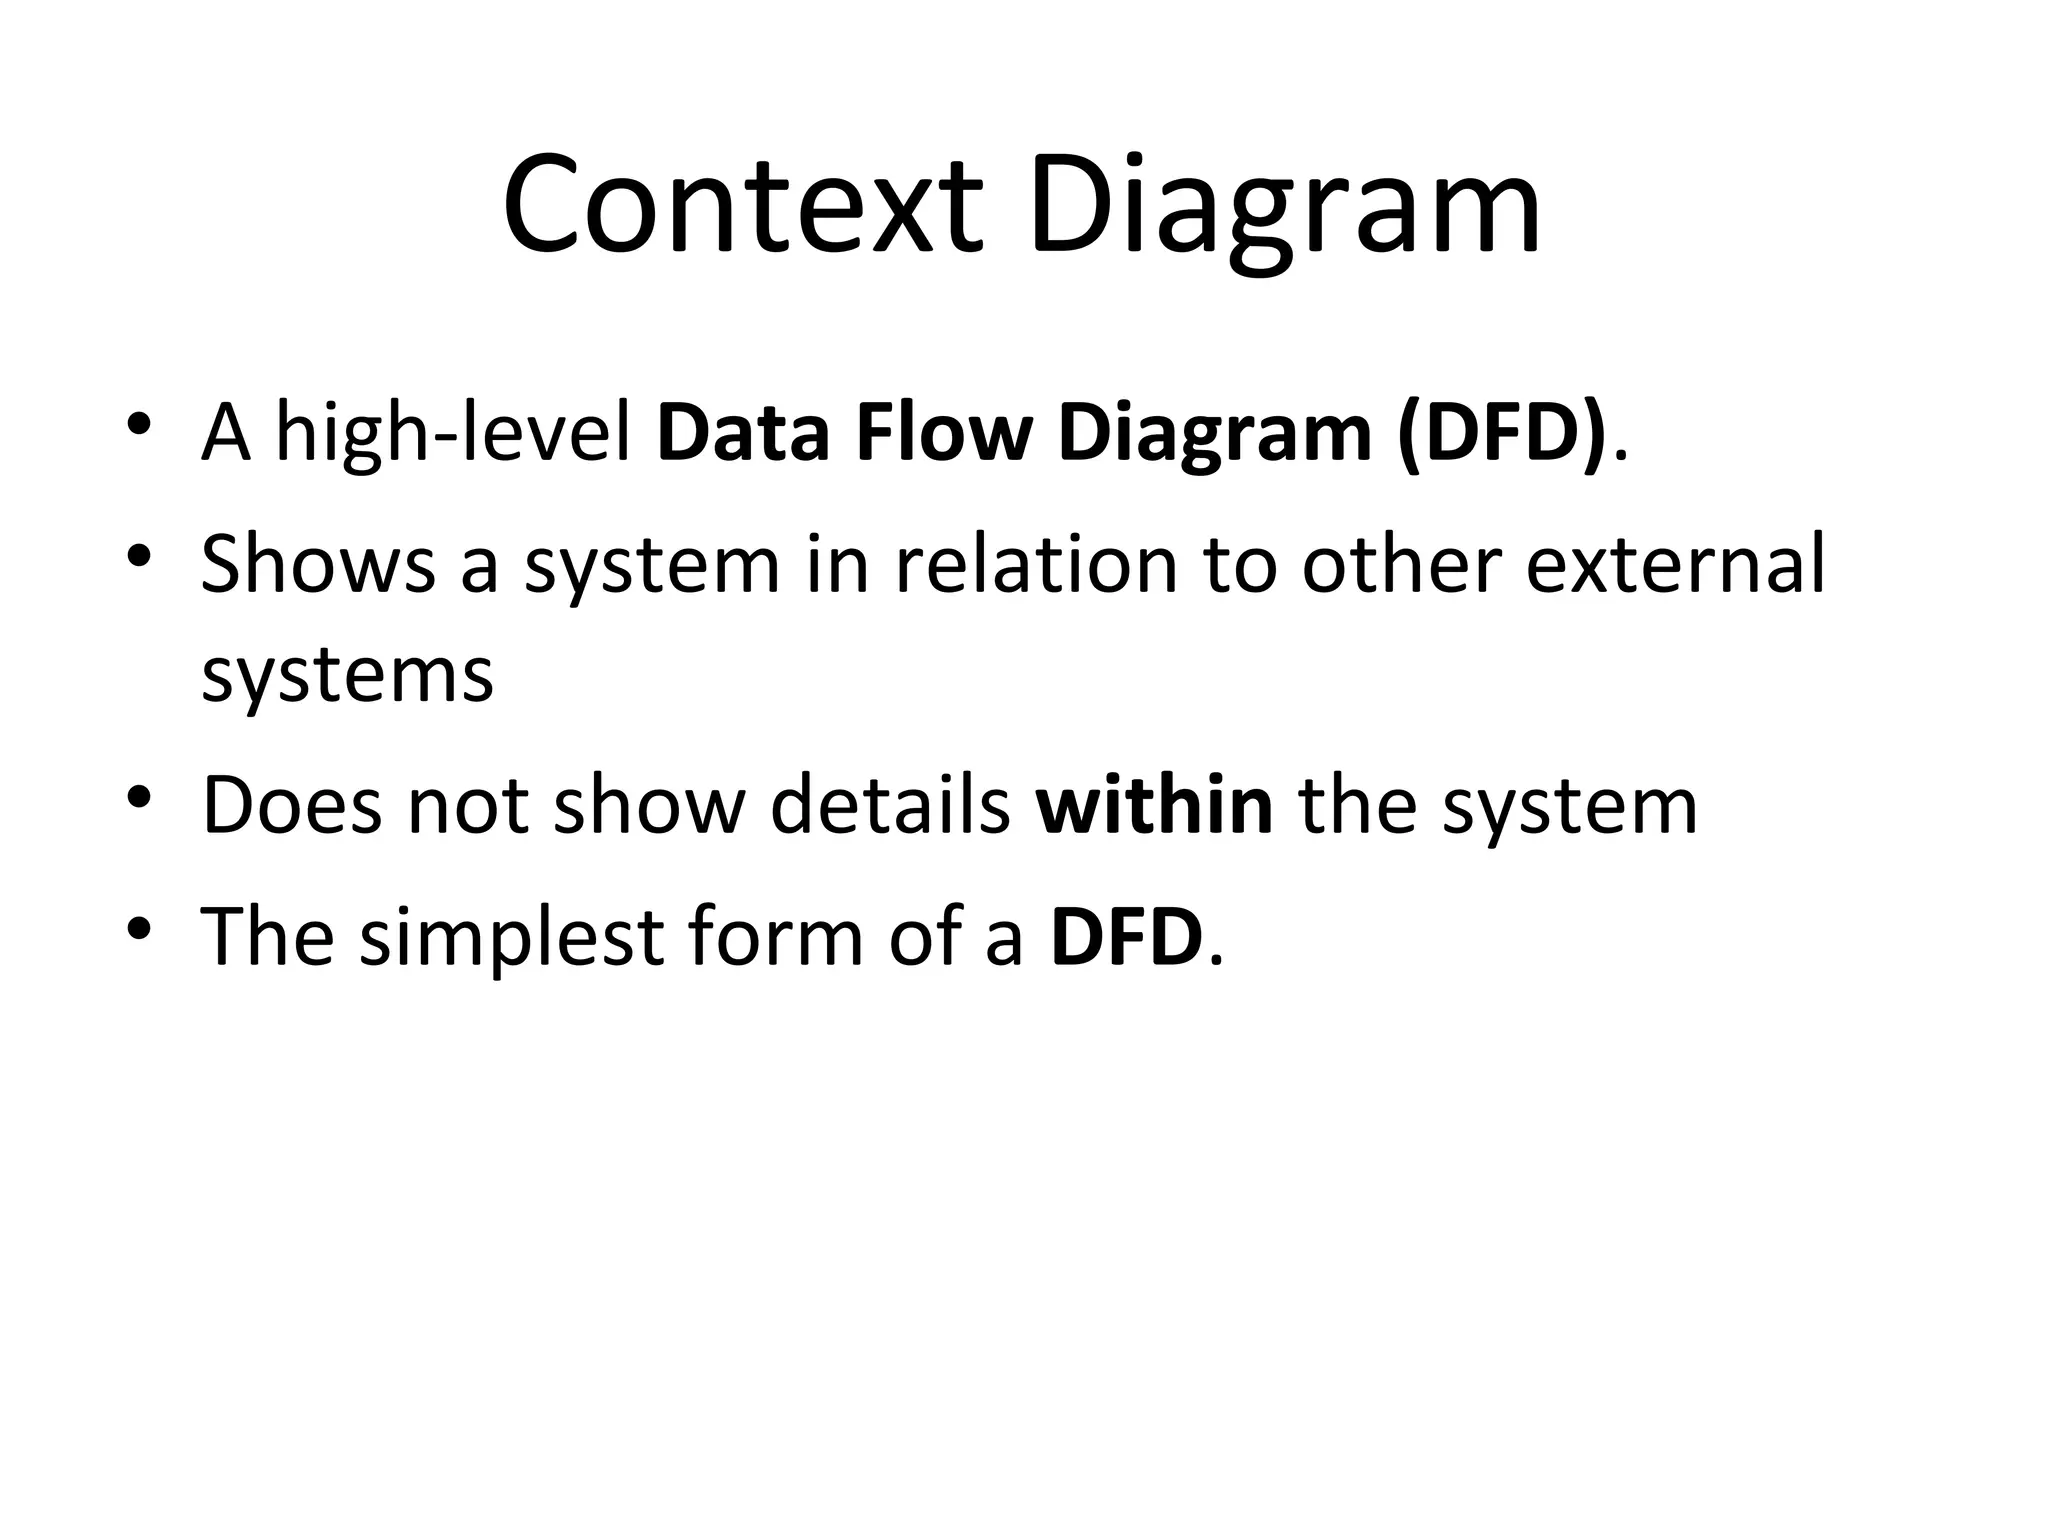
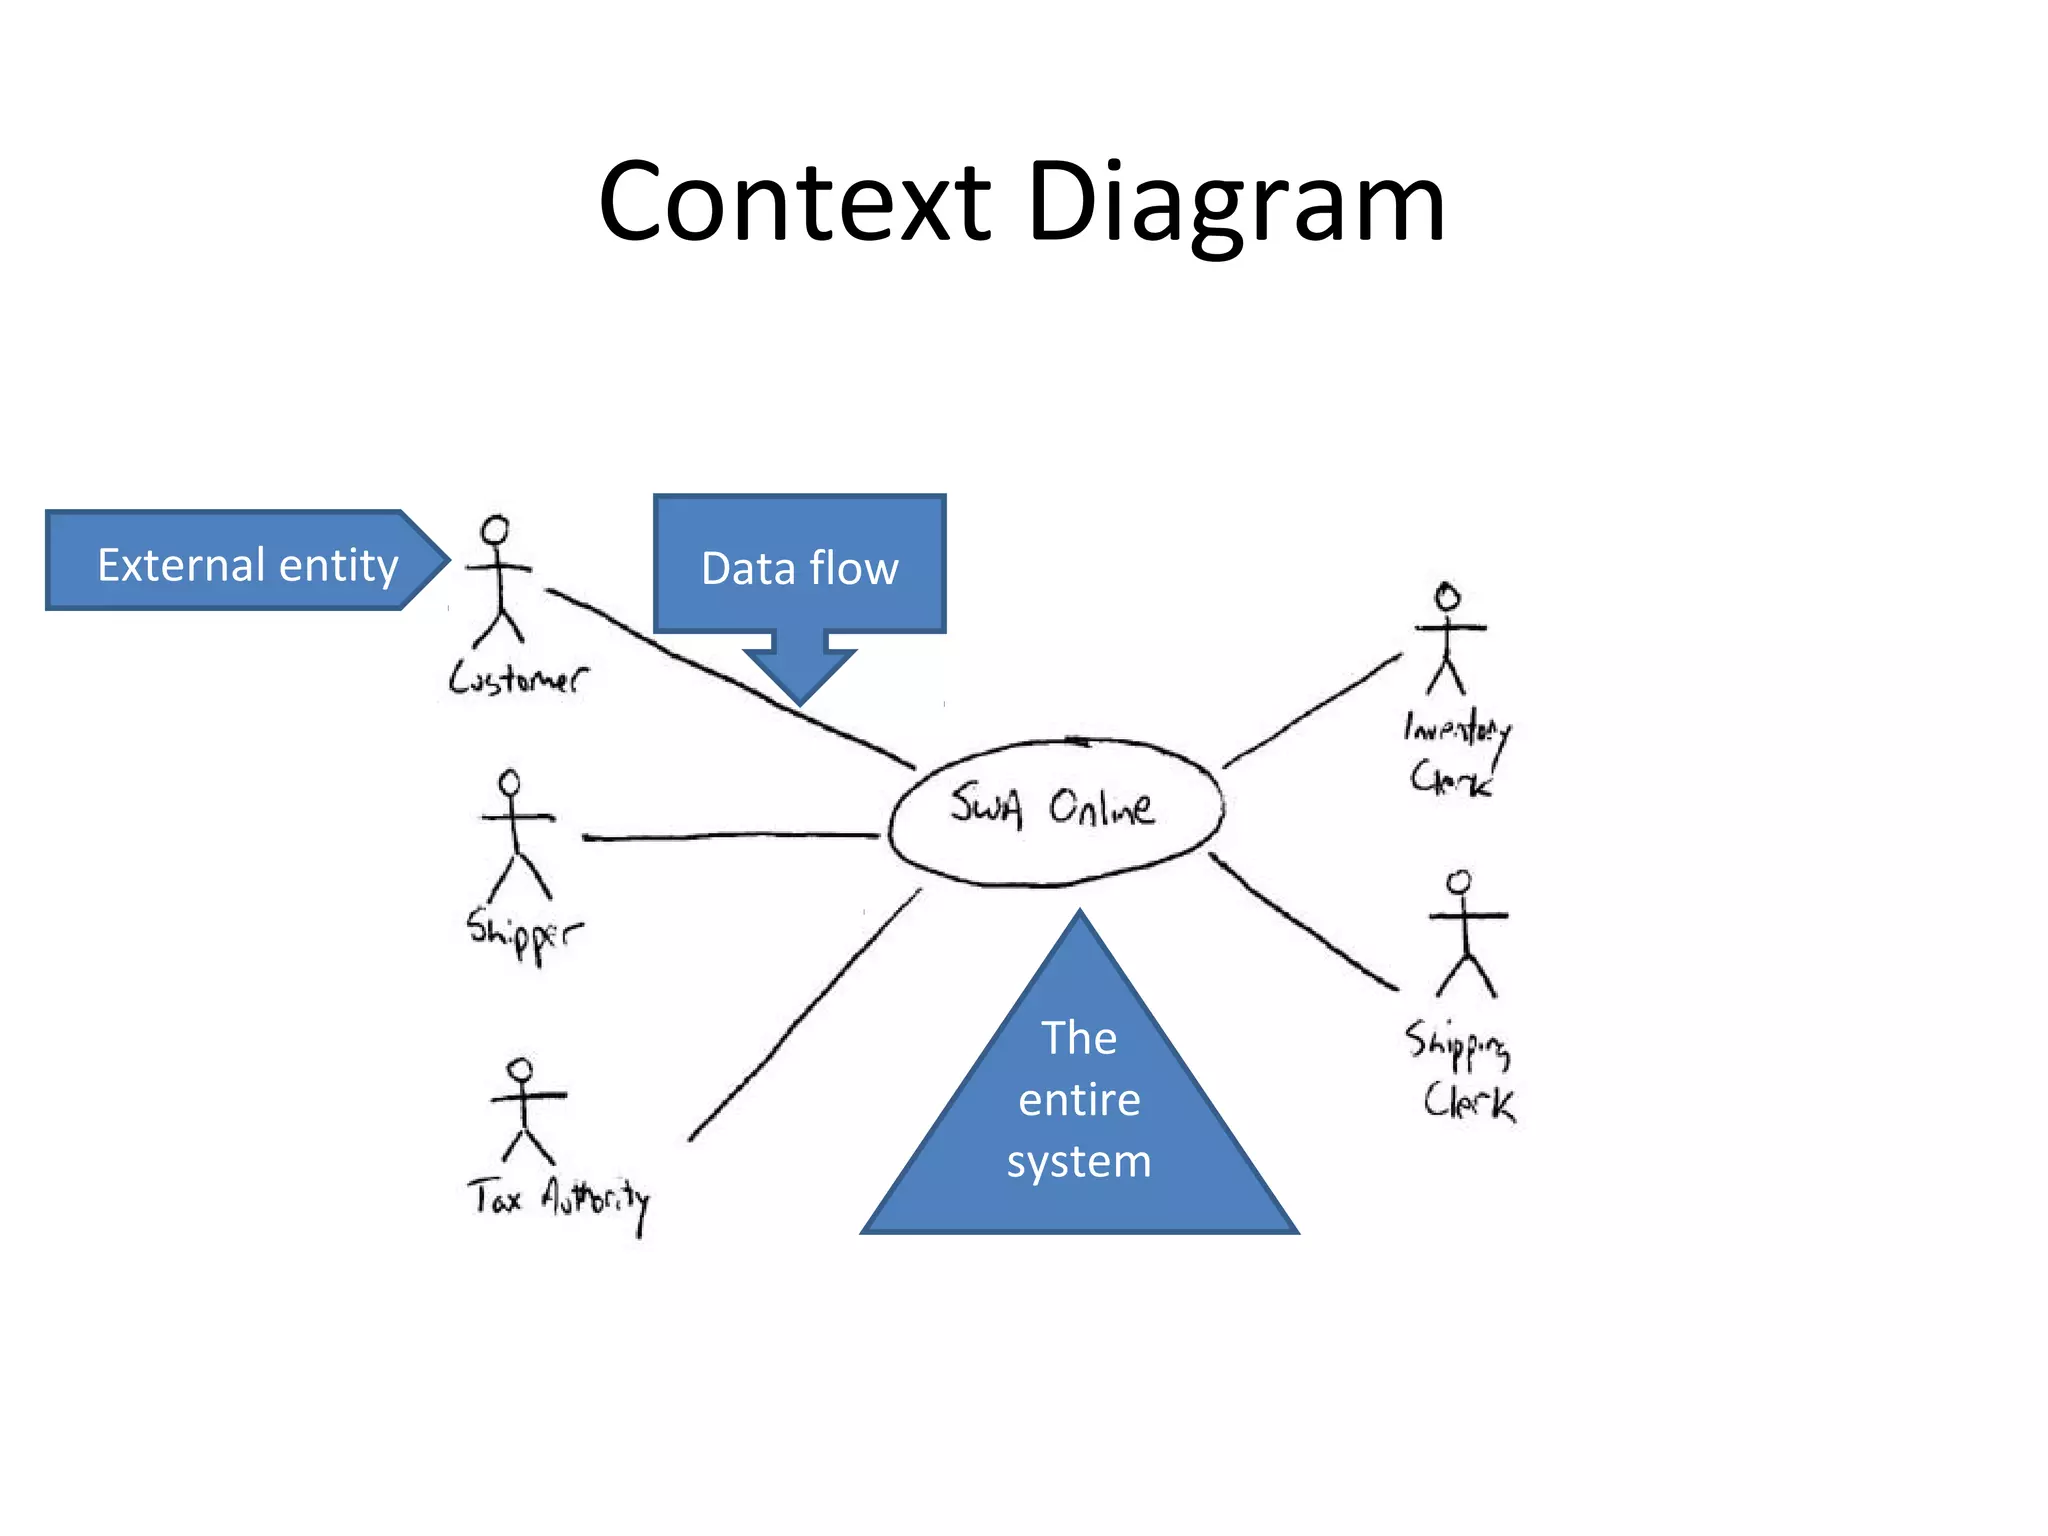
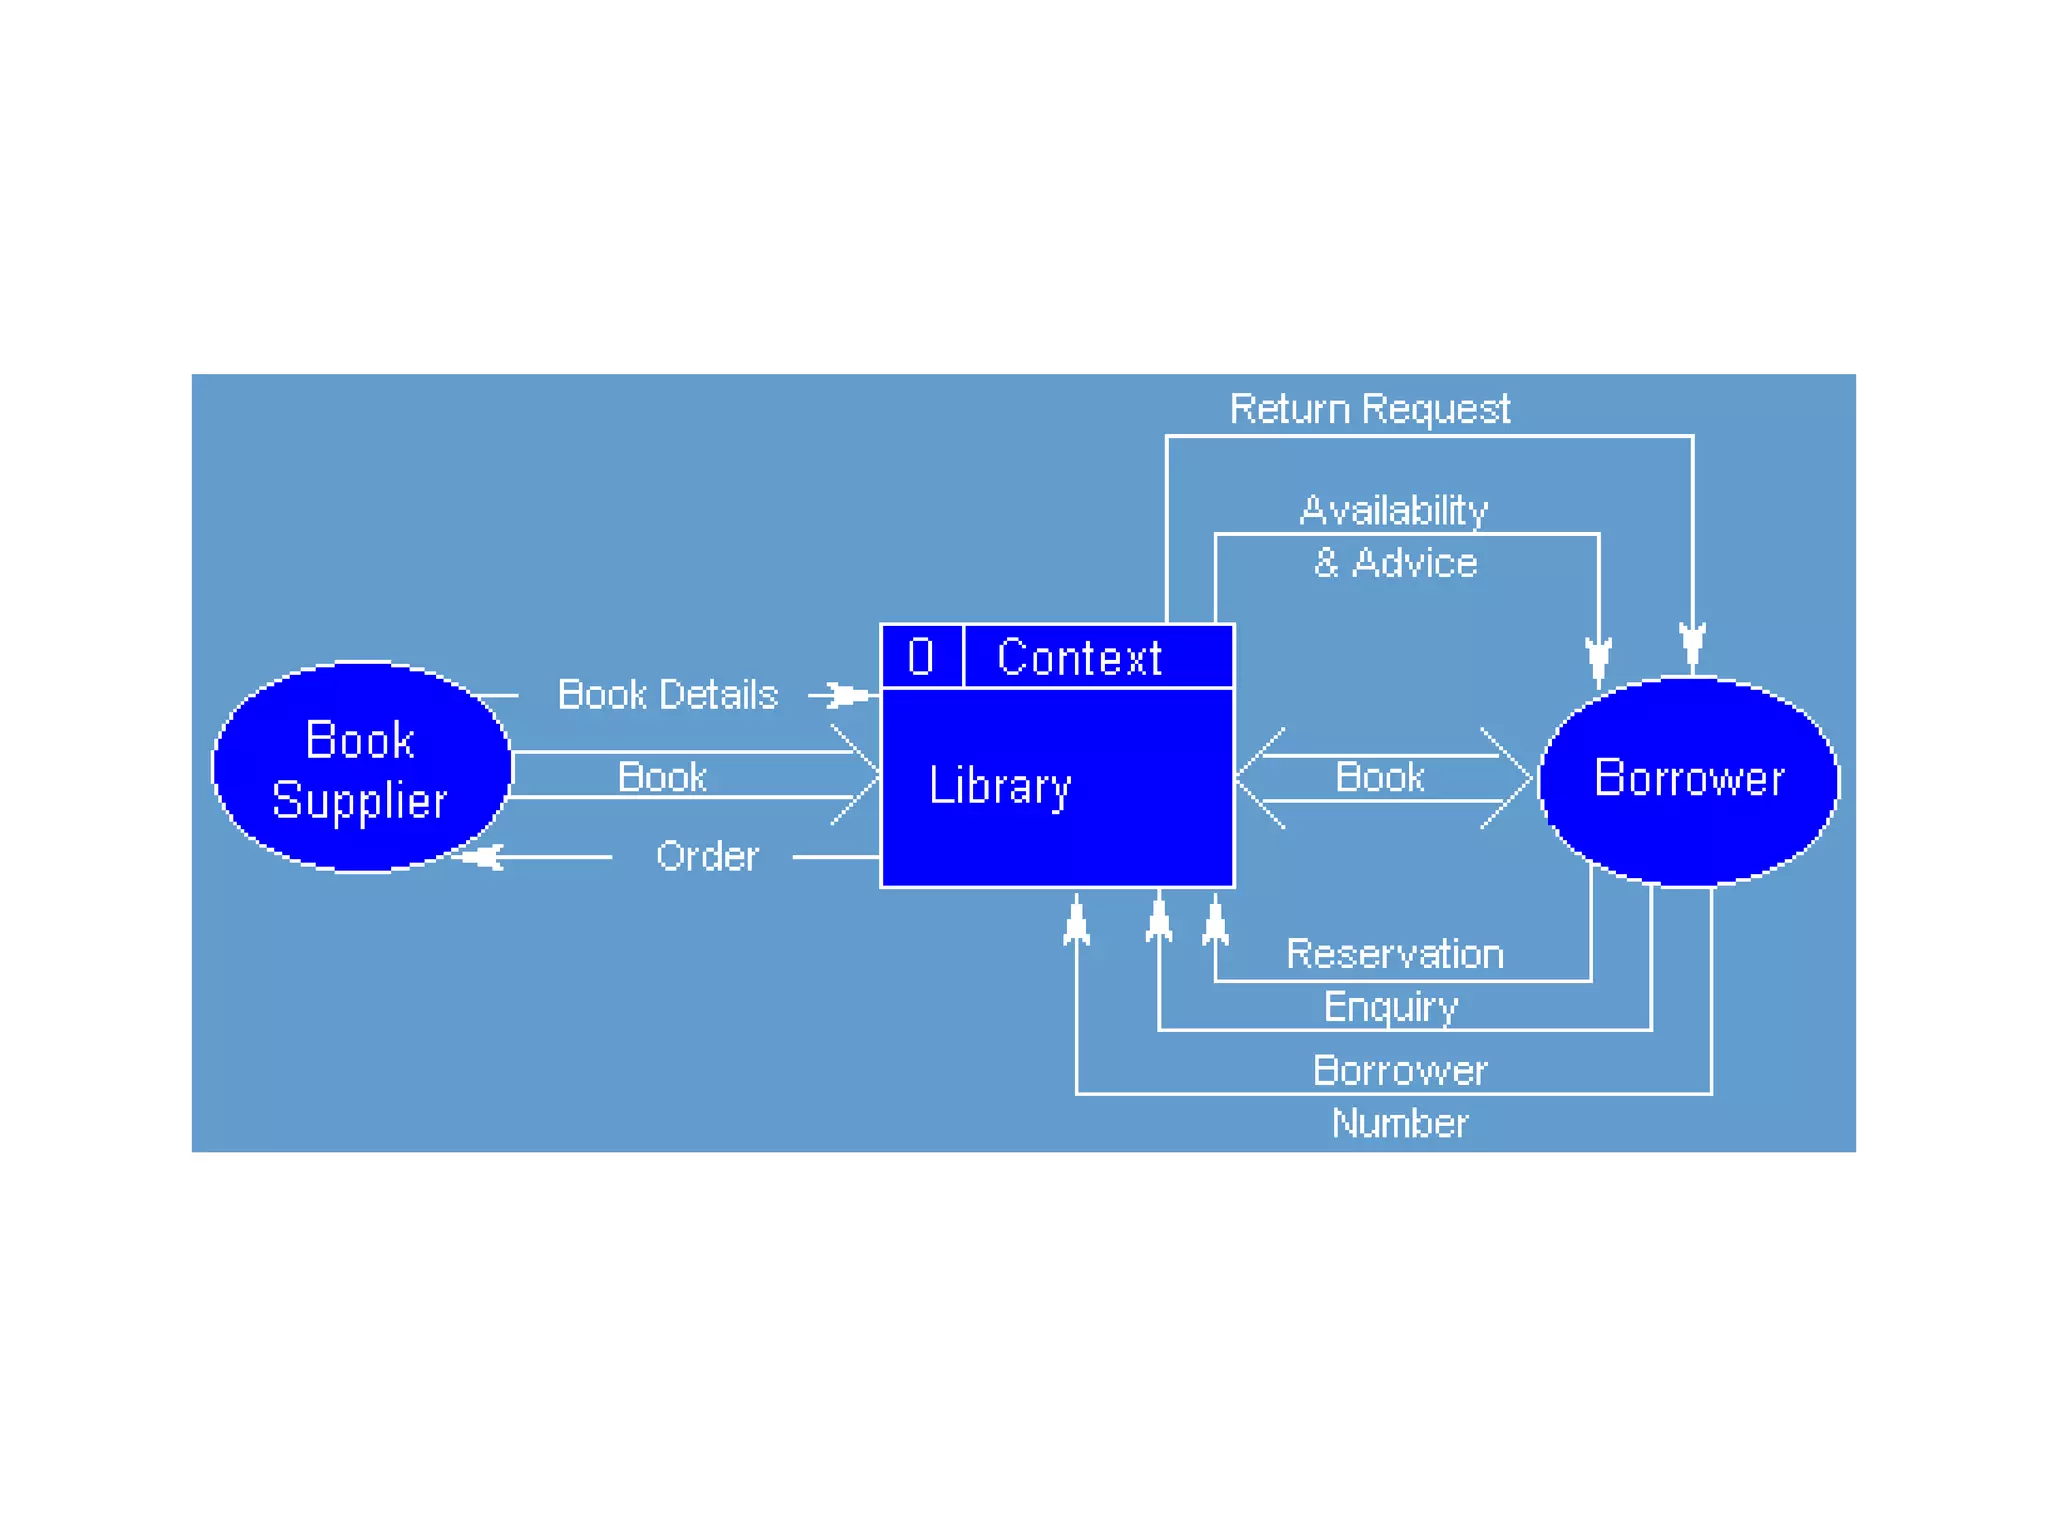
Context diagrams are high-level DFDs showing systems in relation to external entities without internal details.
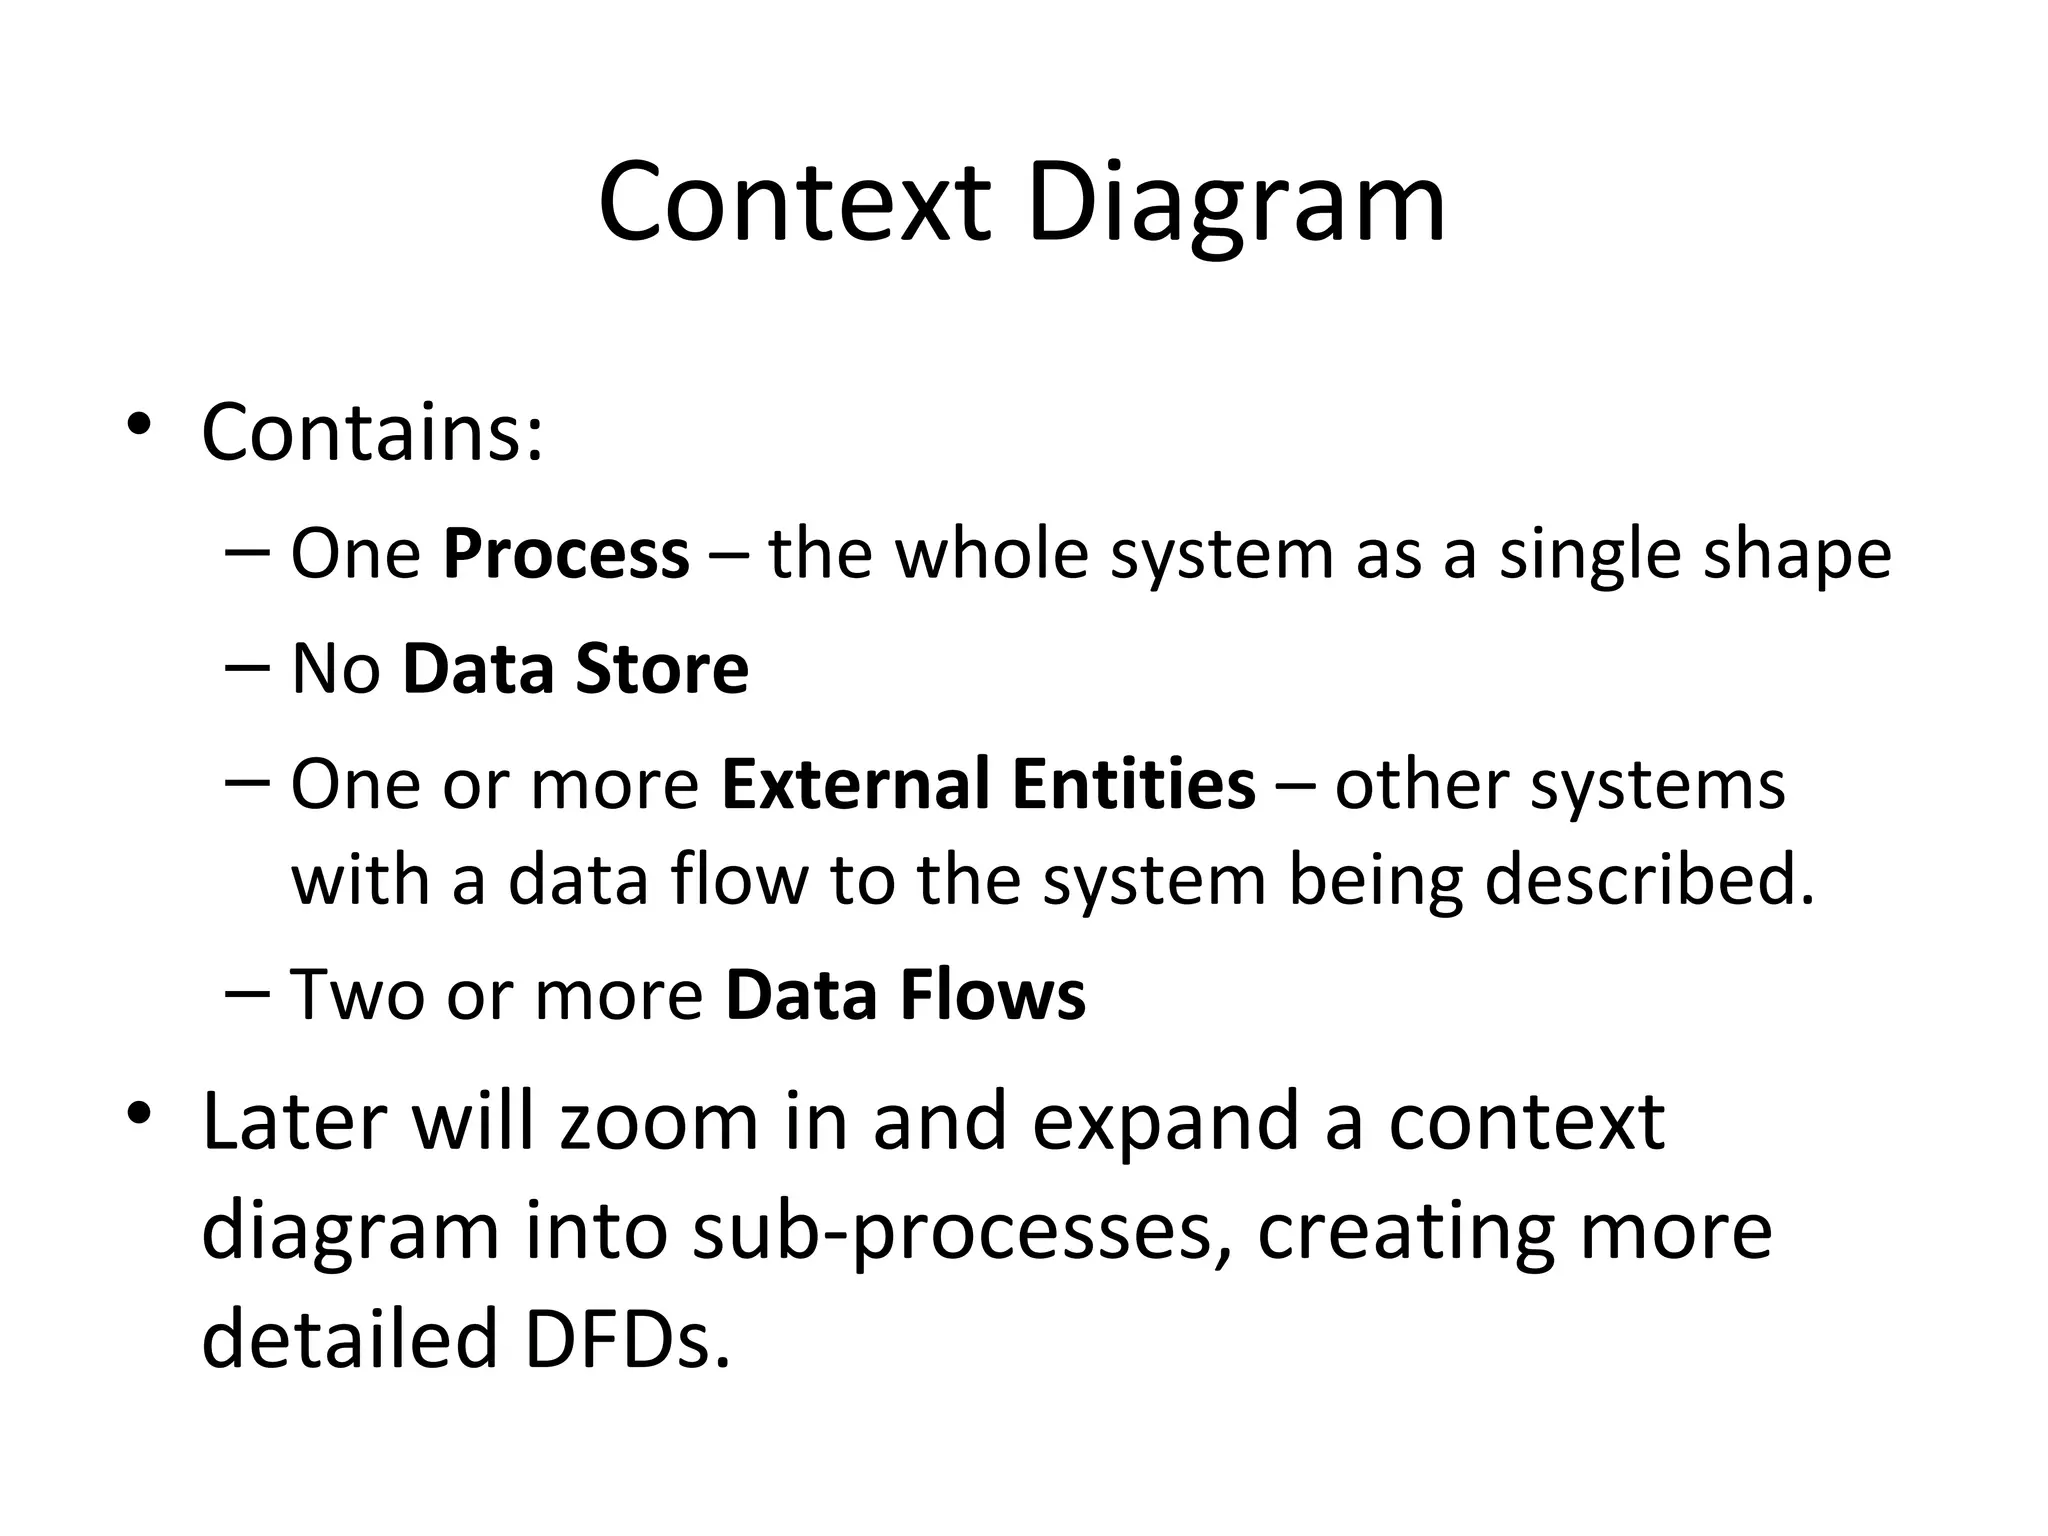
Key elements in context diagrams include processes, data flows, and the absence of data stores.
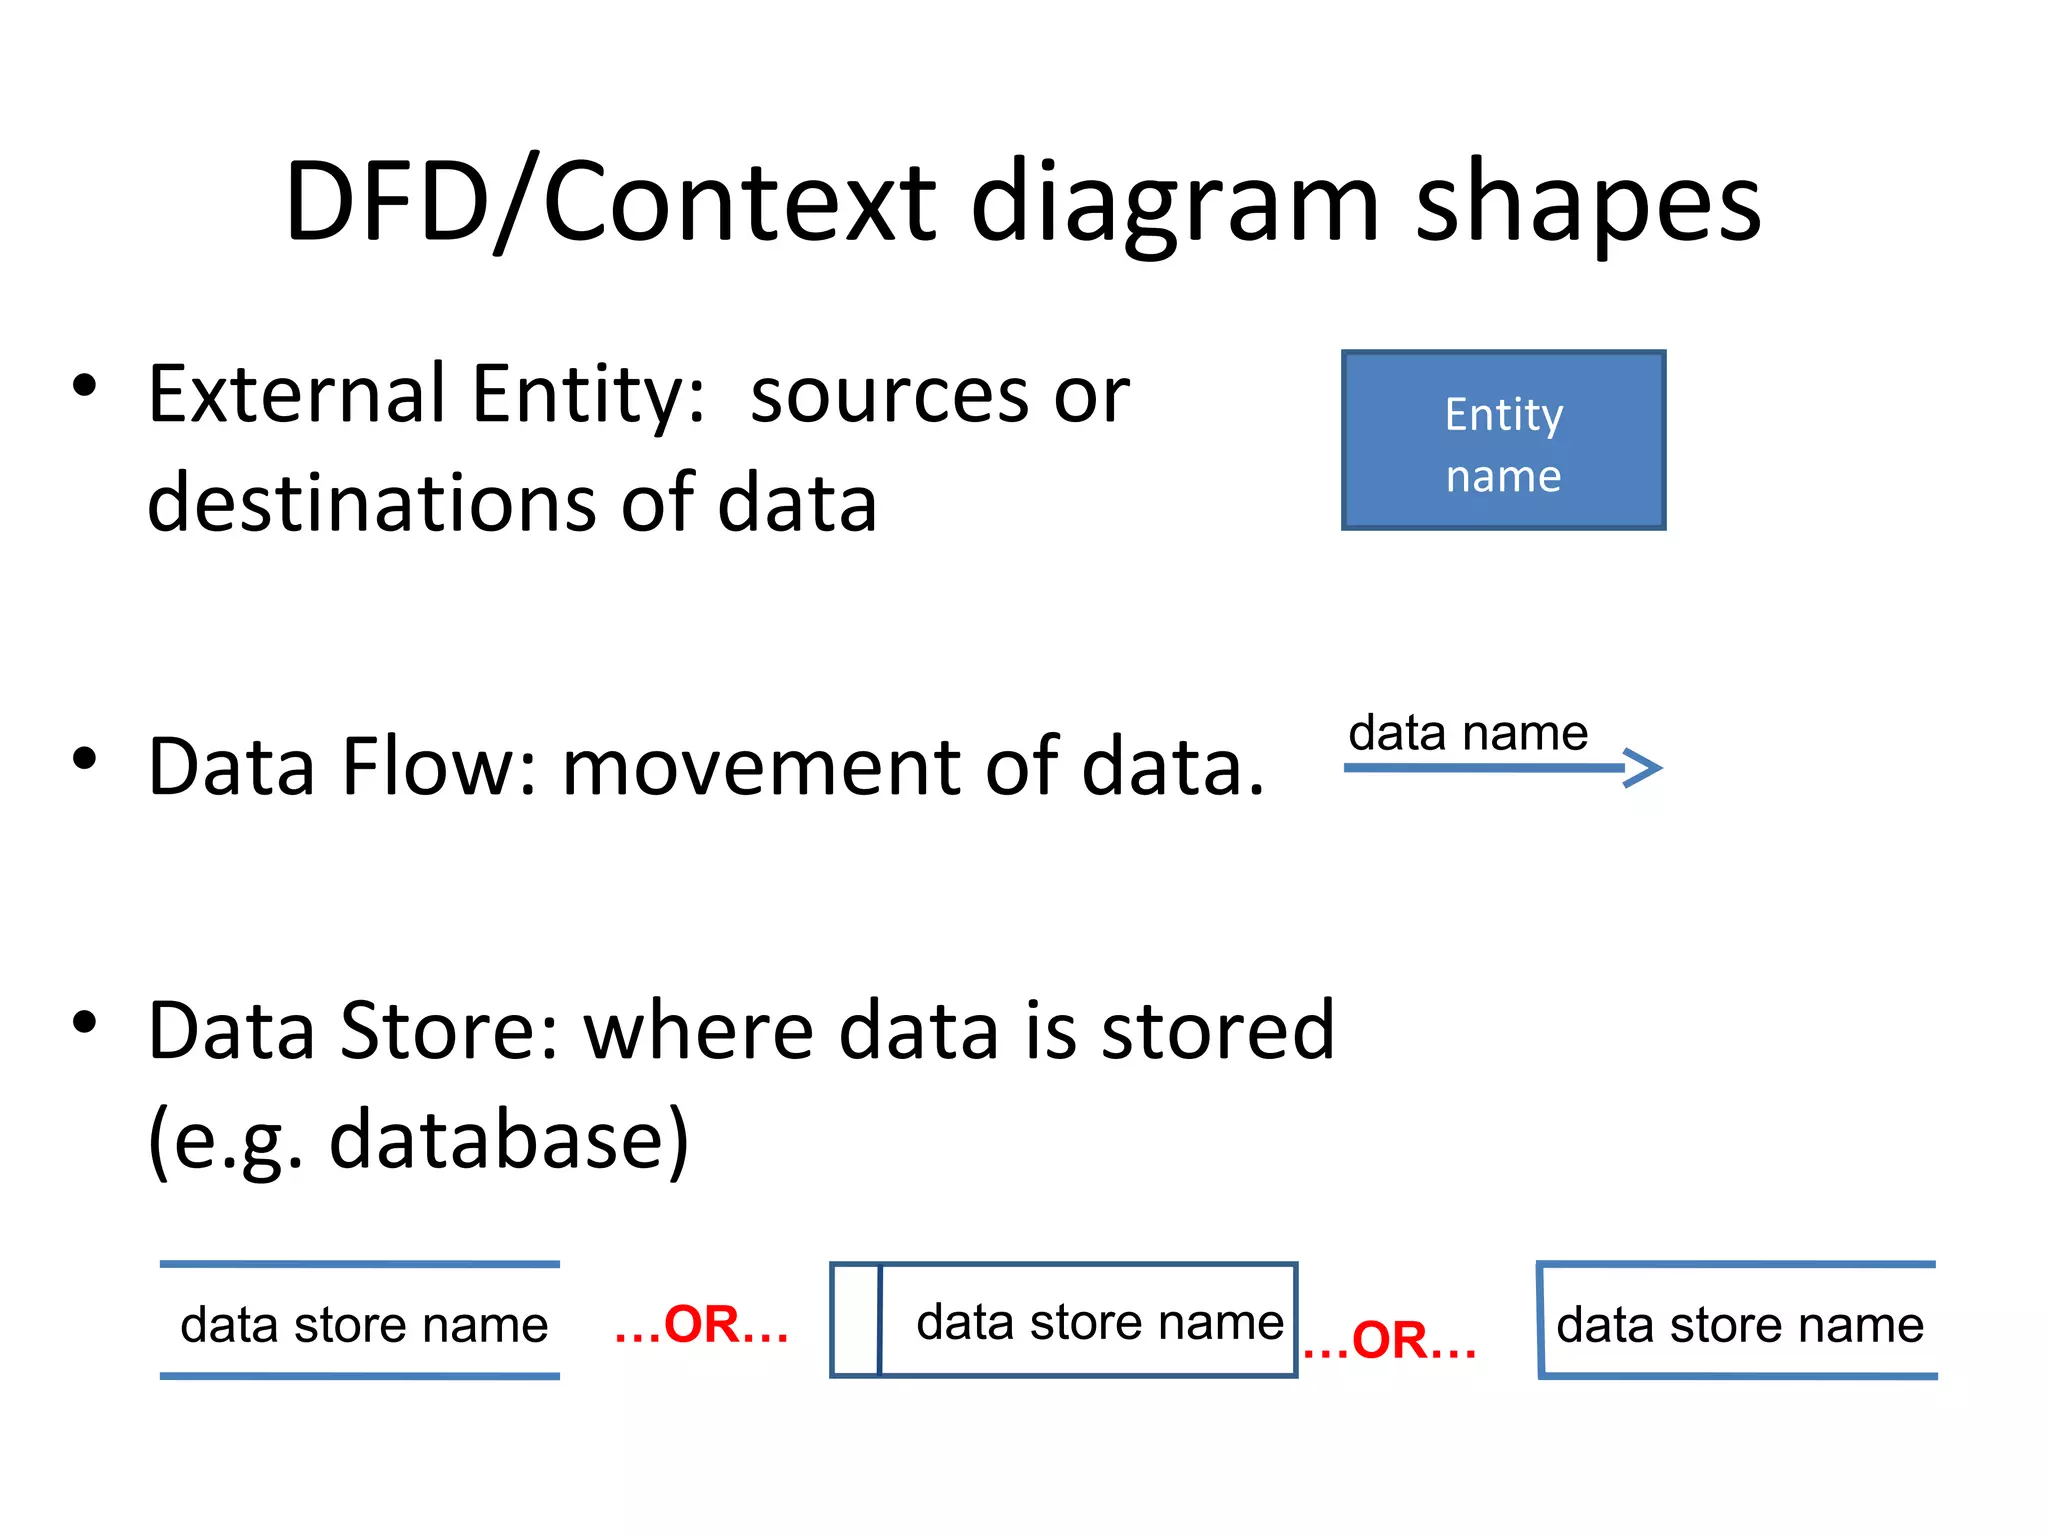
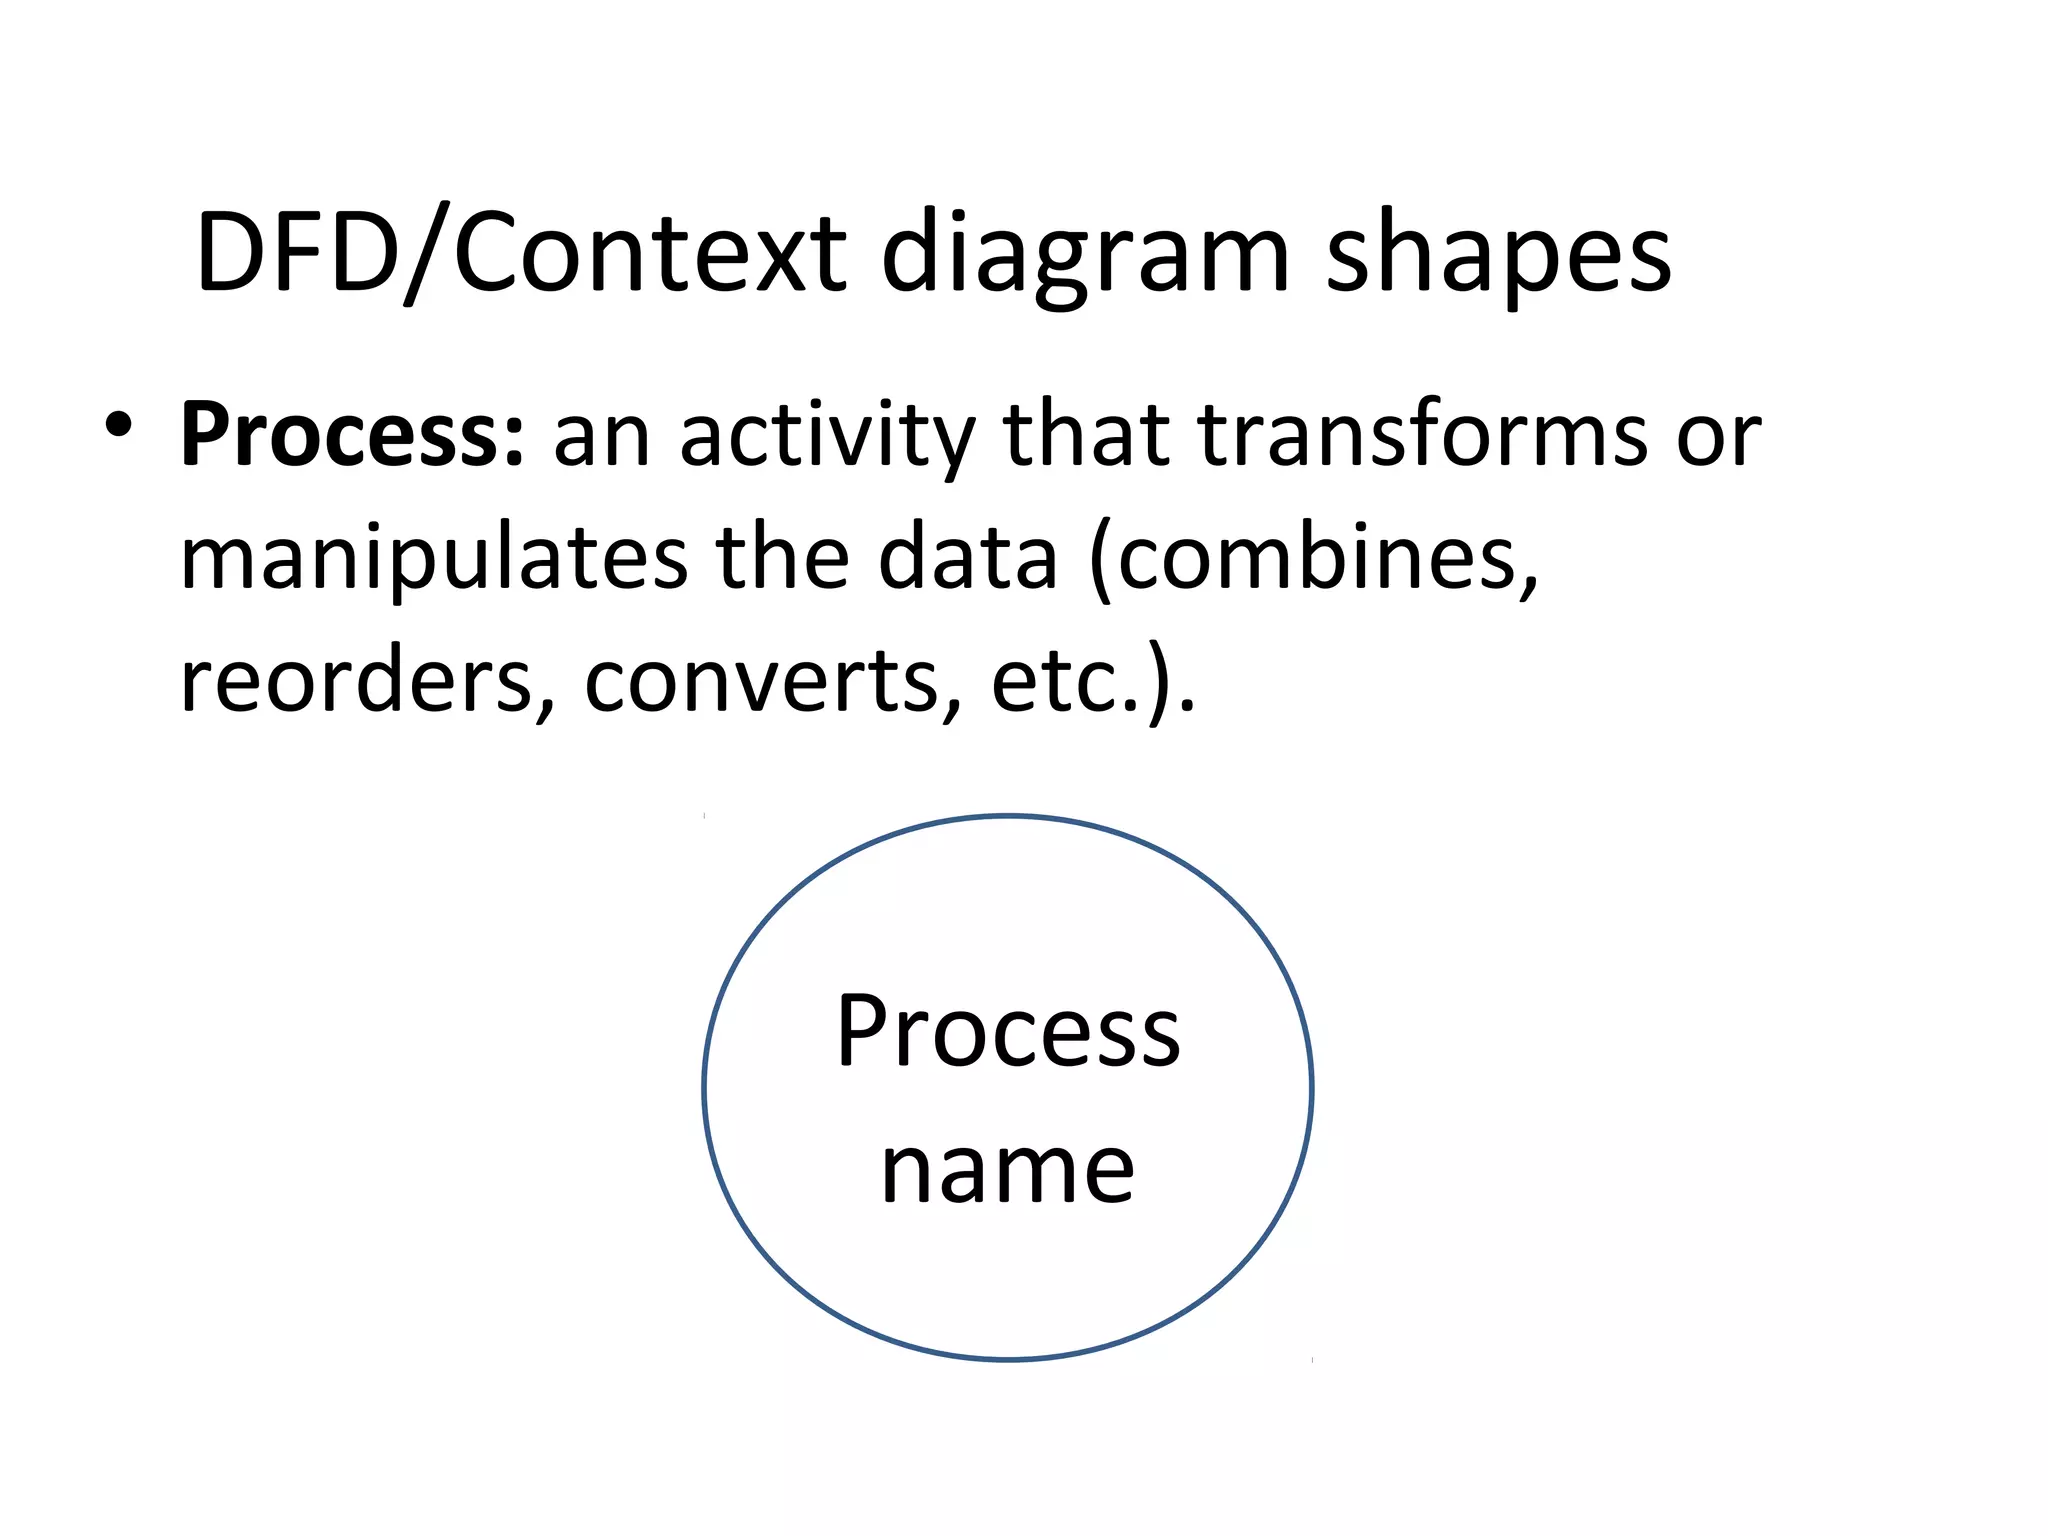
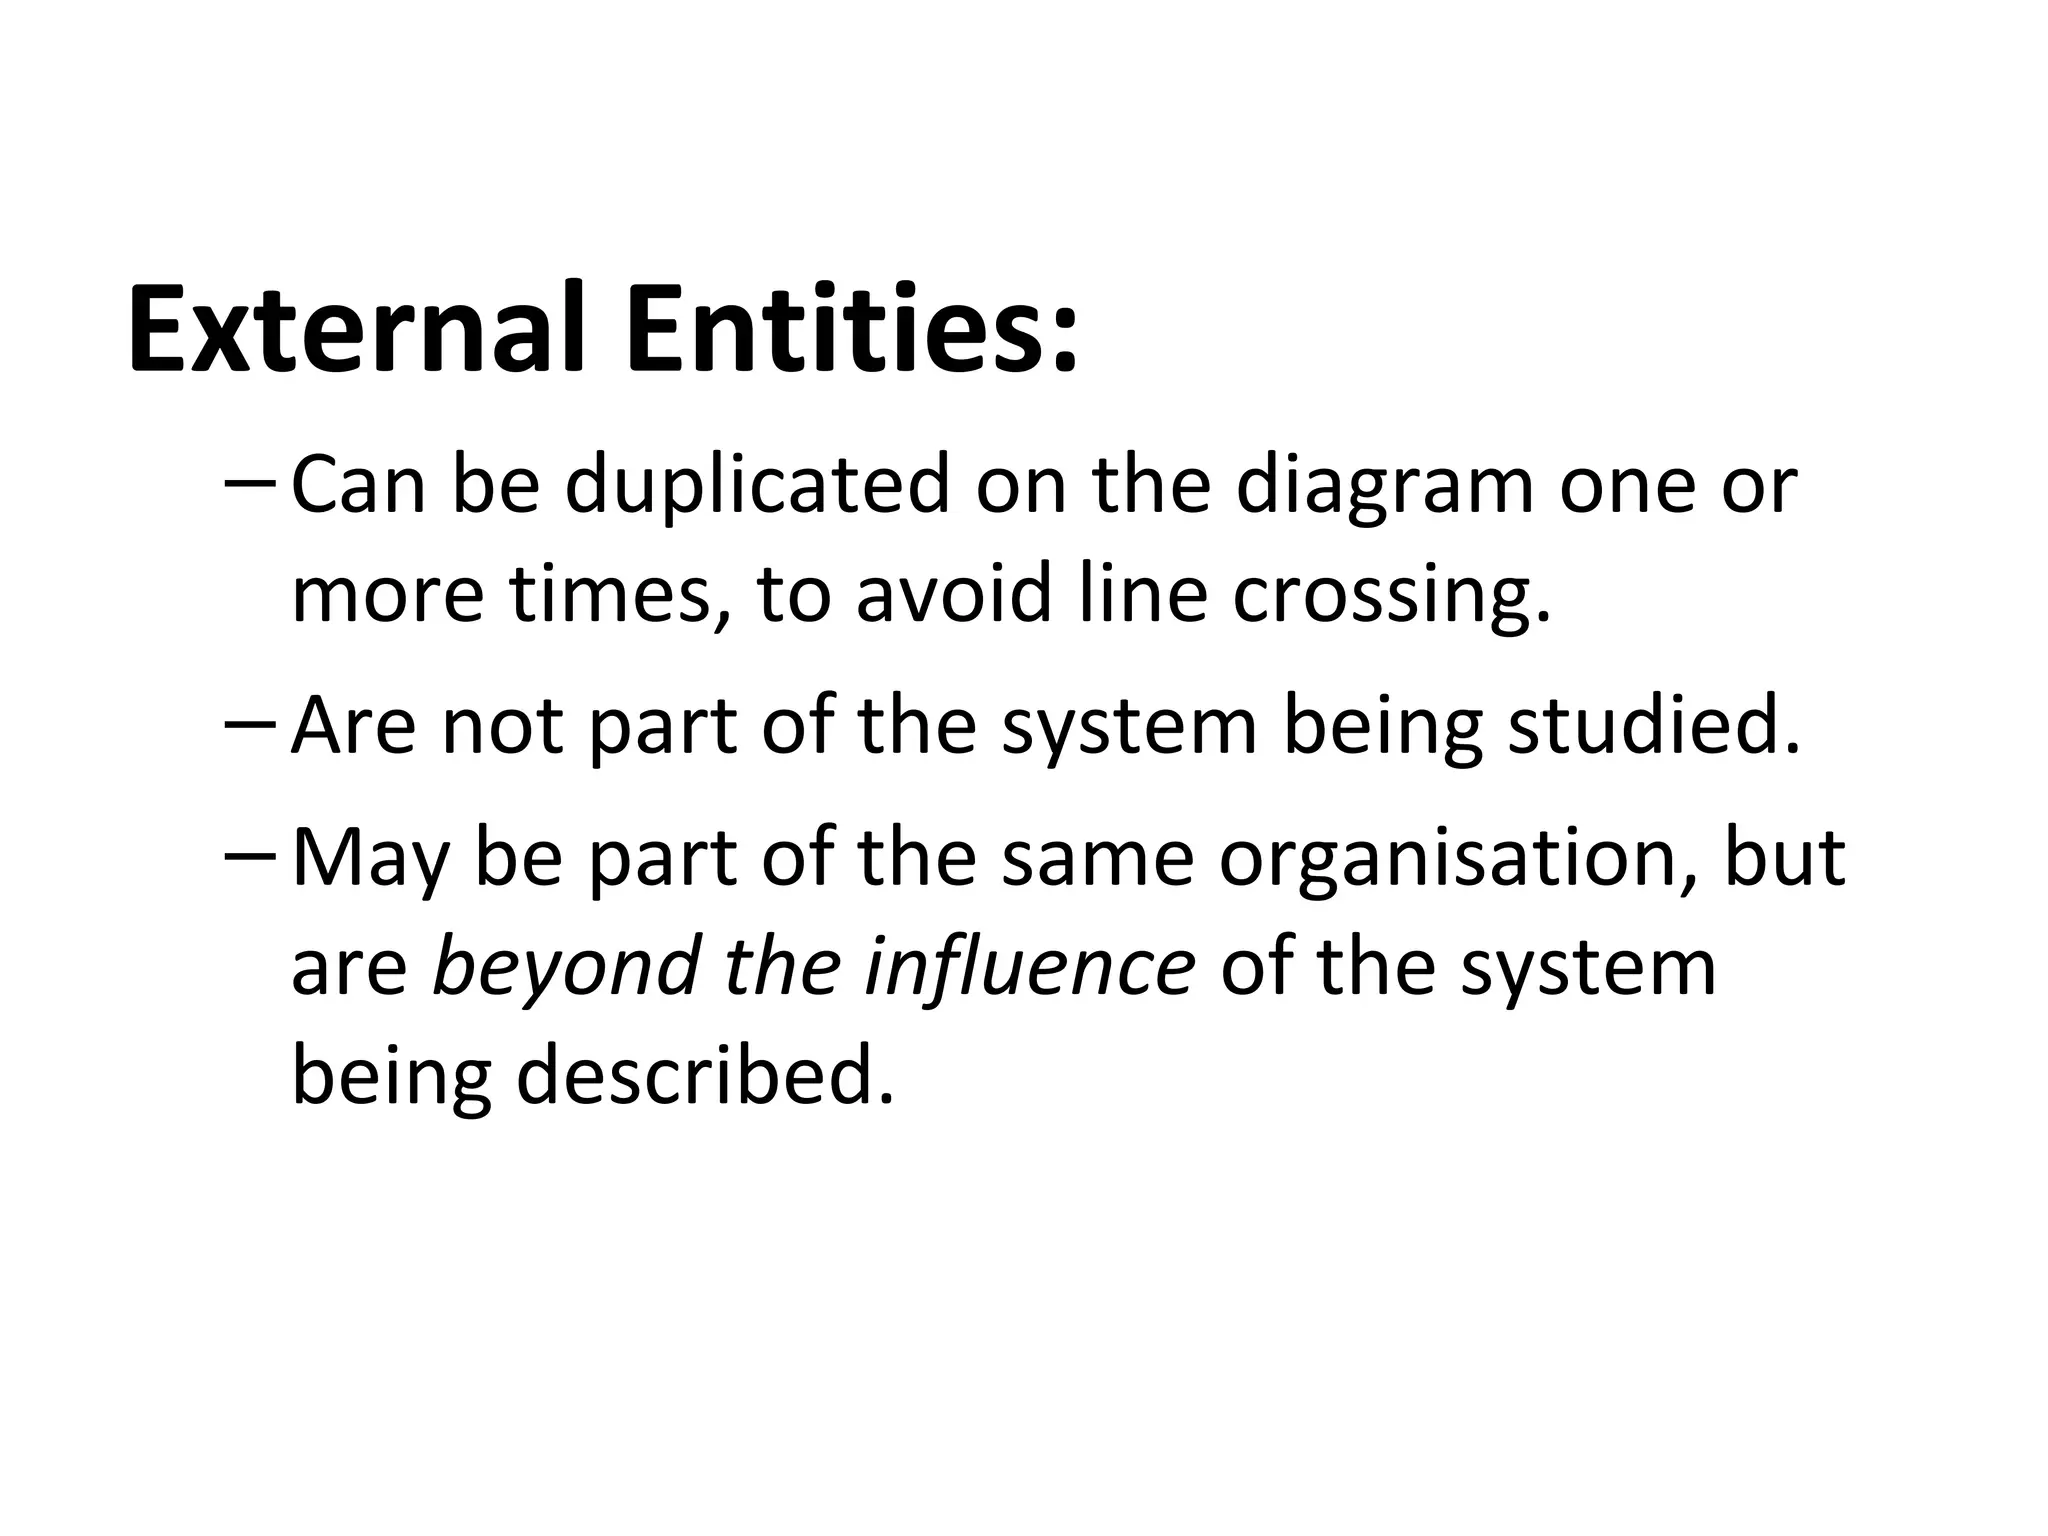
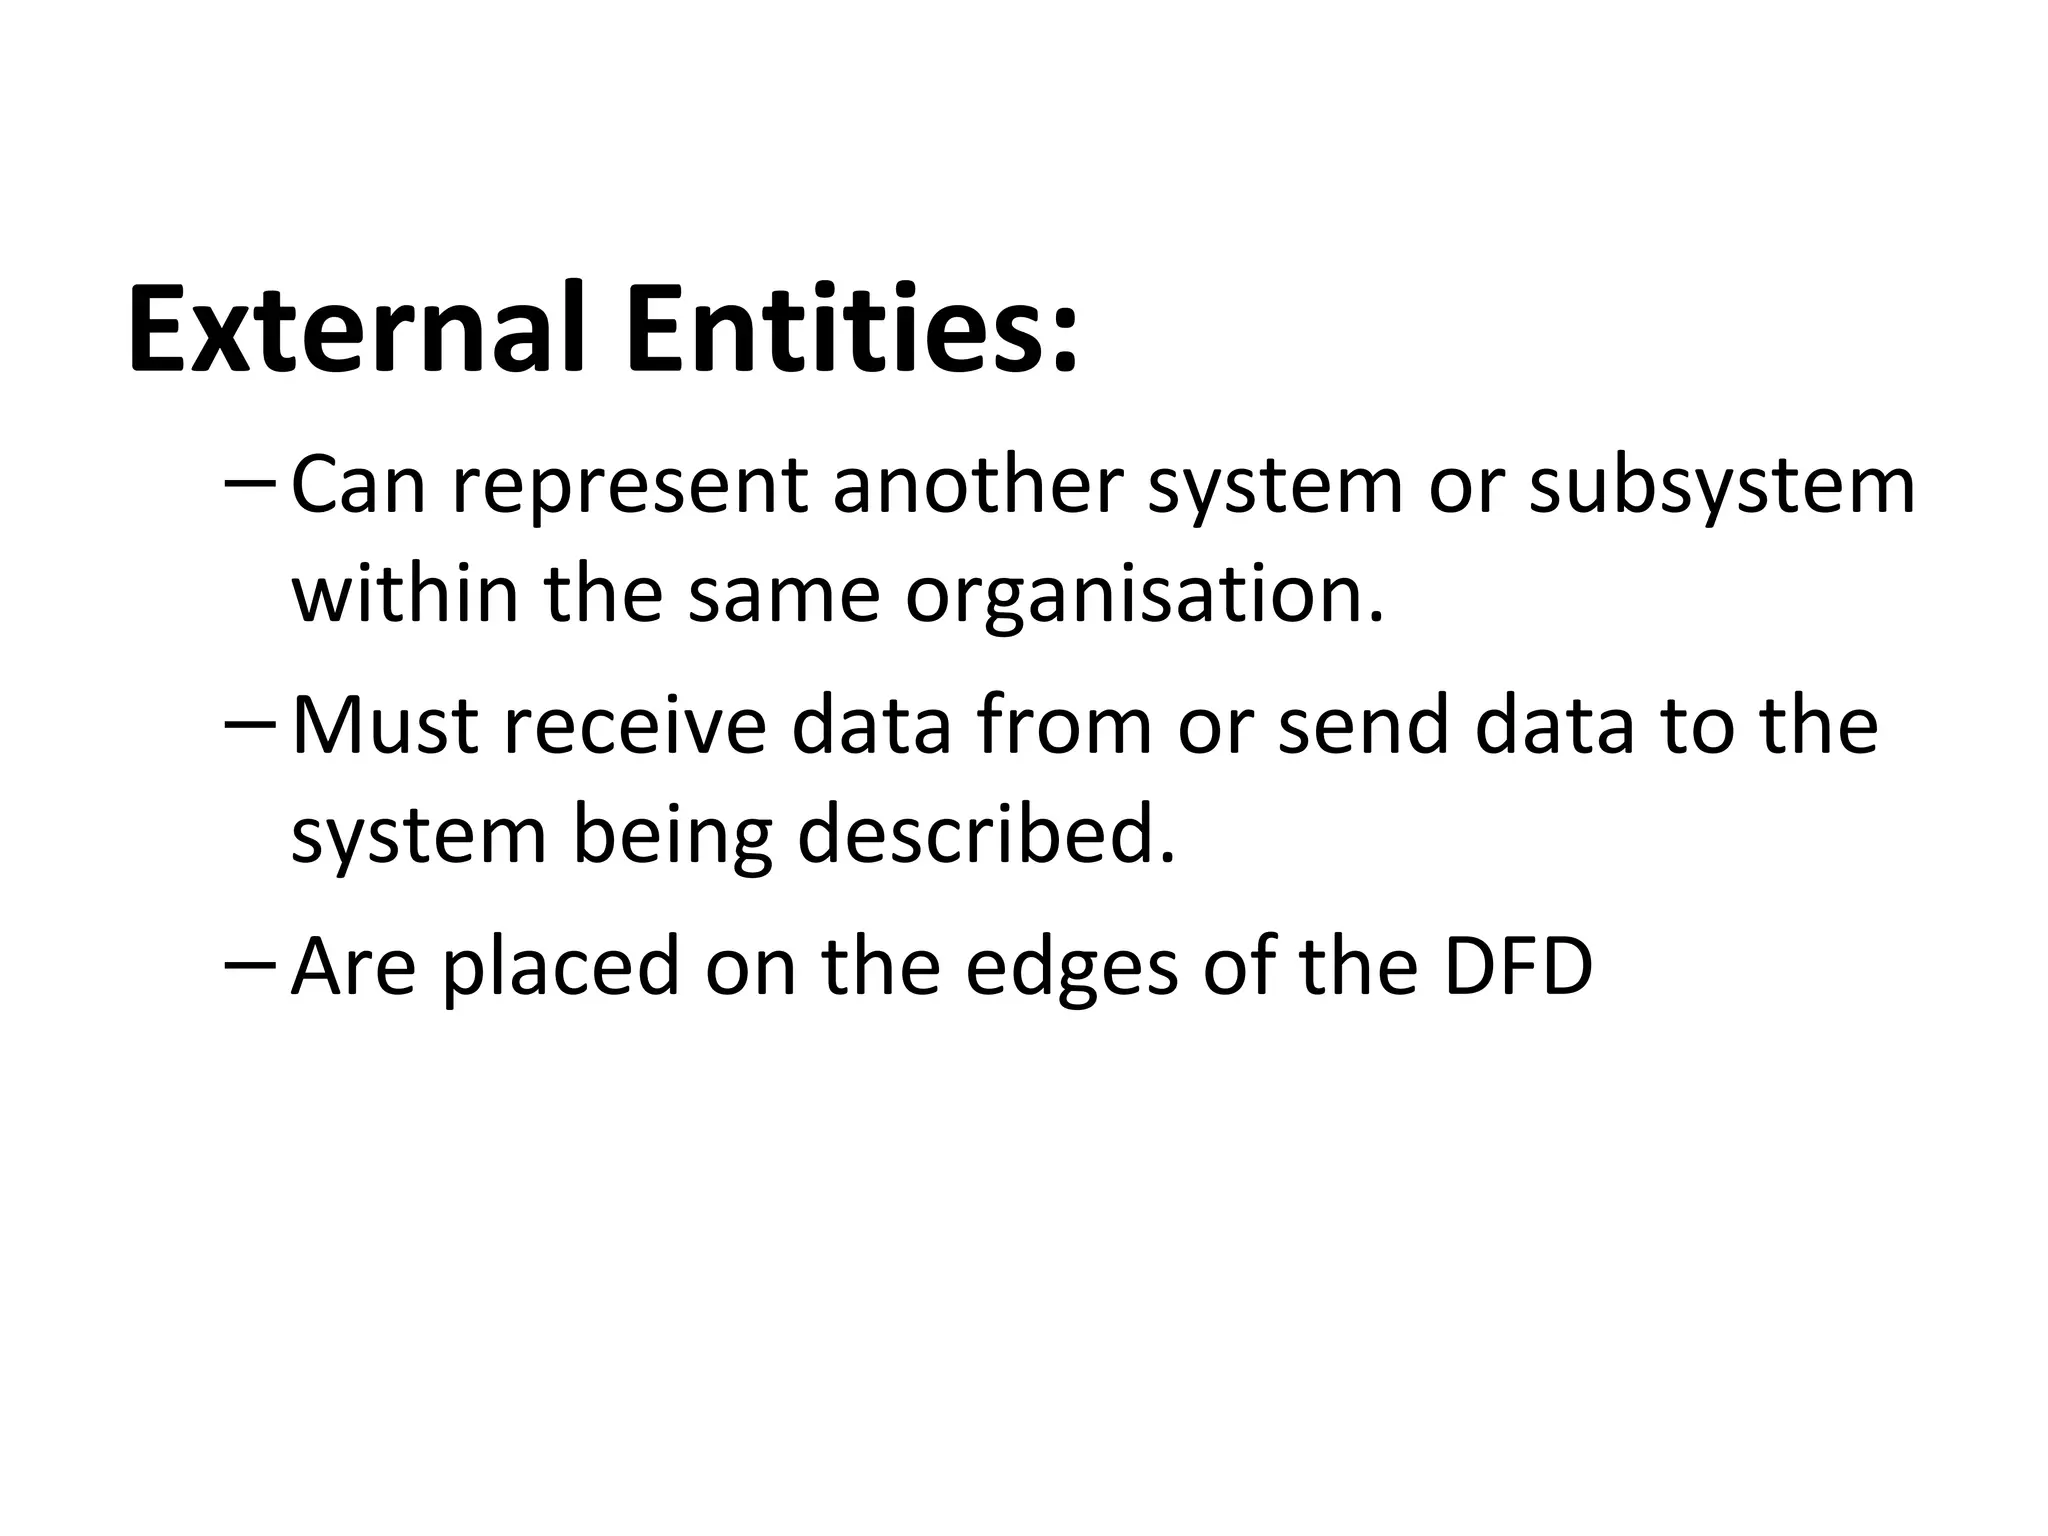
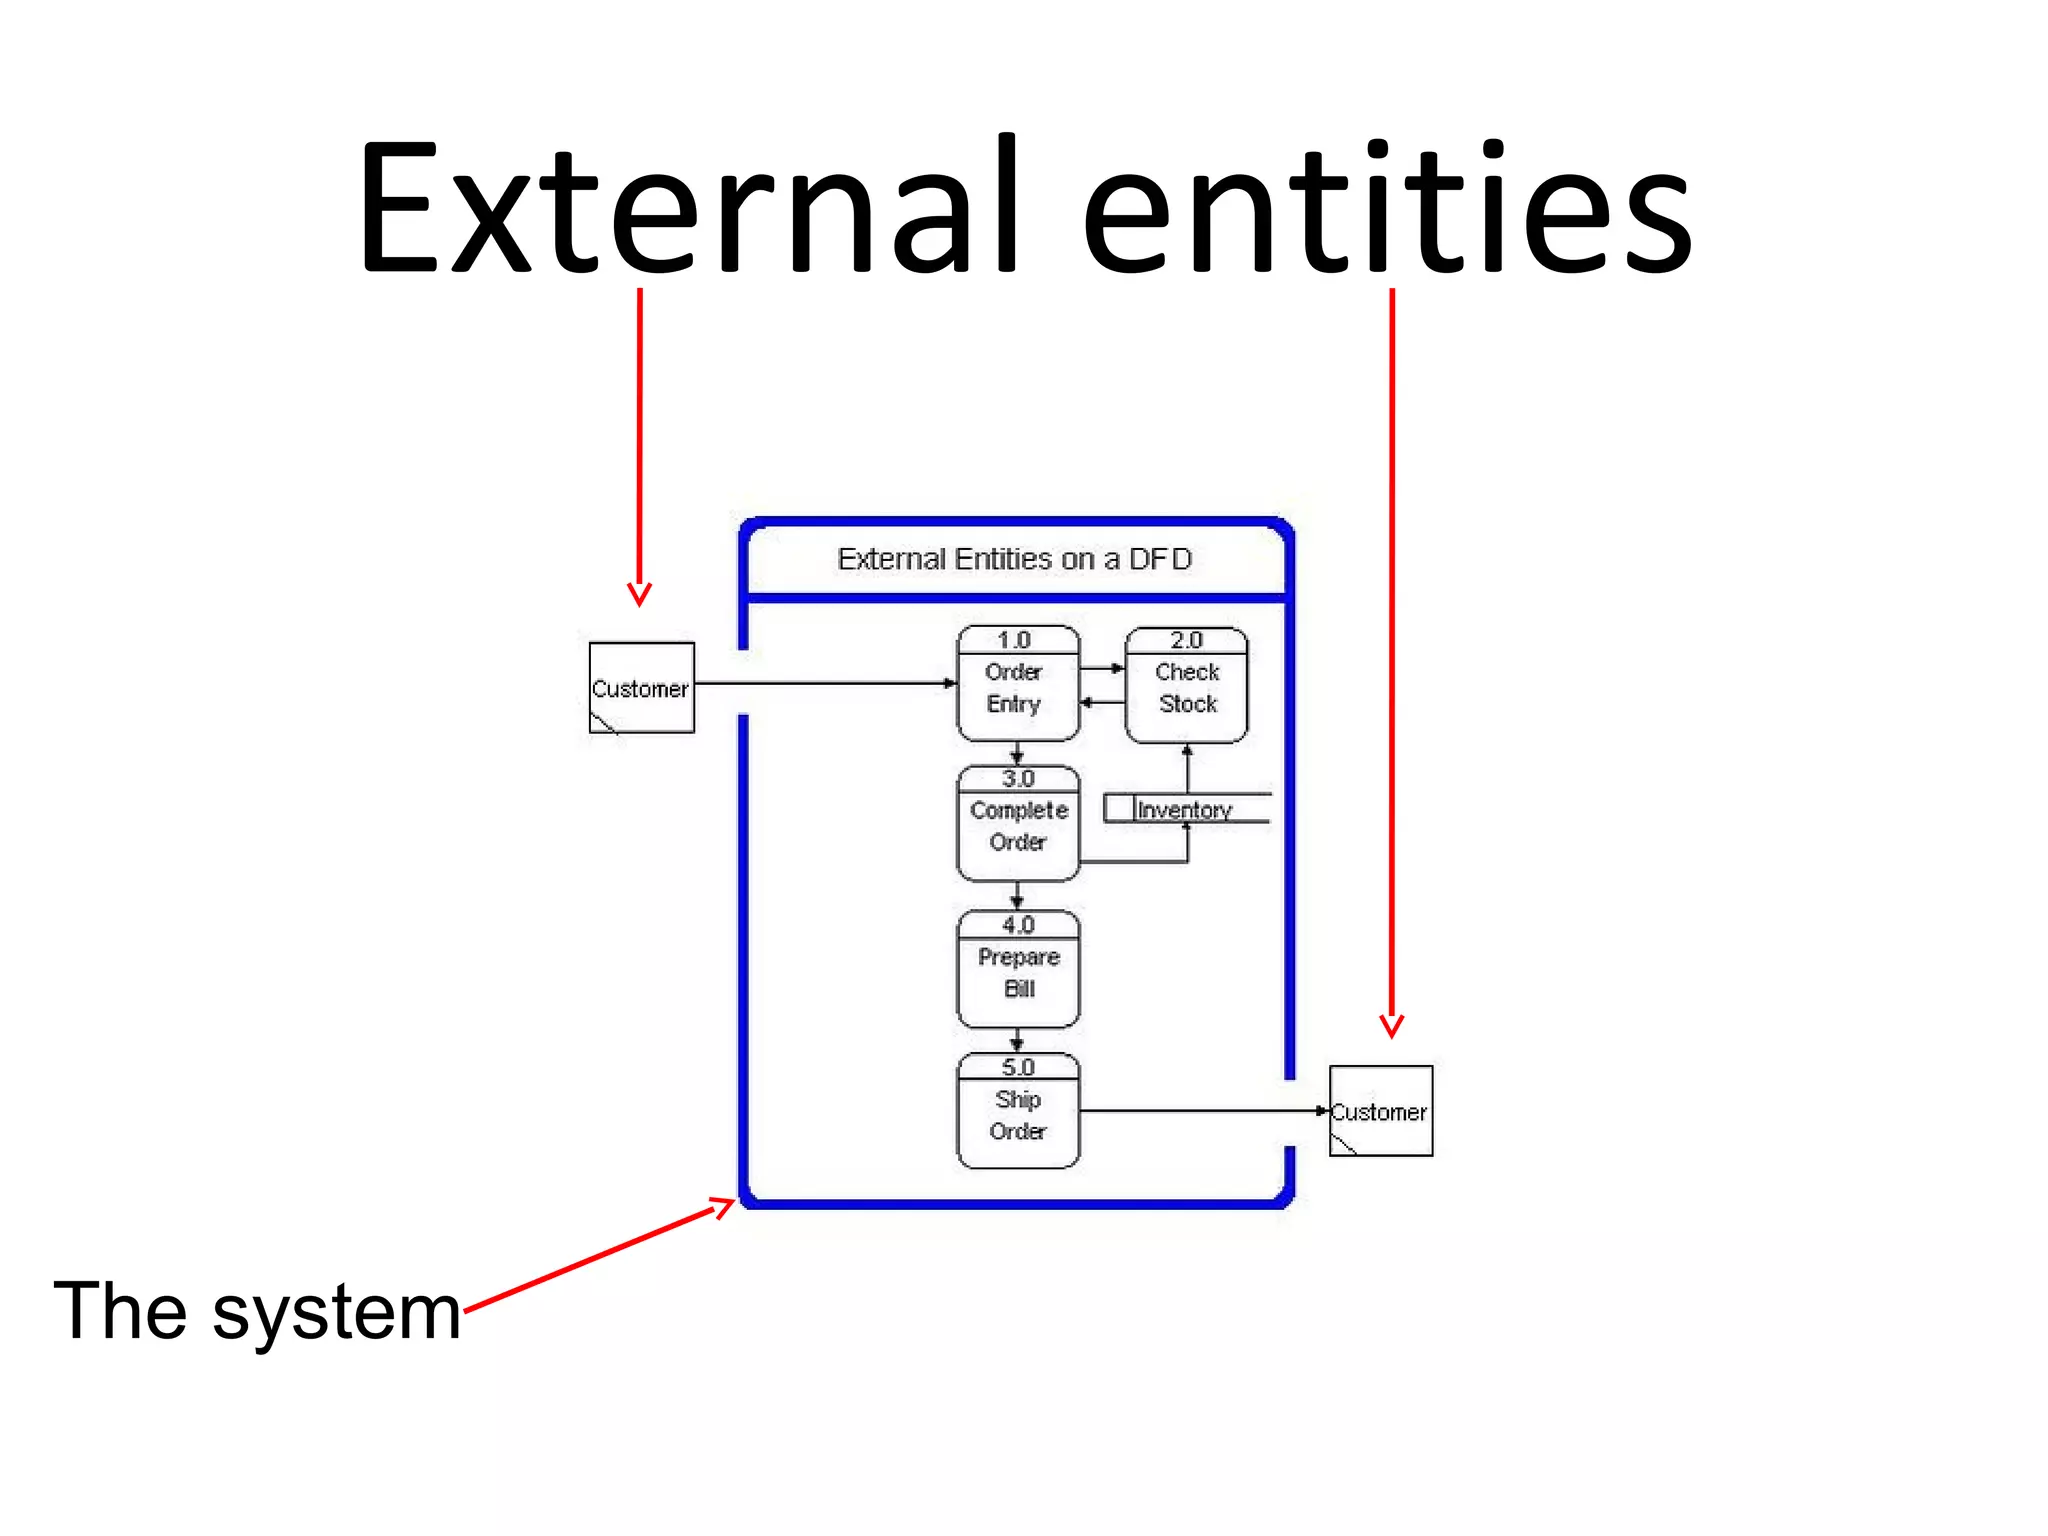
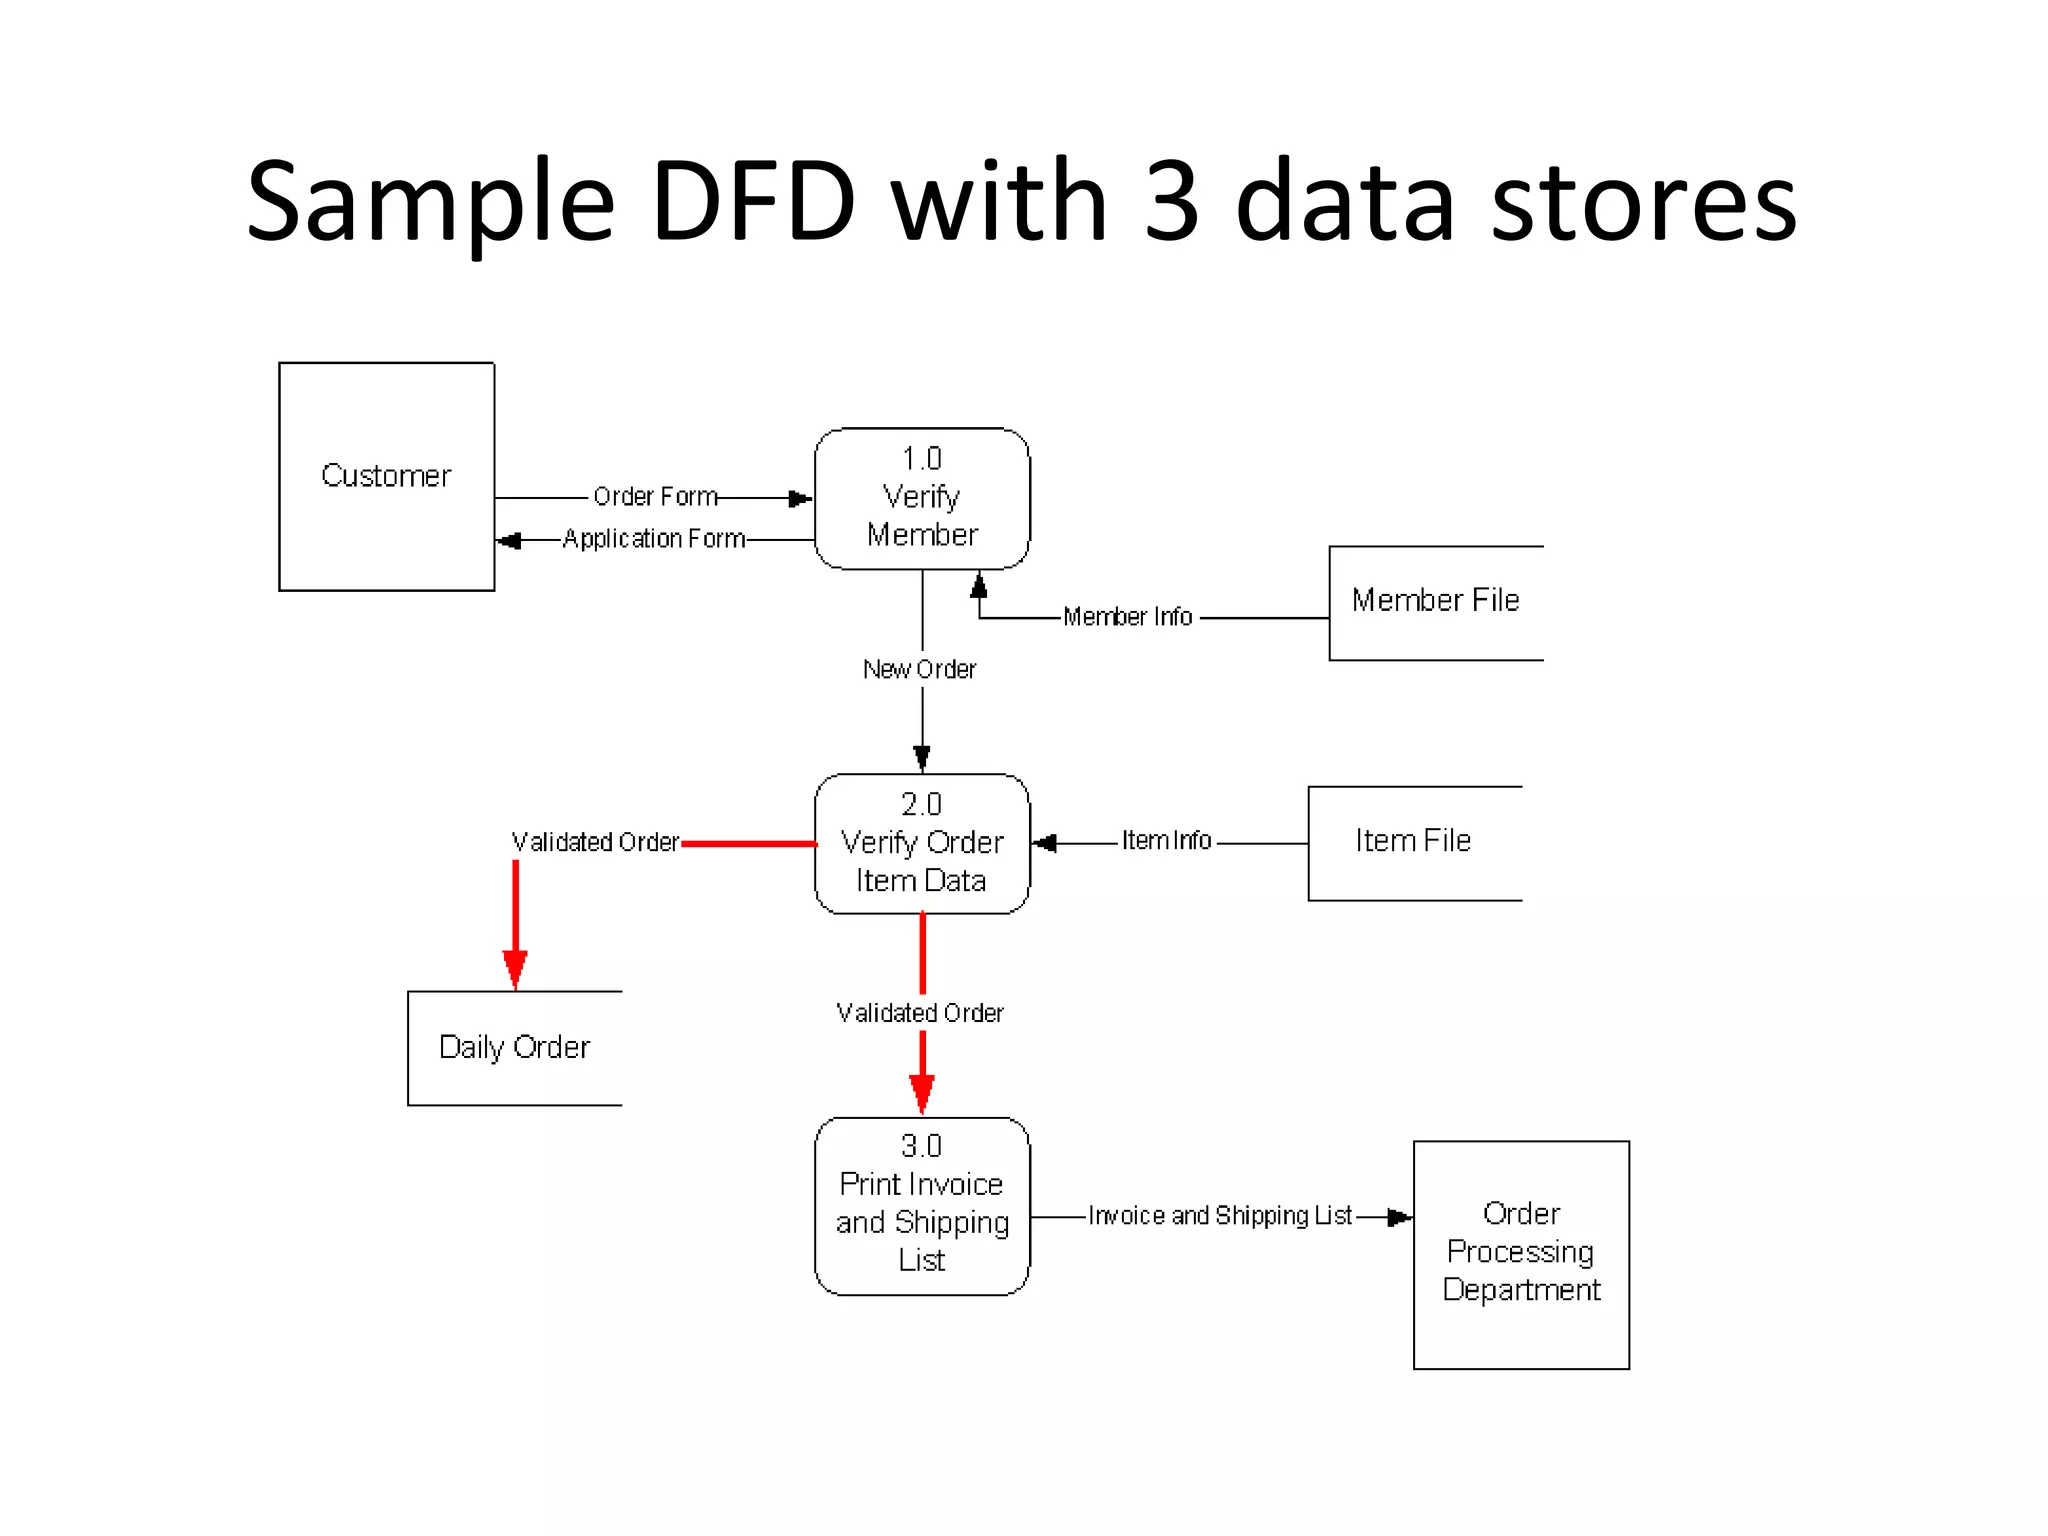
DFD shapes include external entities, data flows, data stores, and processes, defining data movement.
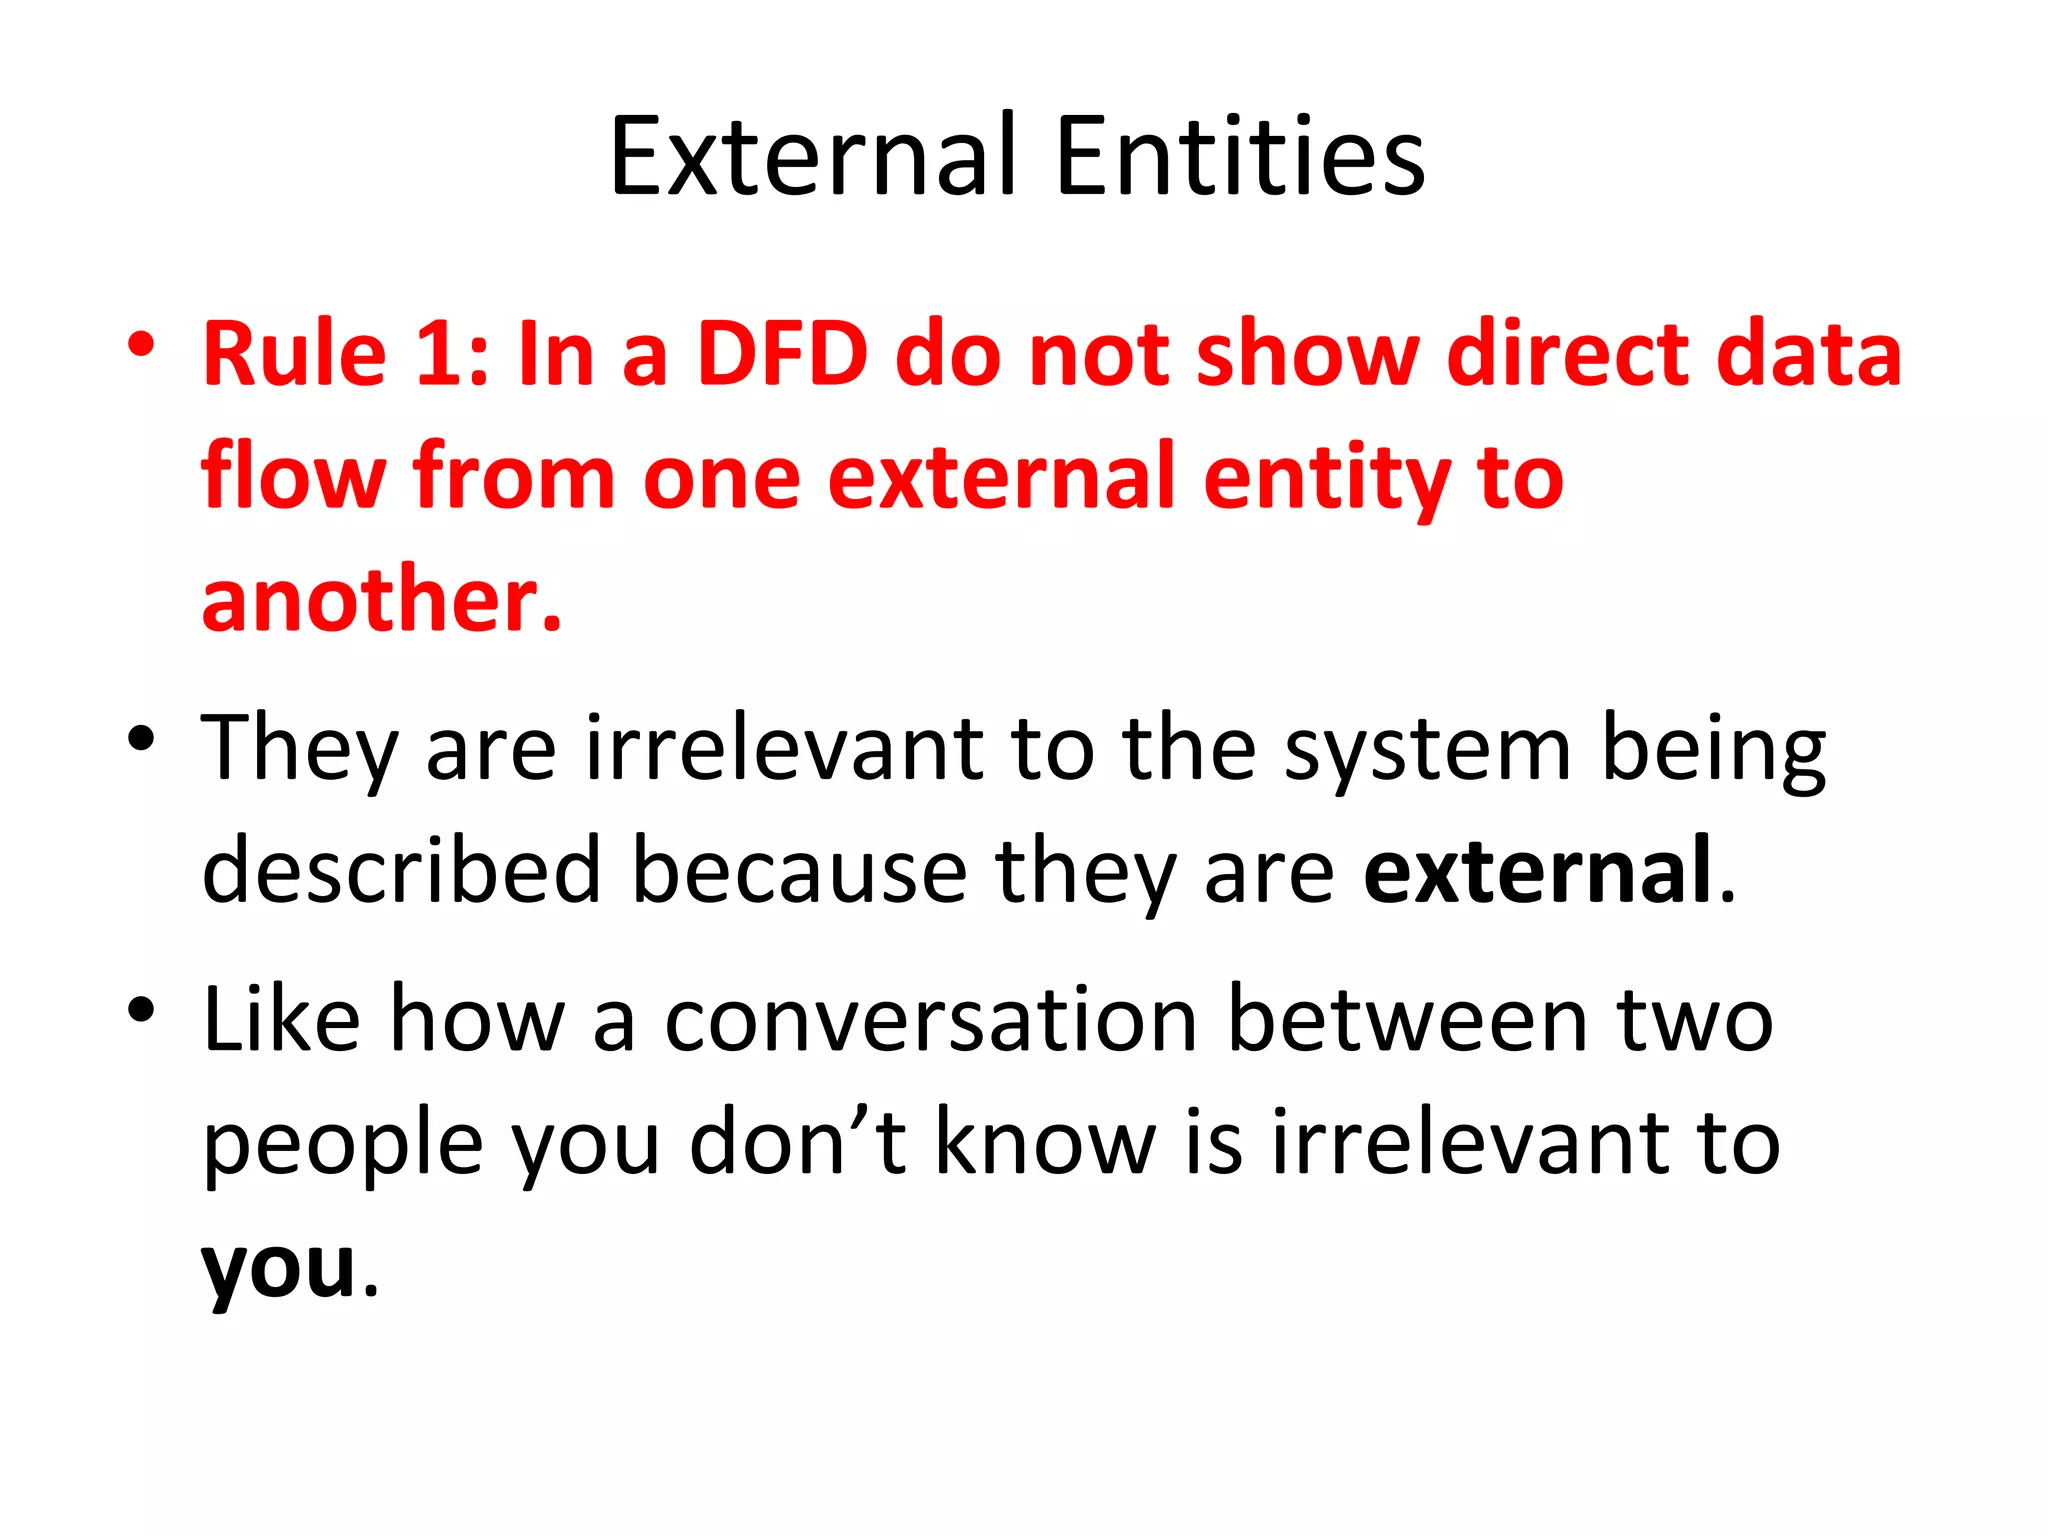
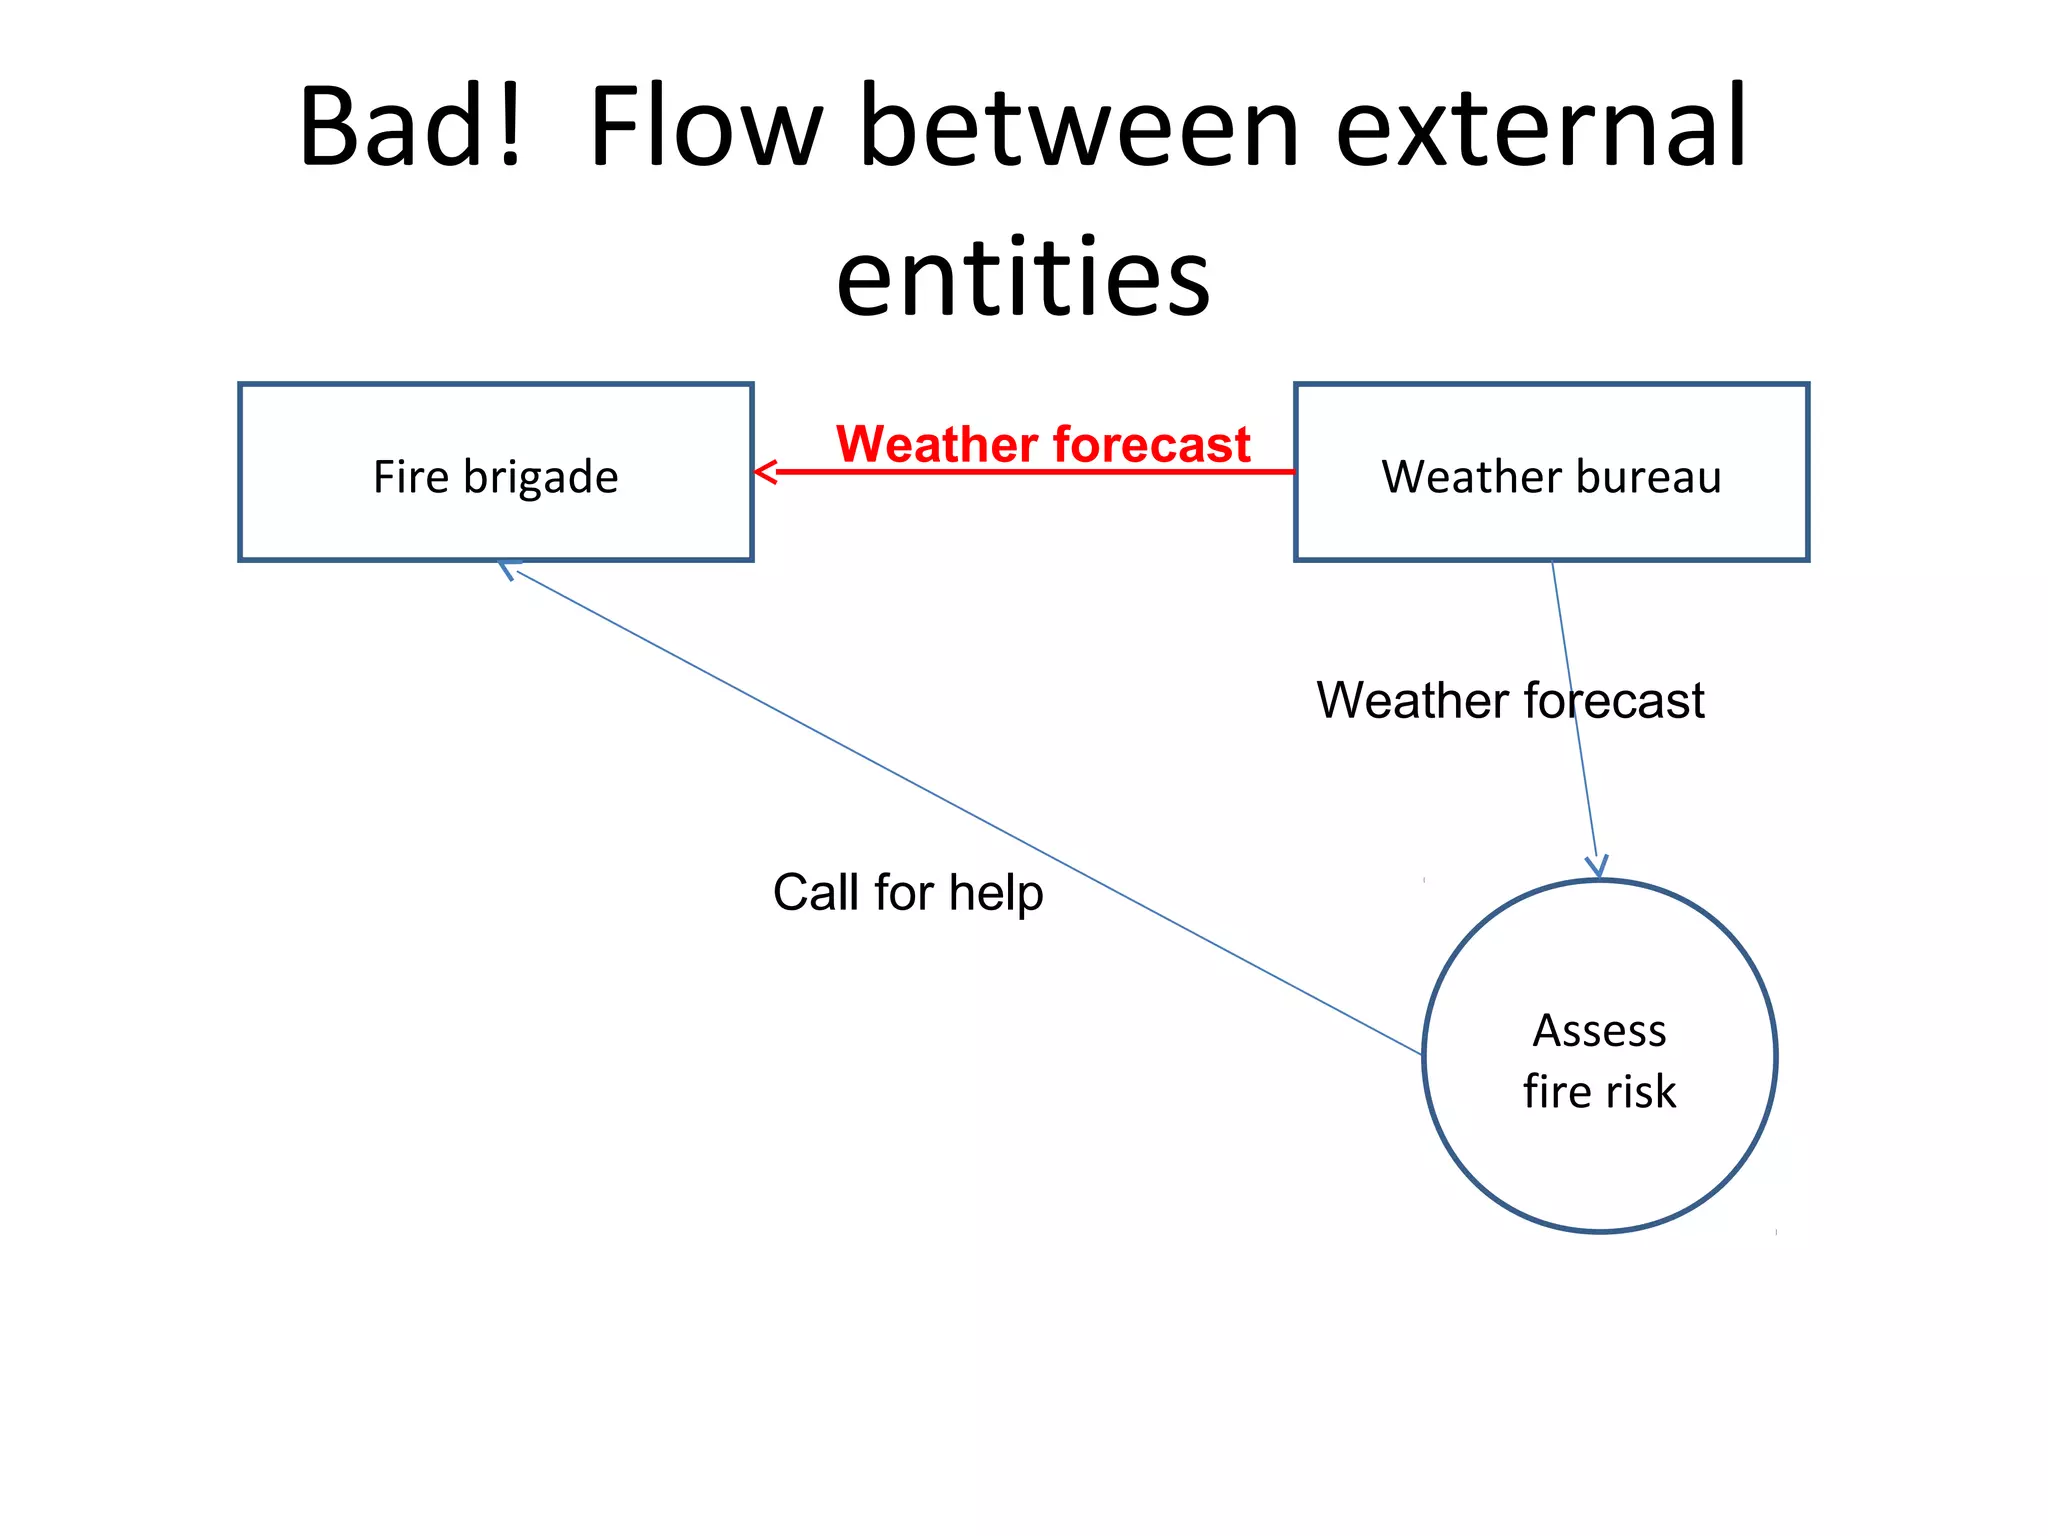
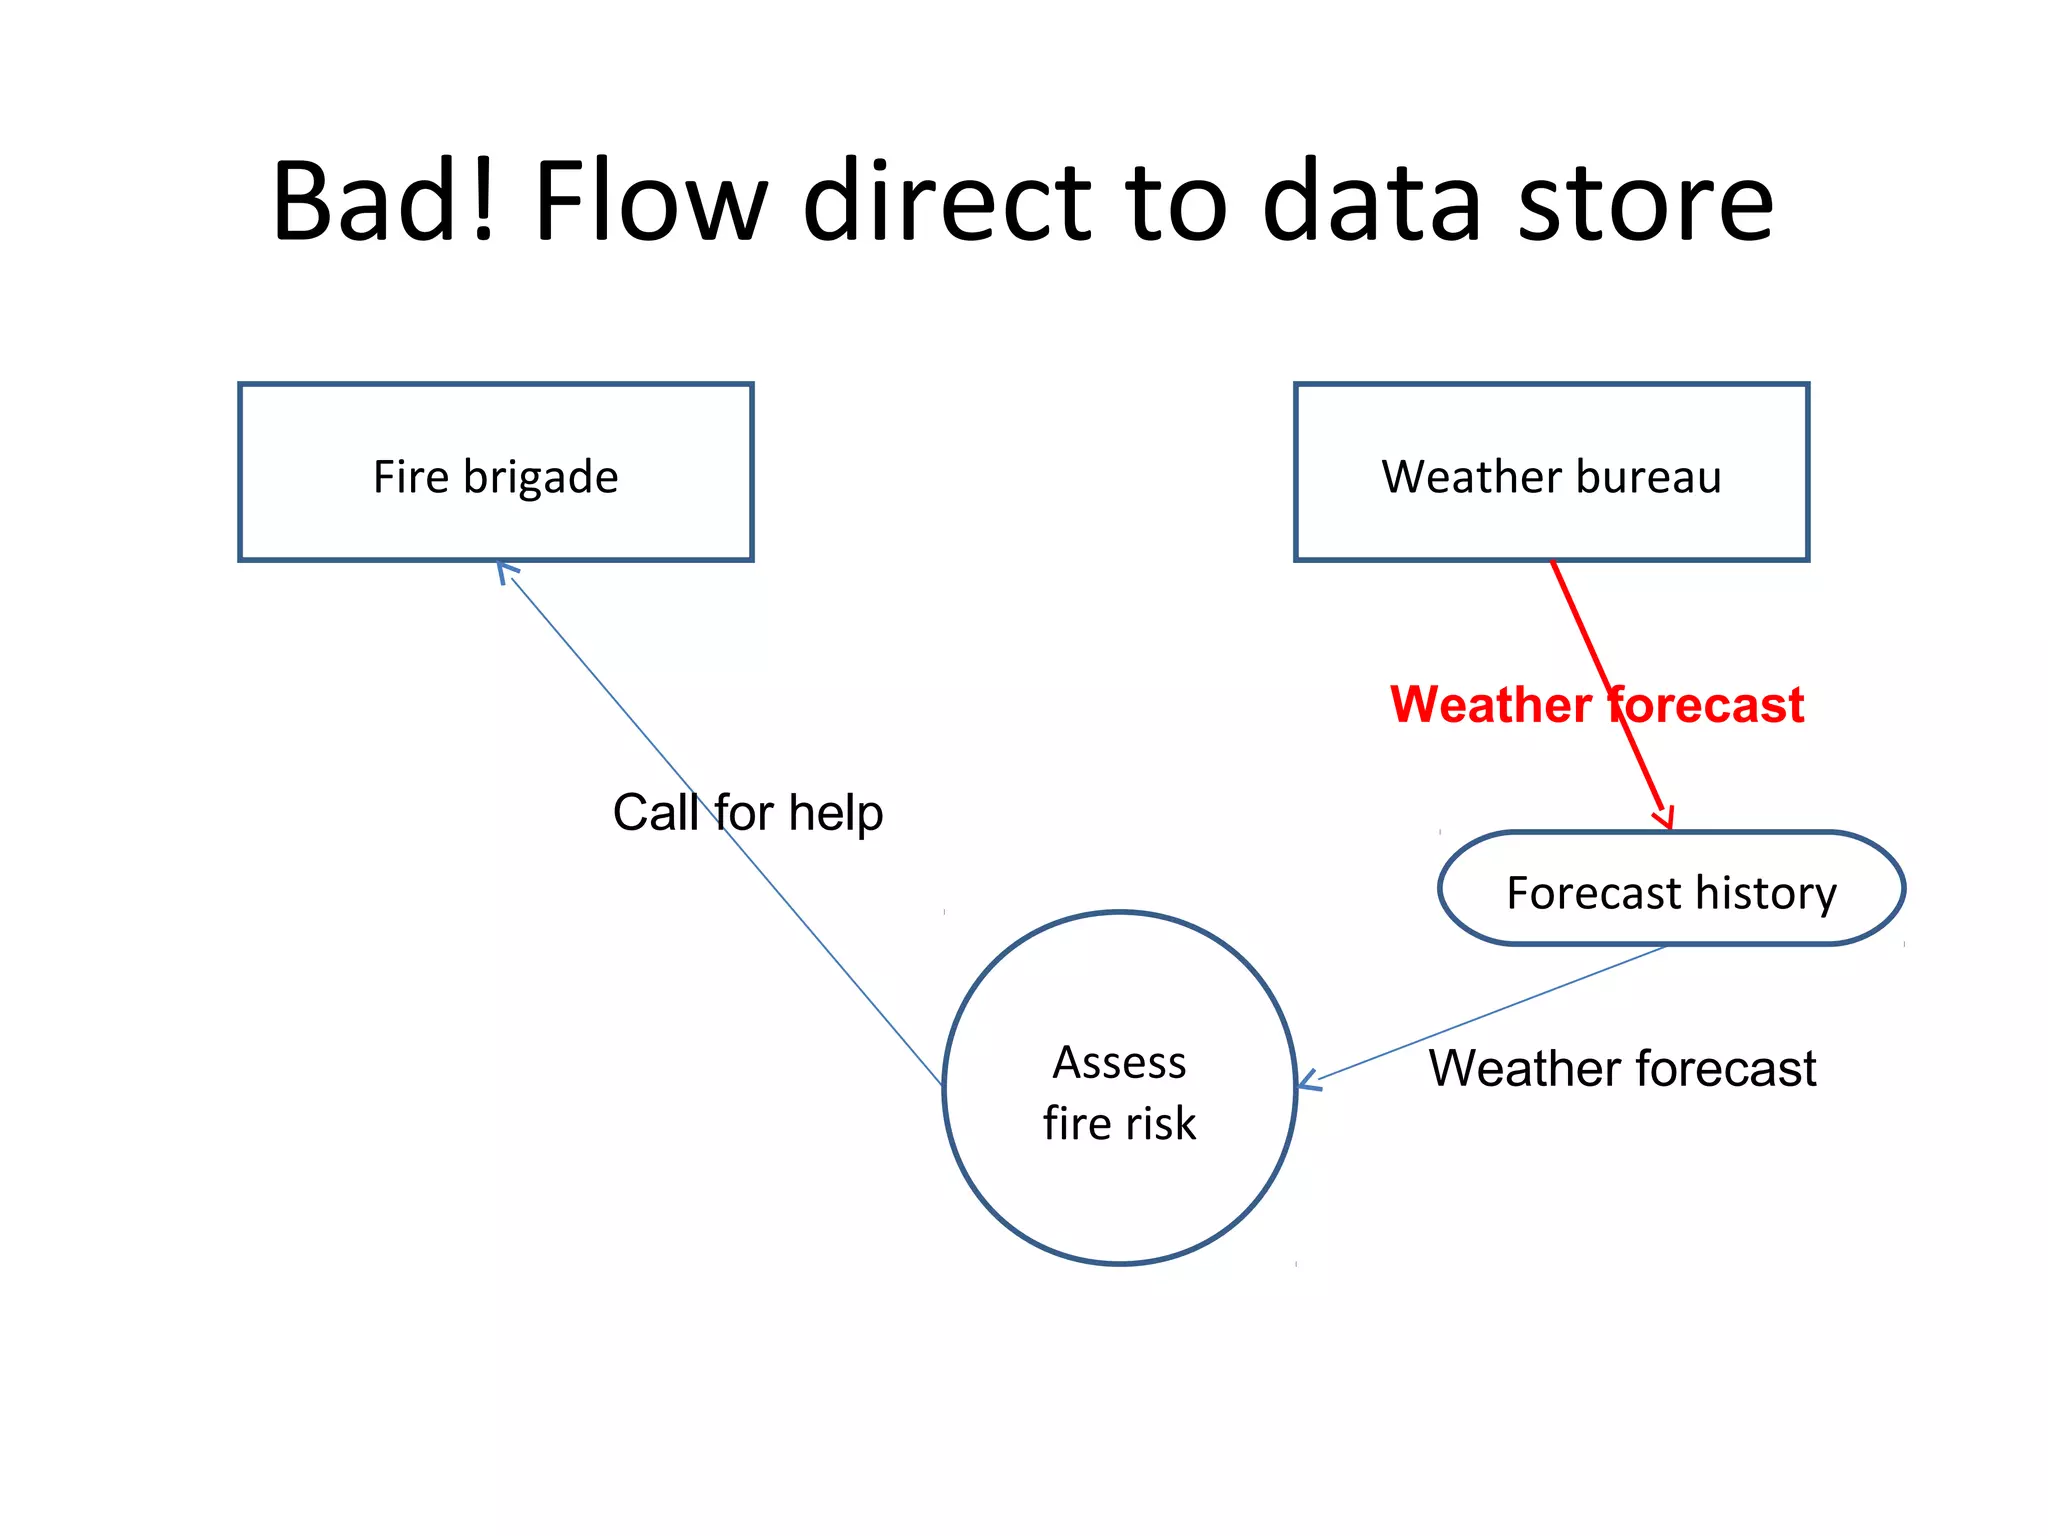
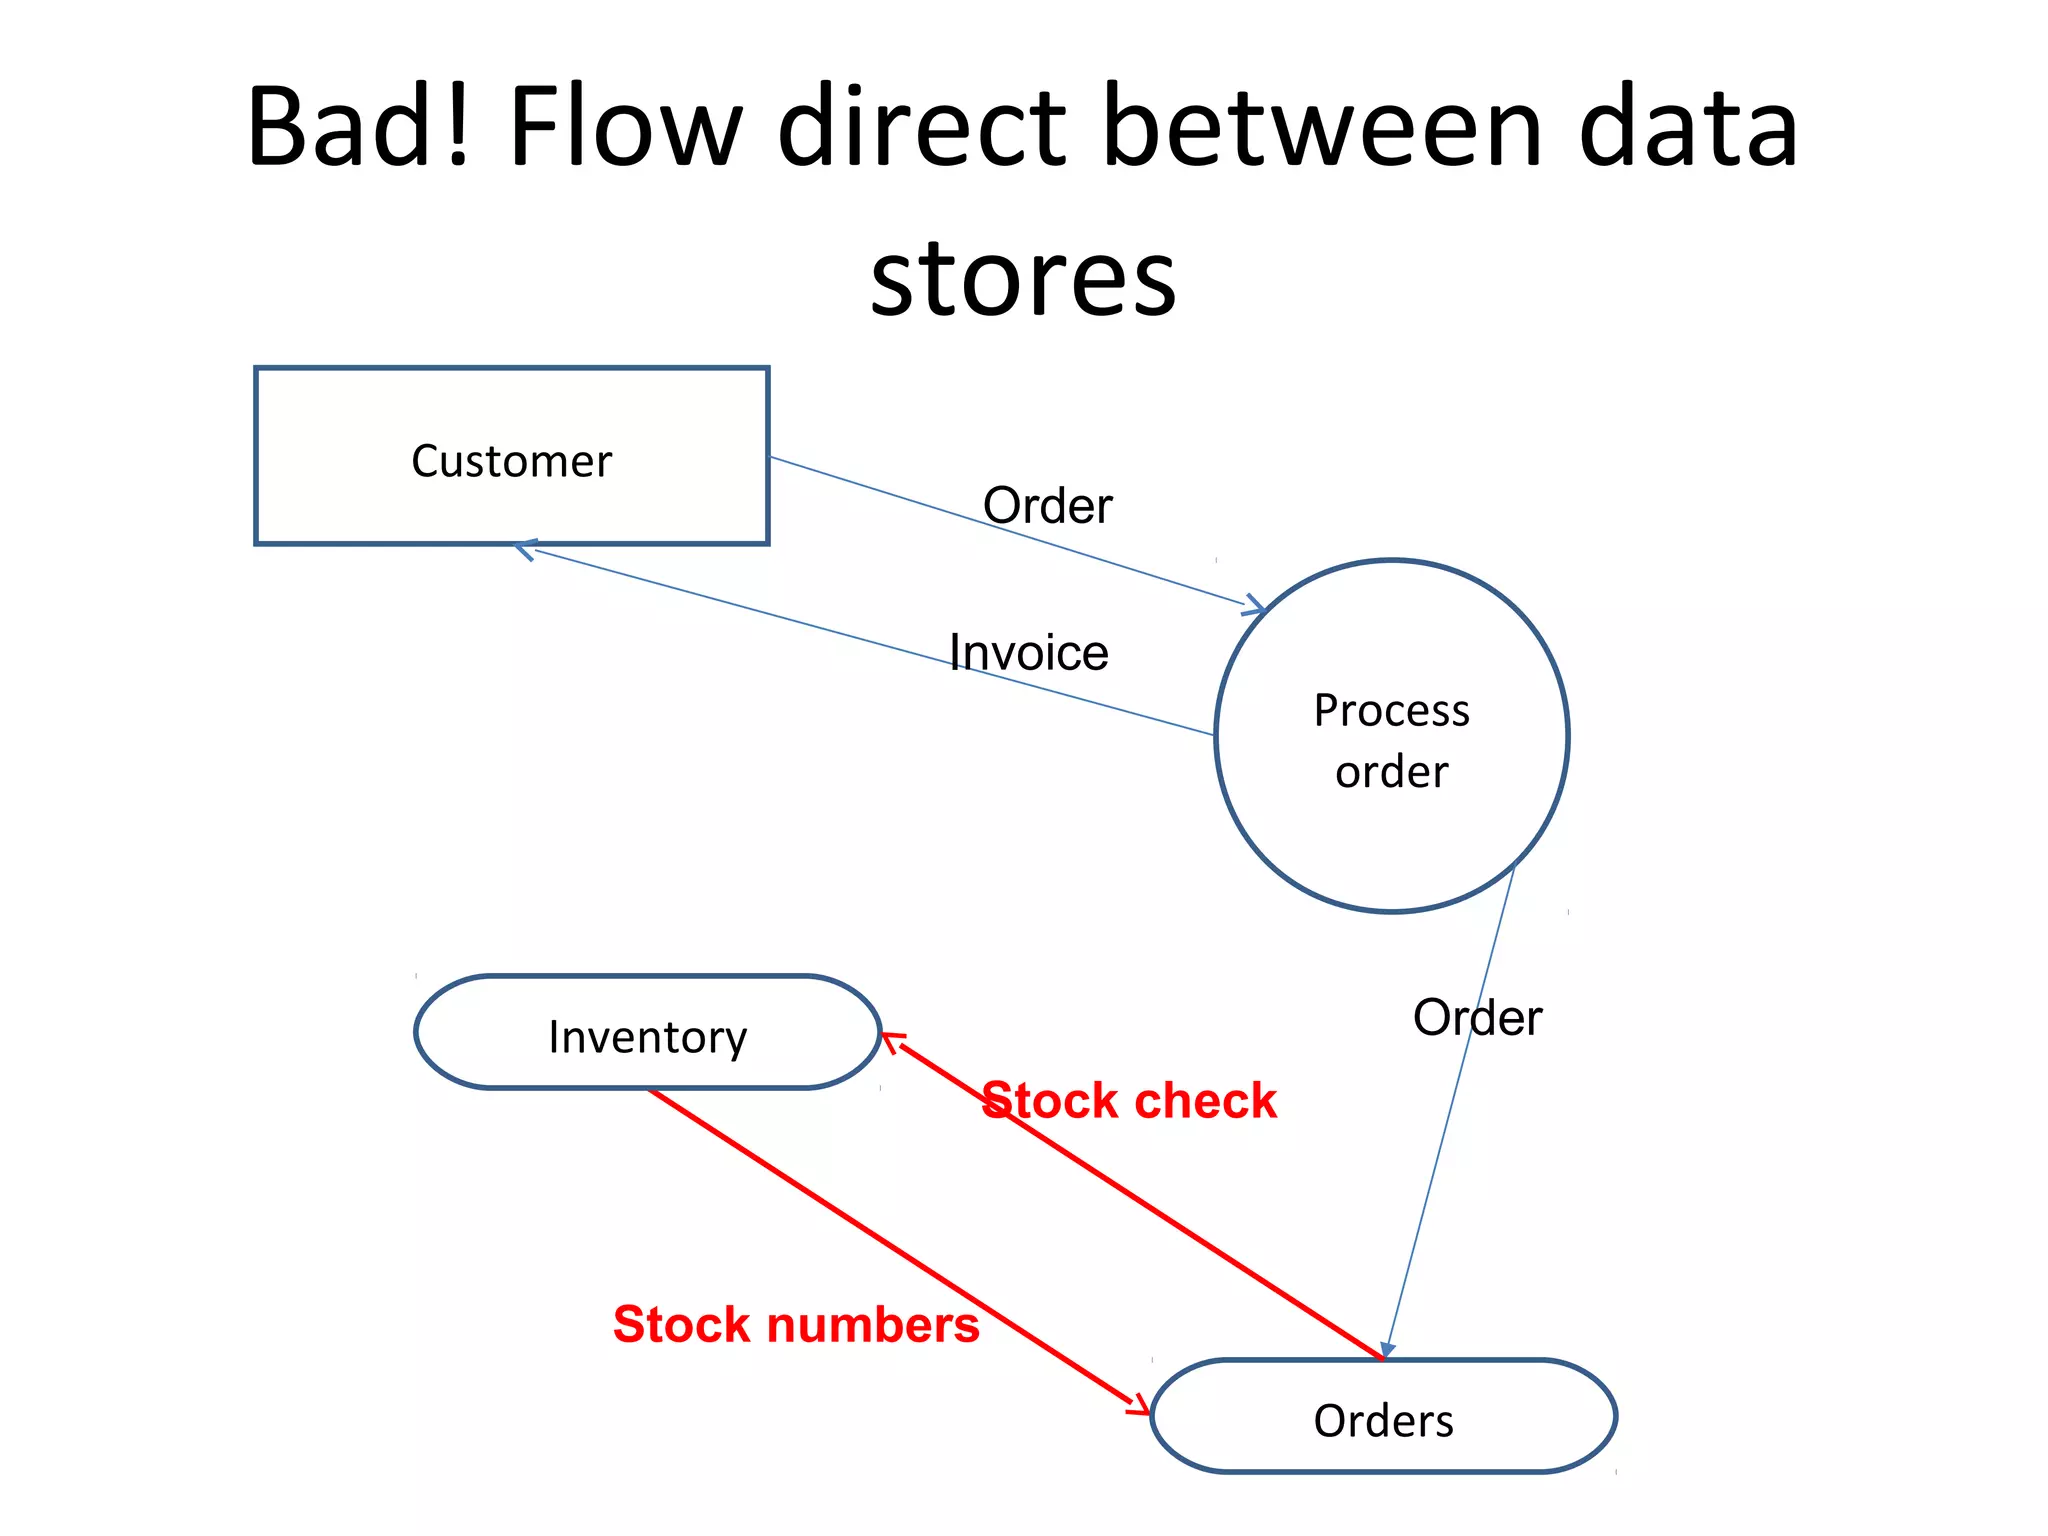
External entities can send/receive data but don't connect directly to each other or to data stores.
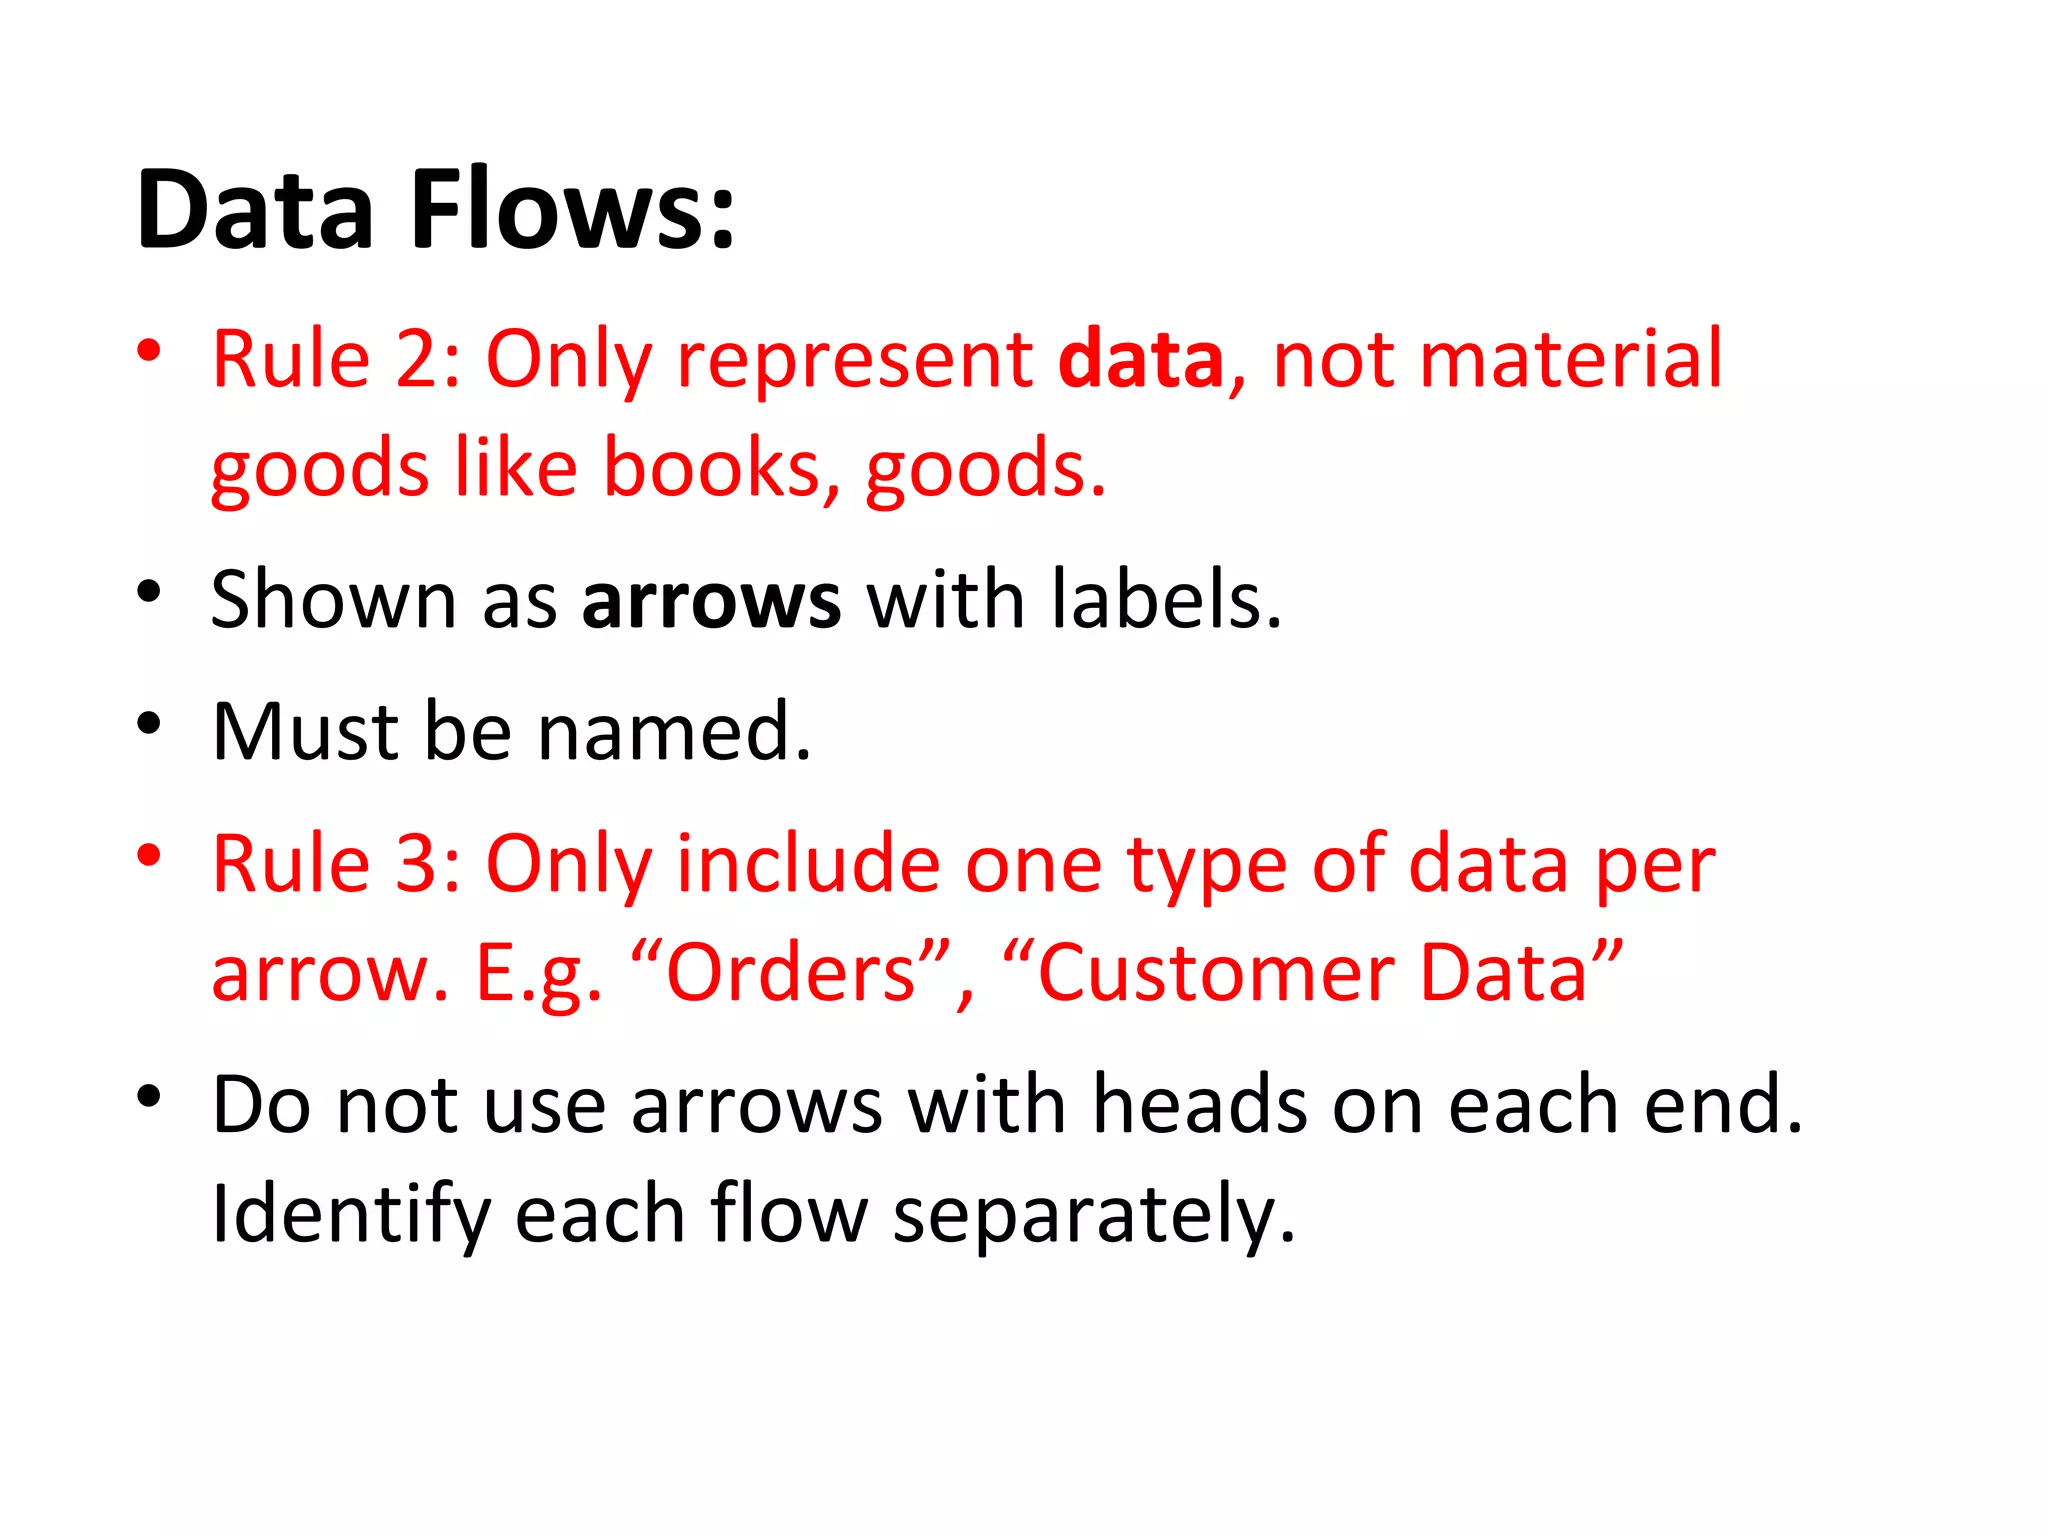
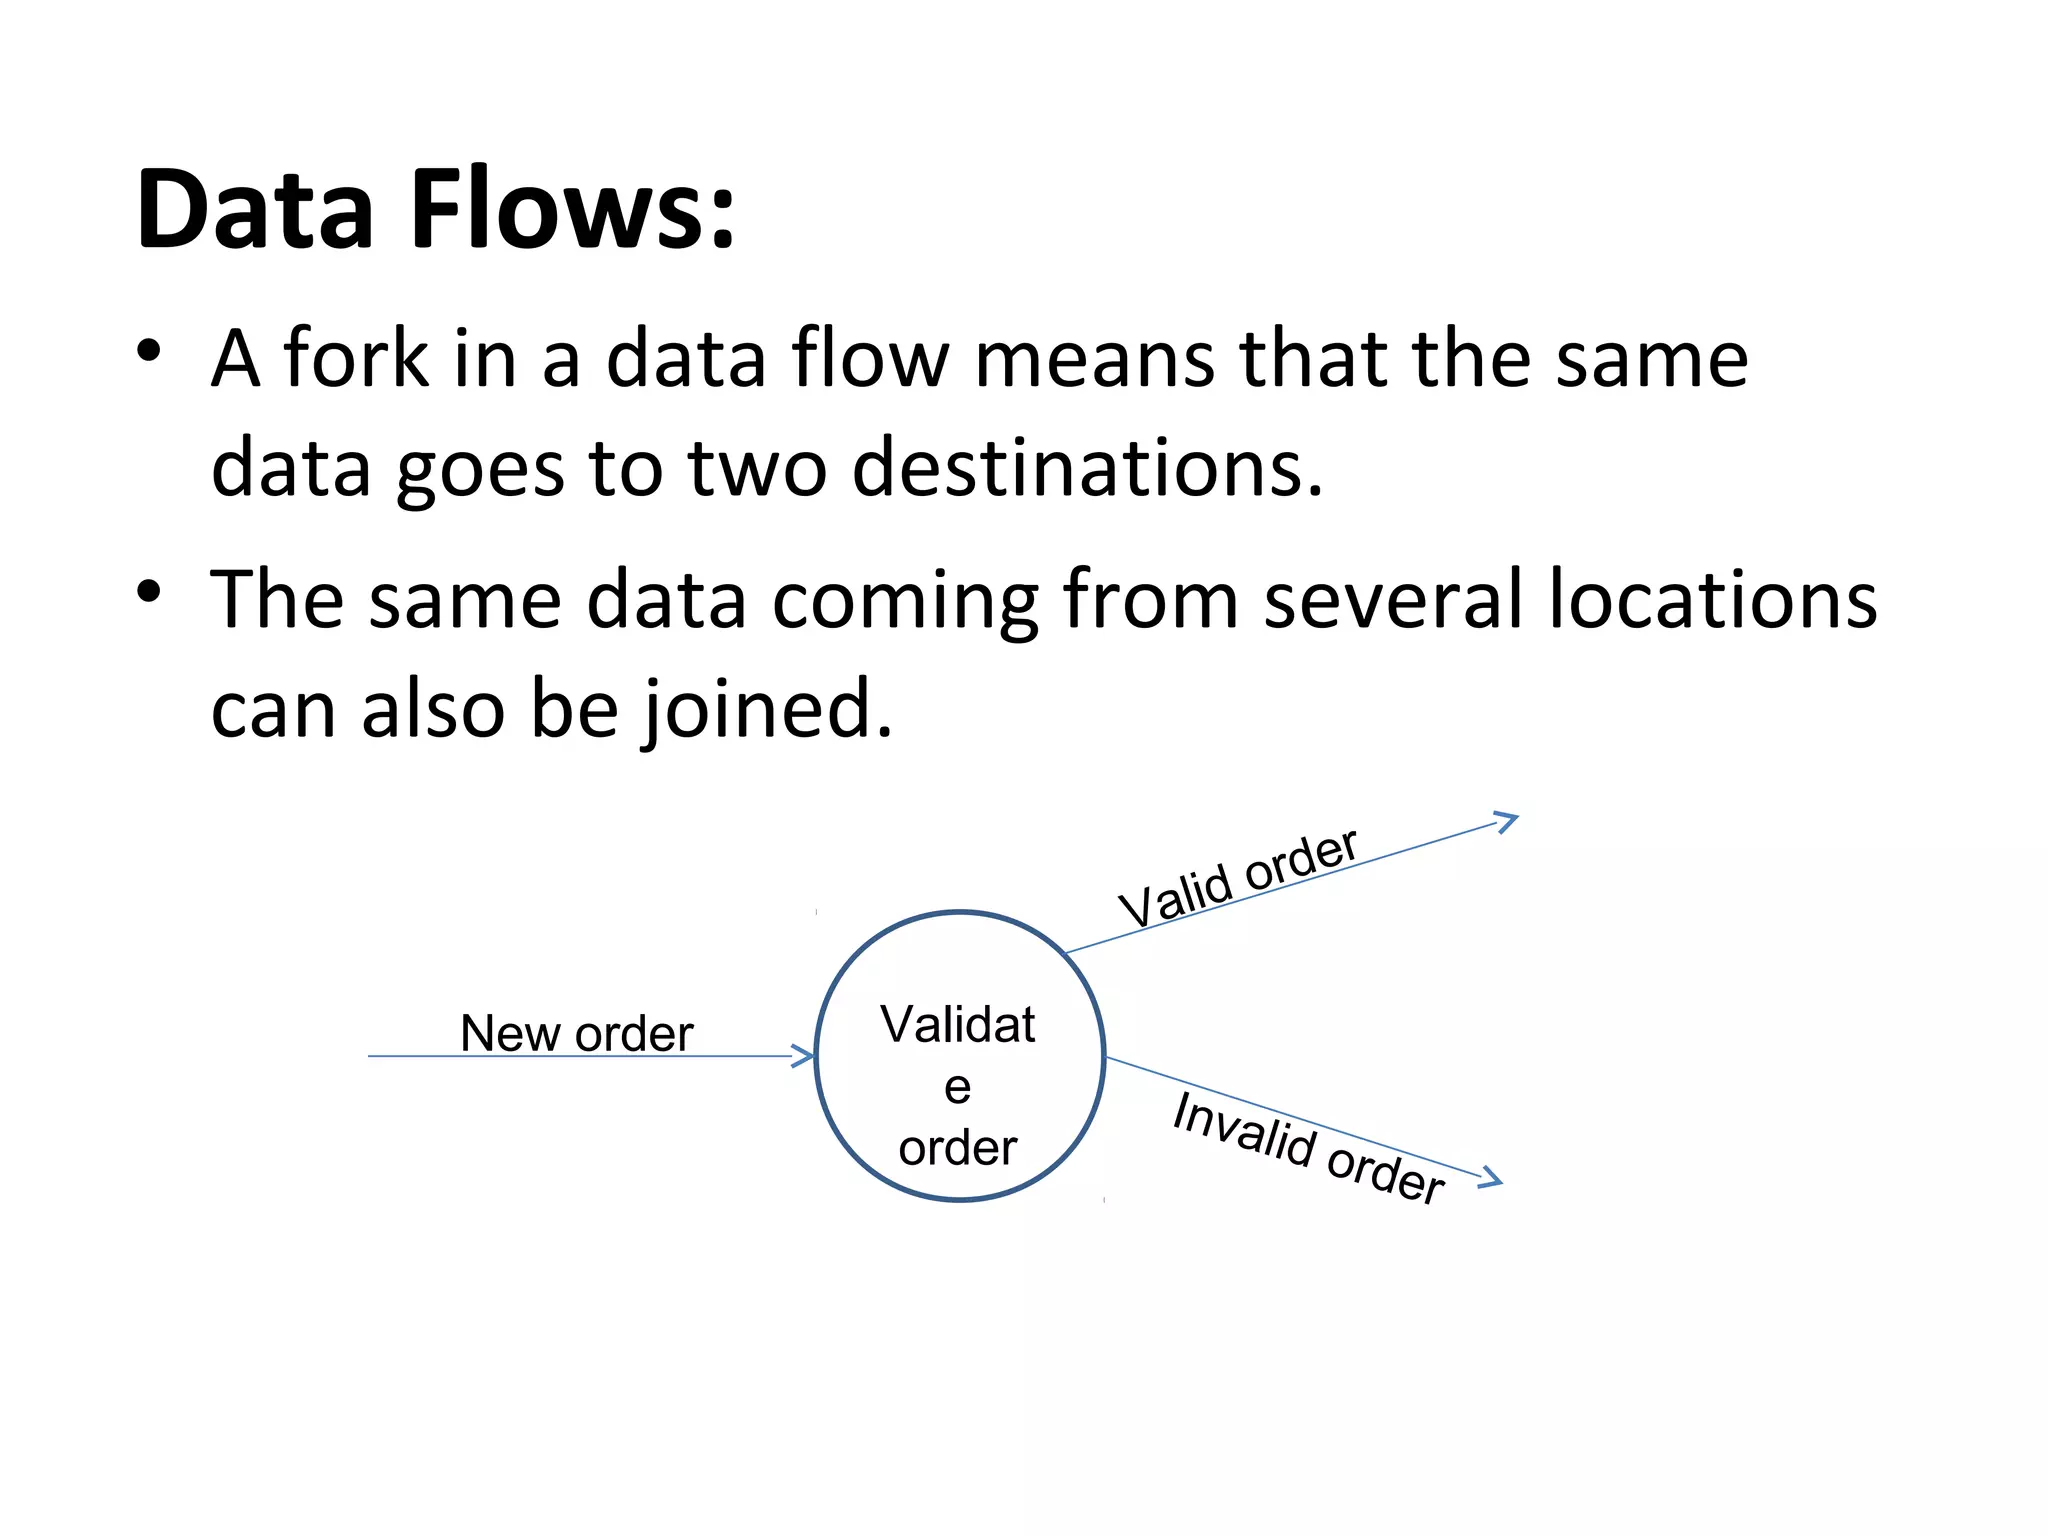
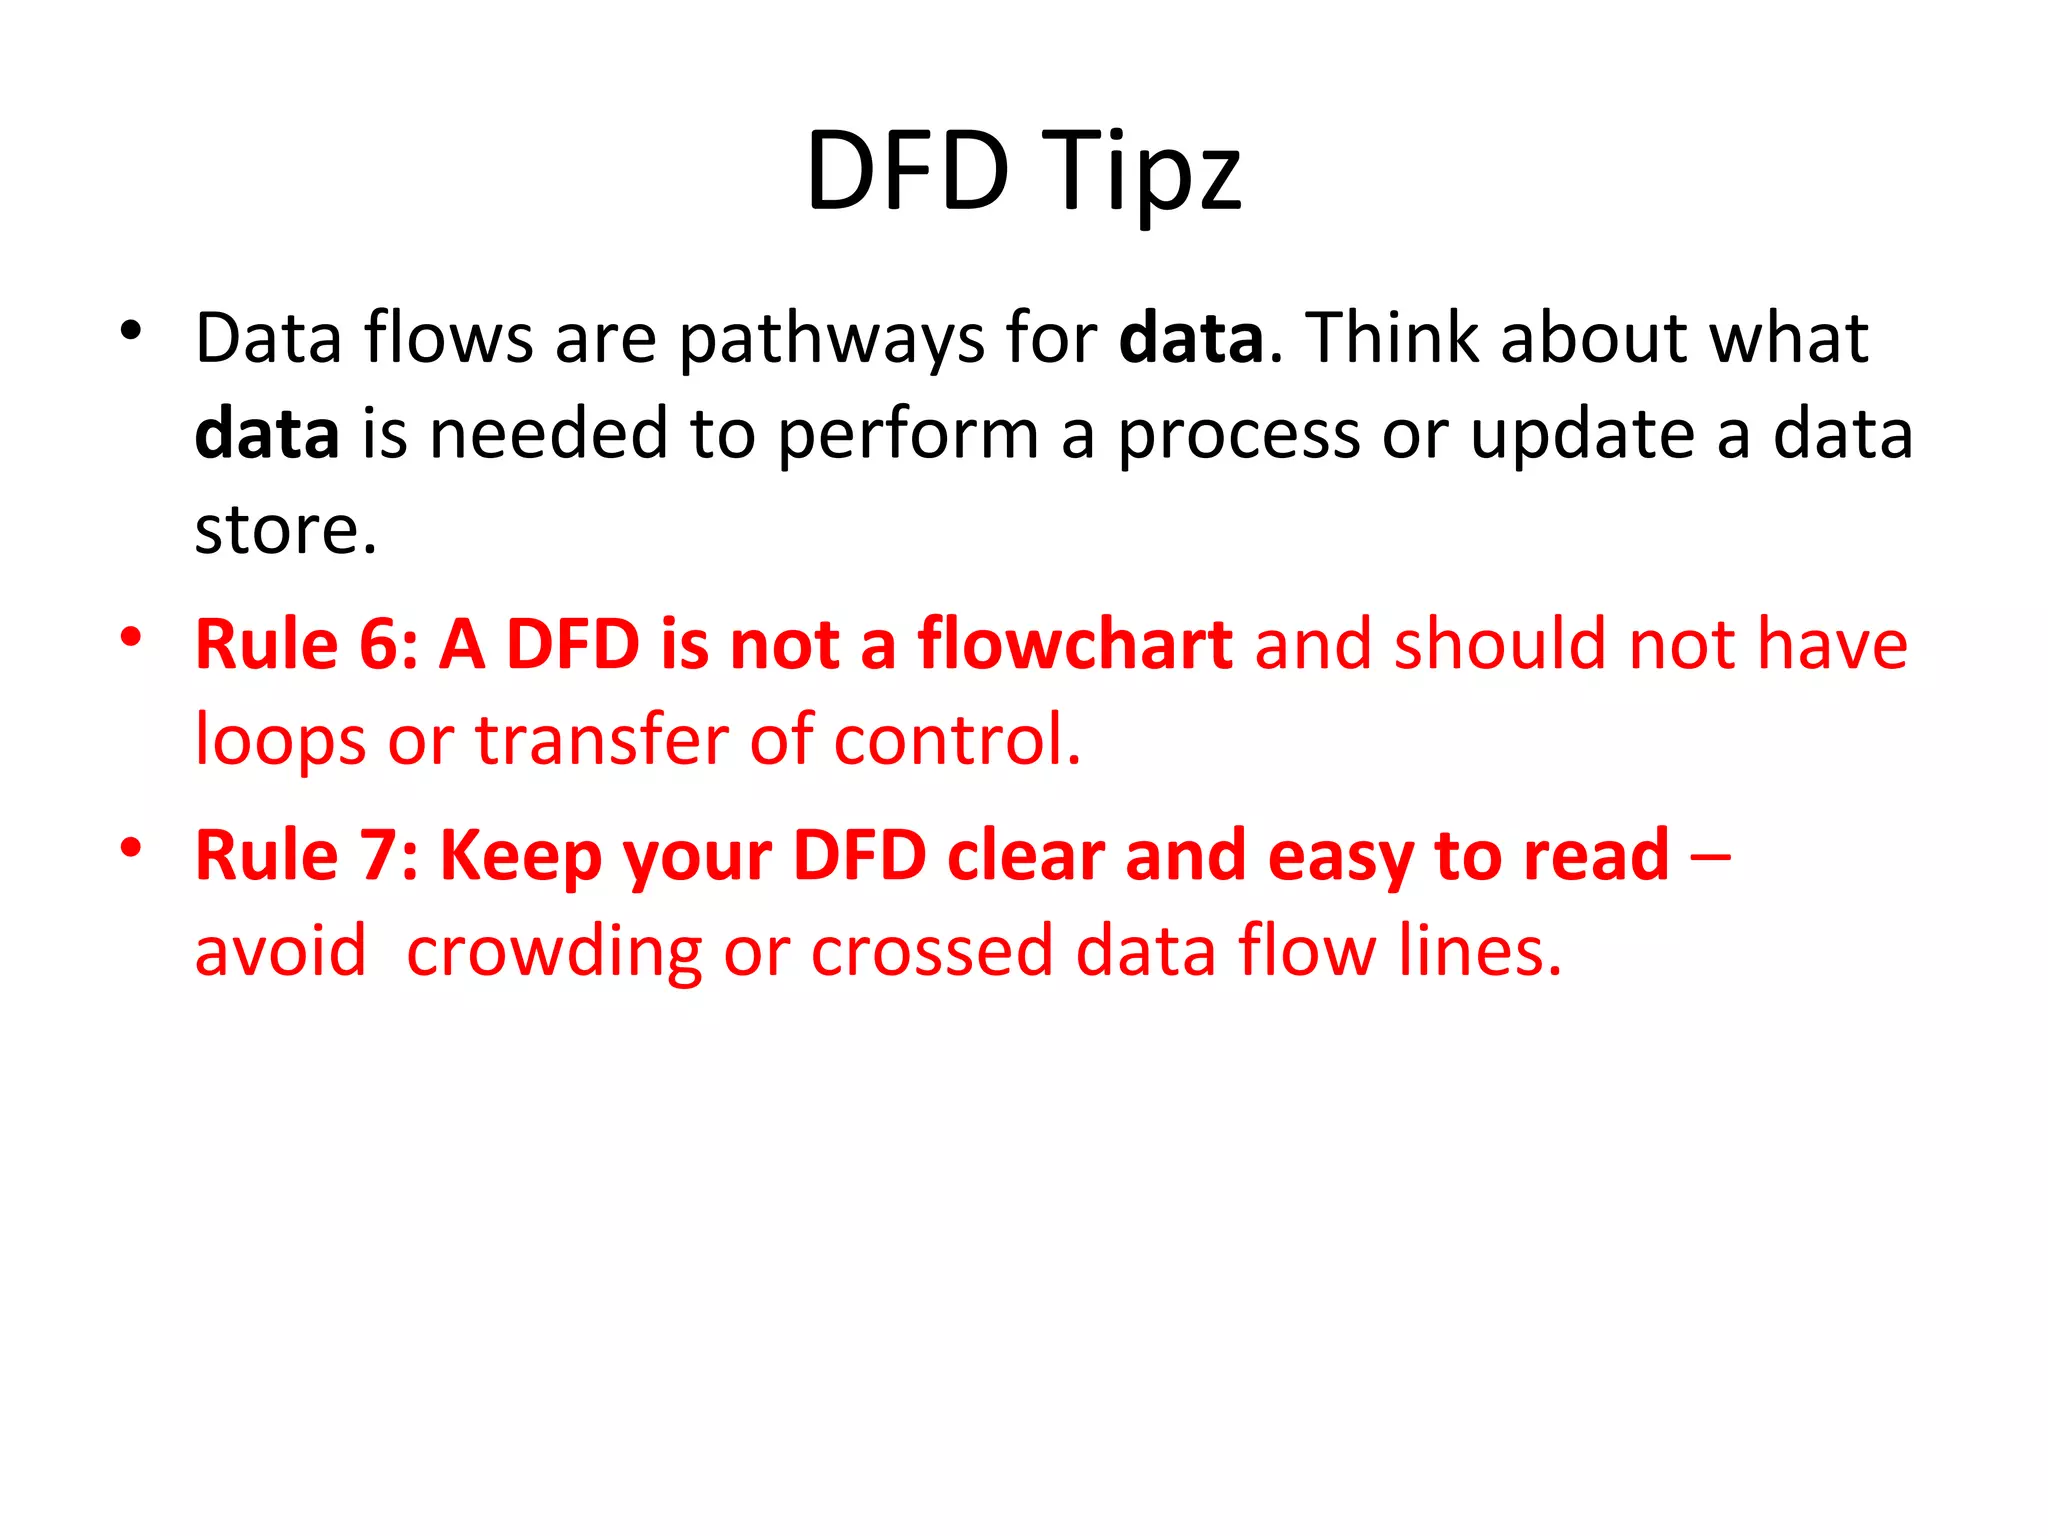
Data flows must be labeled and indicate data movement, with rules for representation and not indicating material goods.
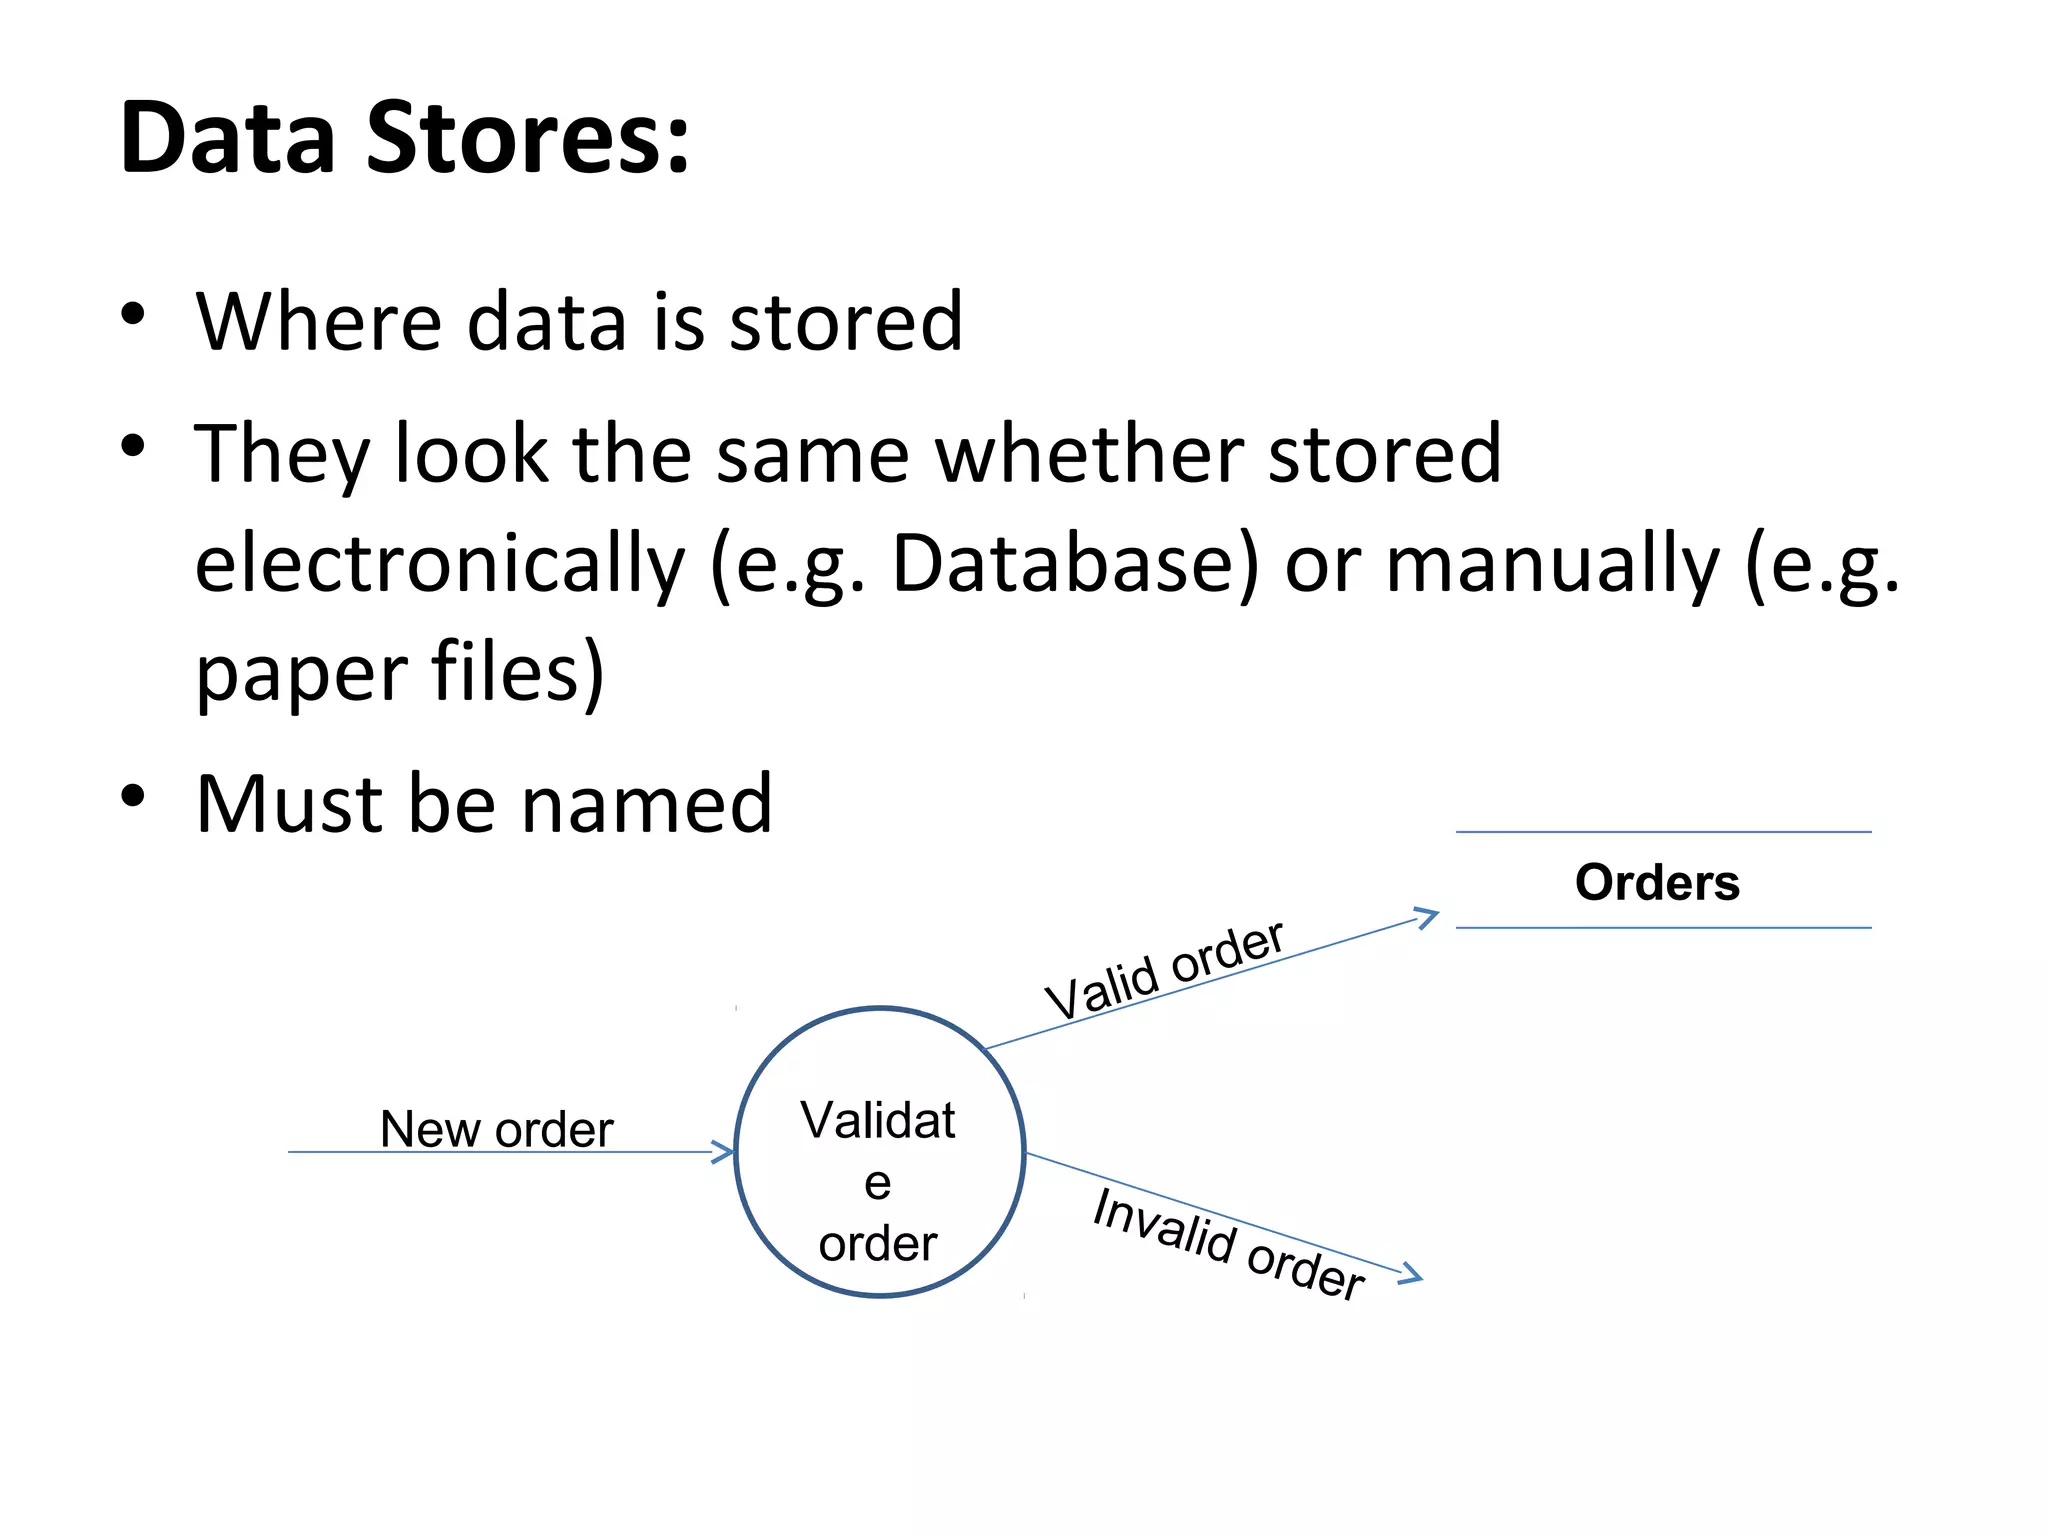
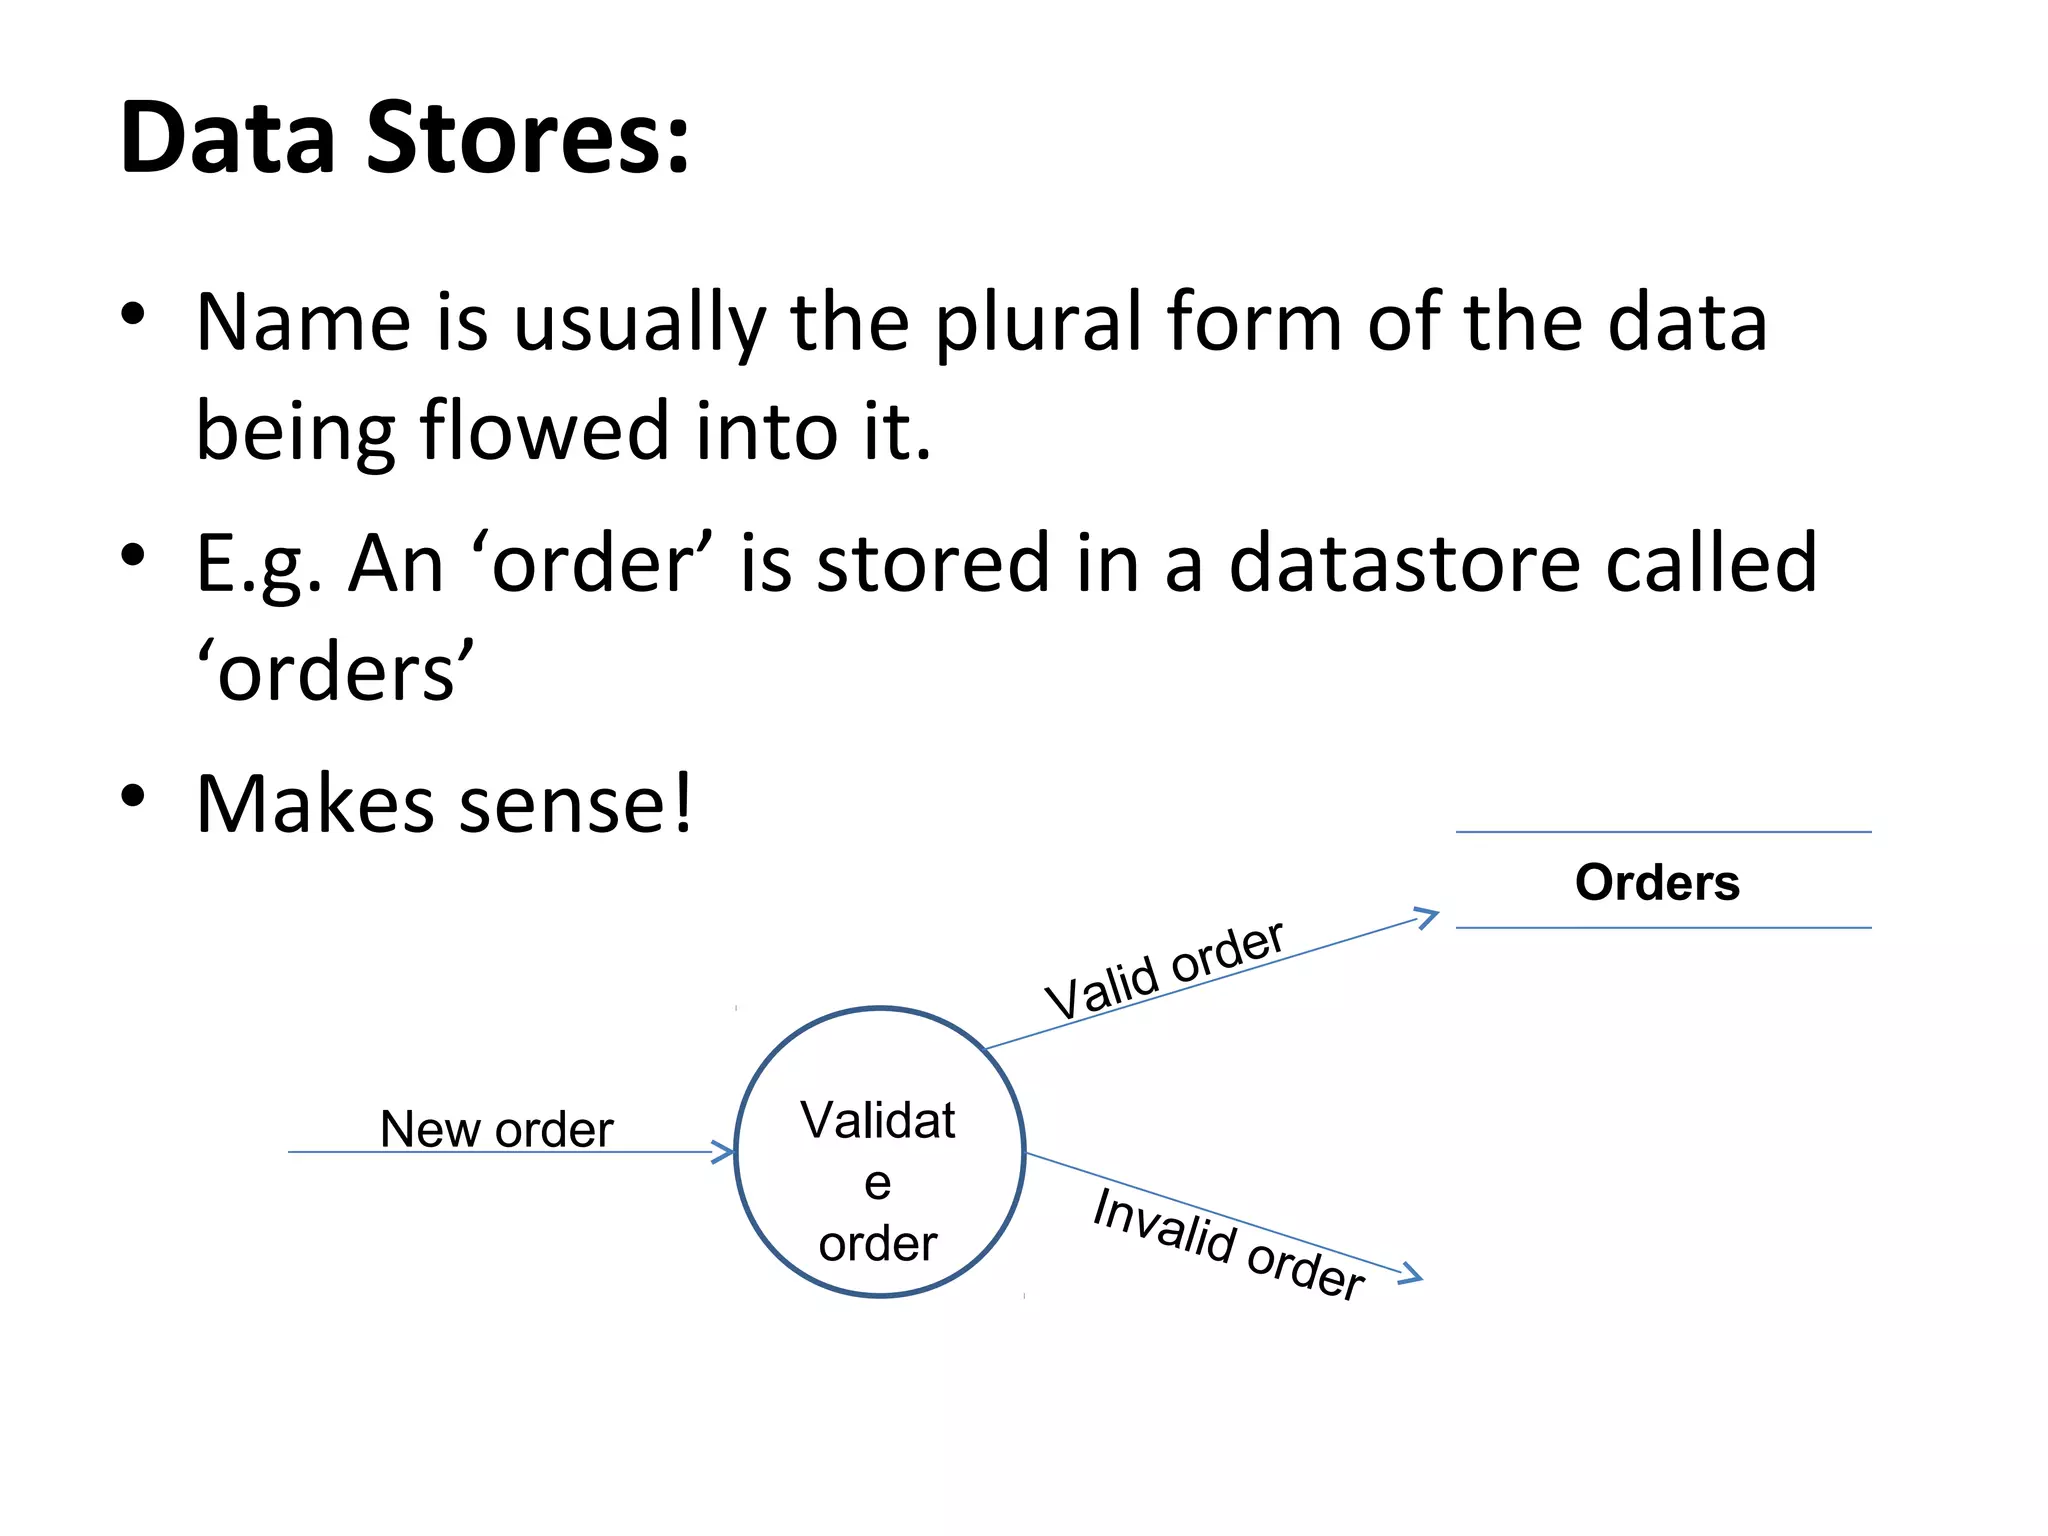
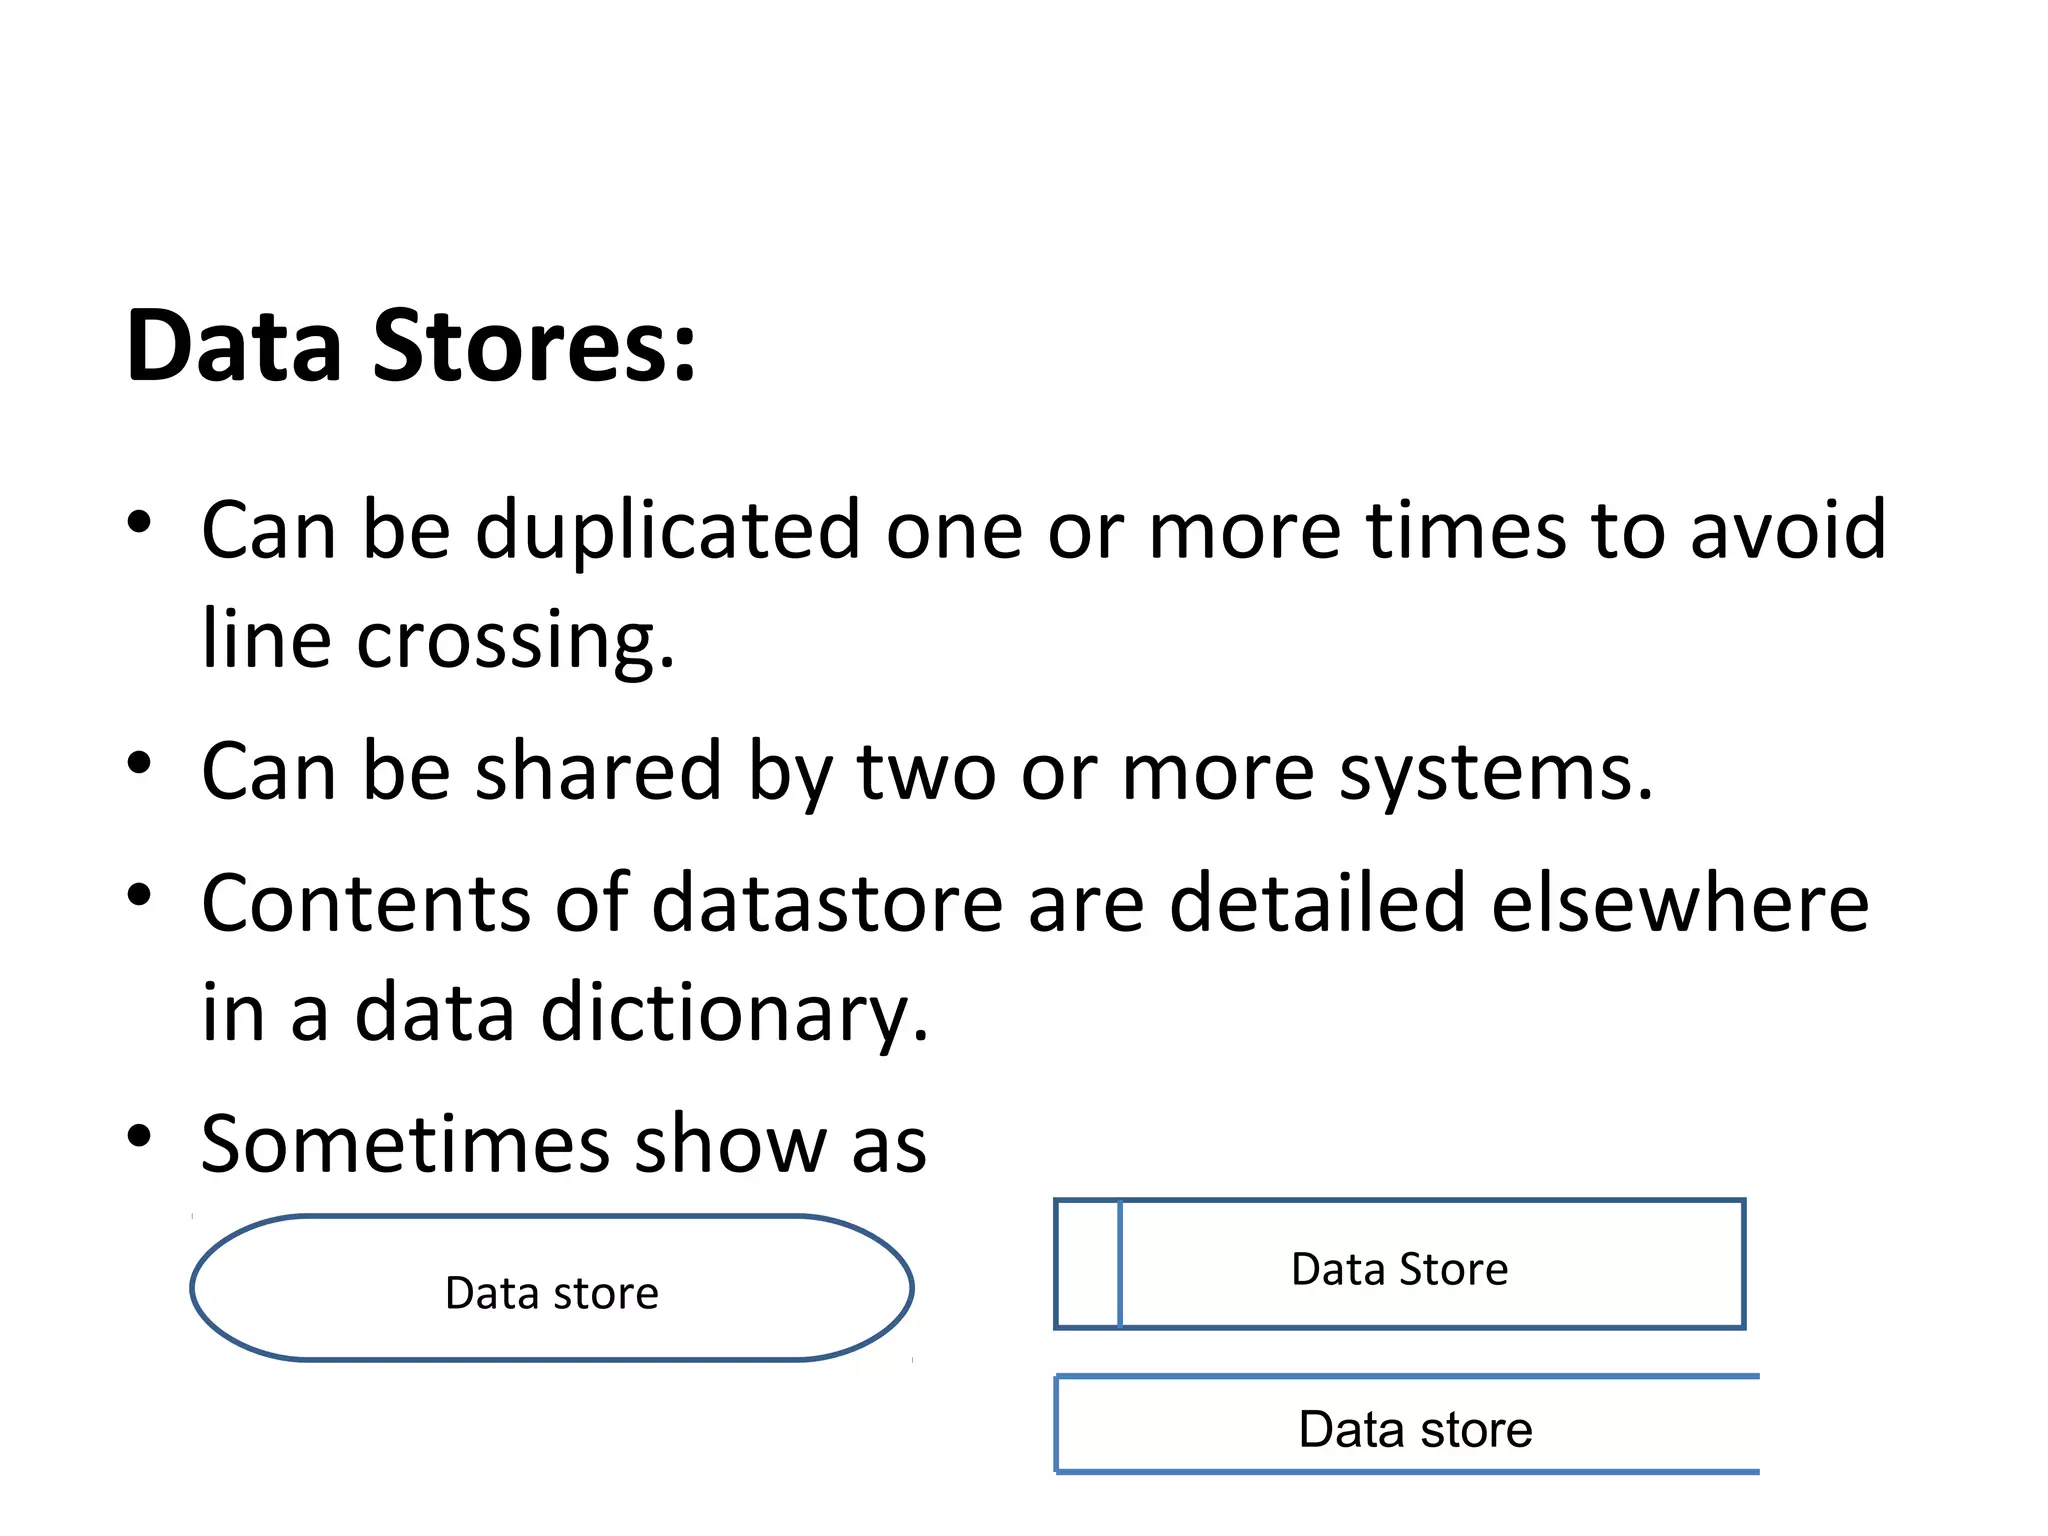
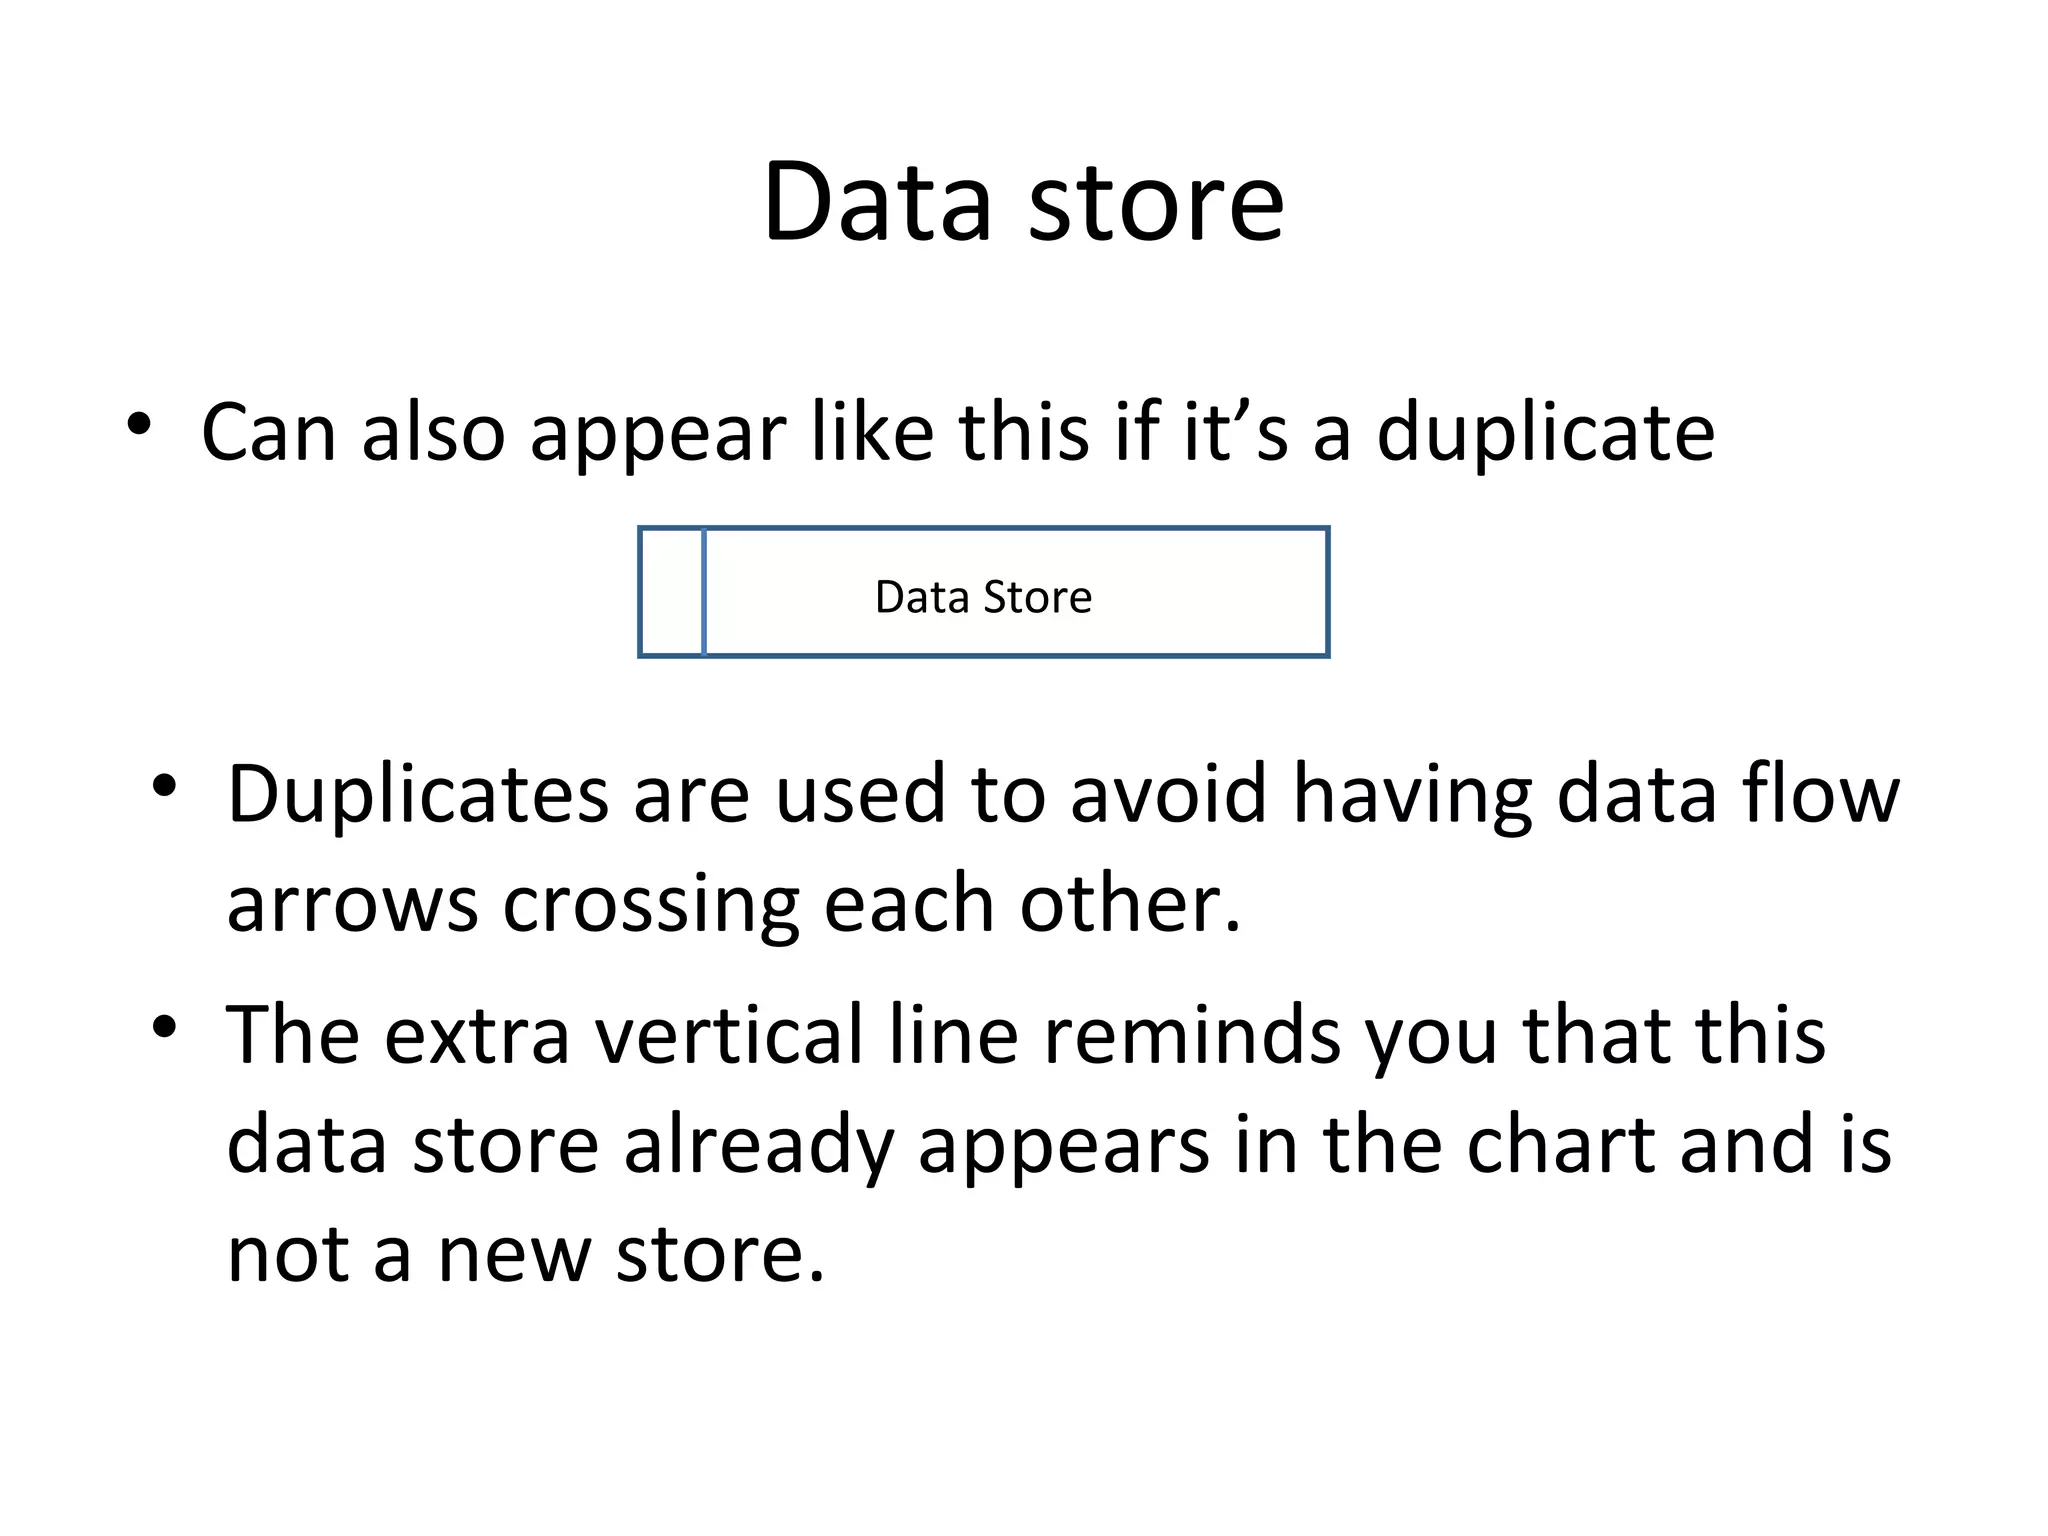
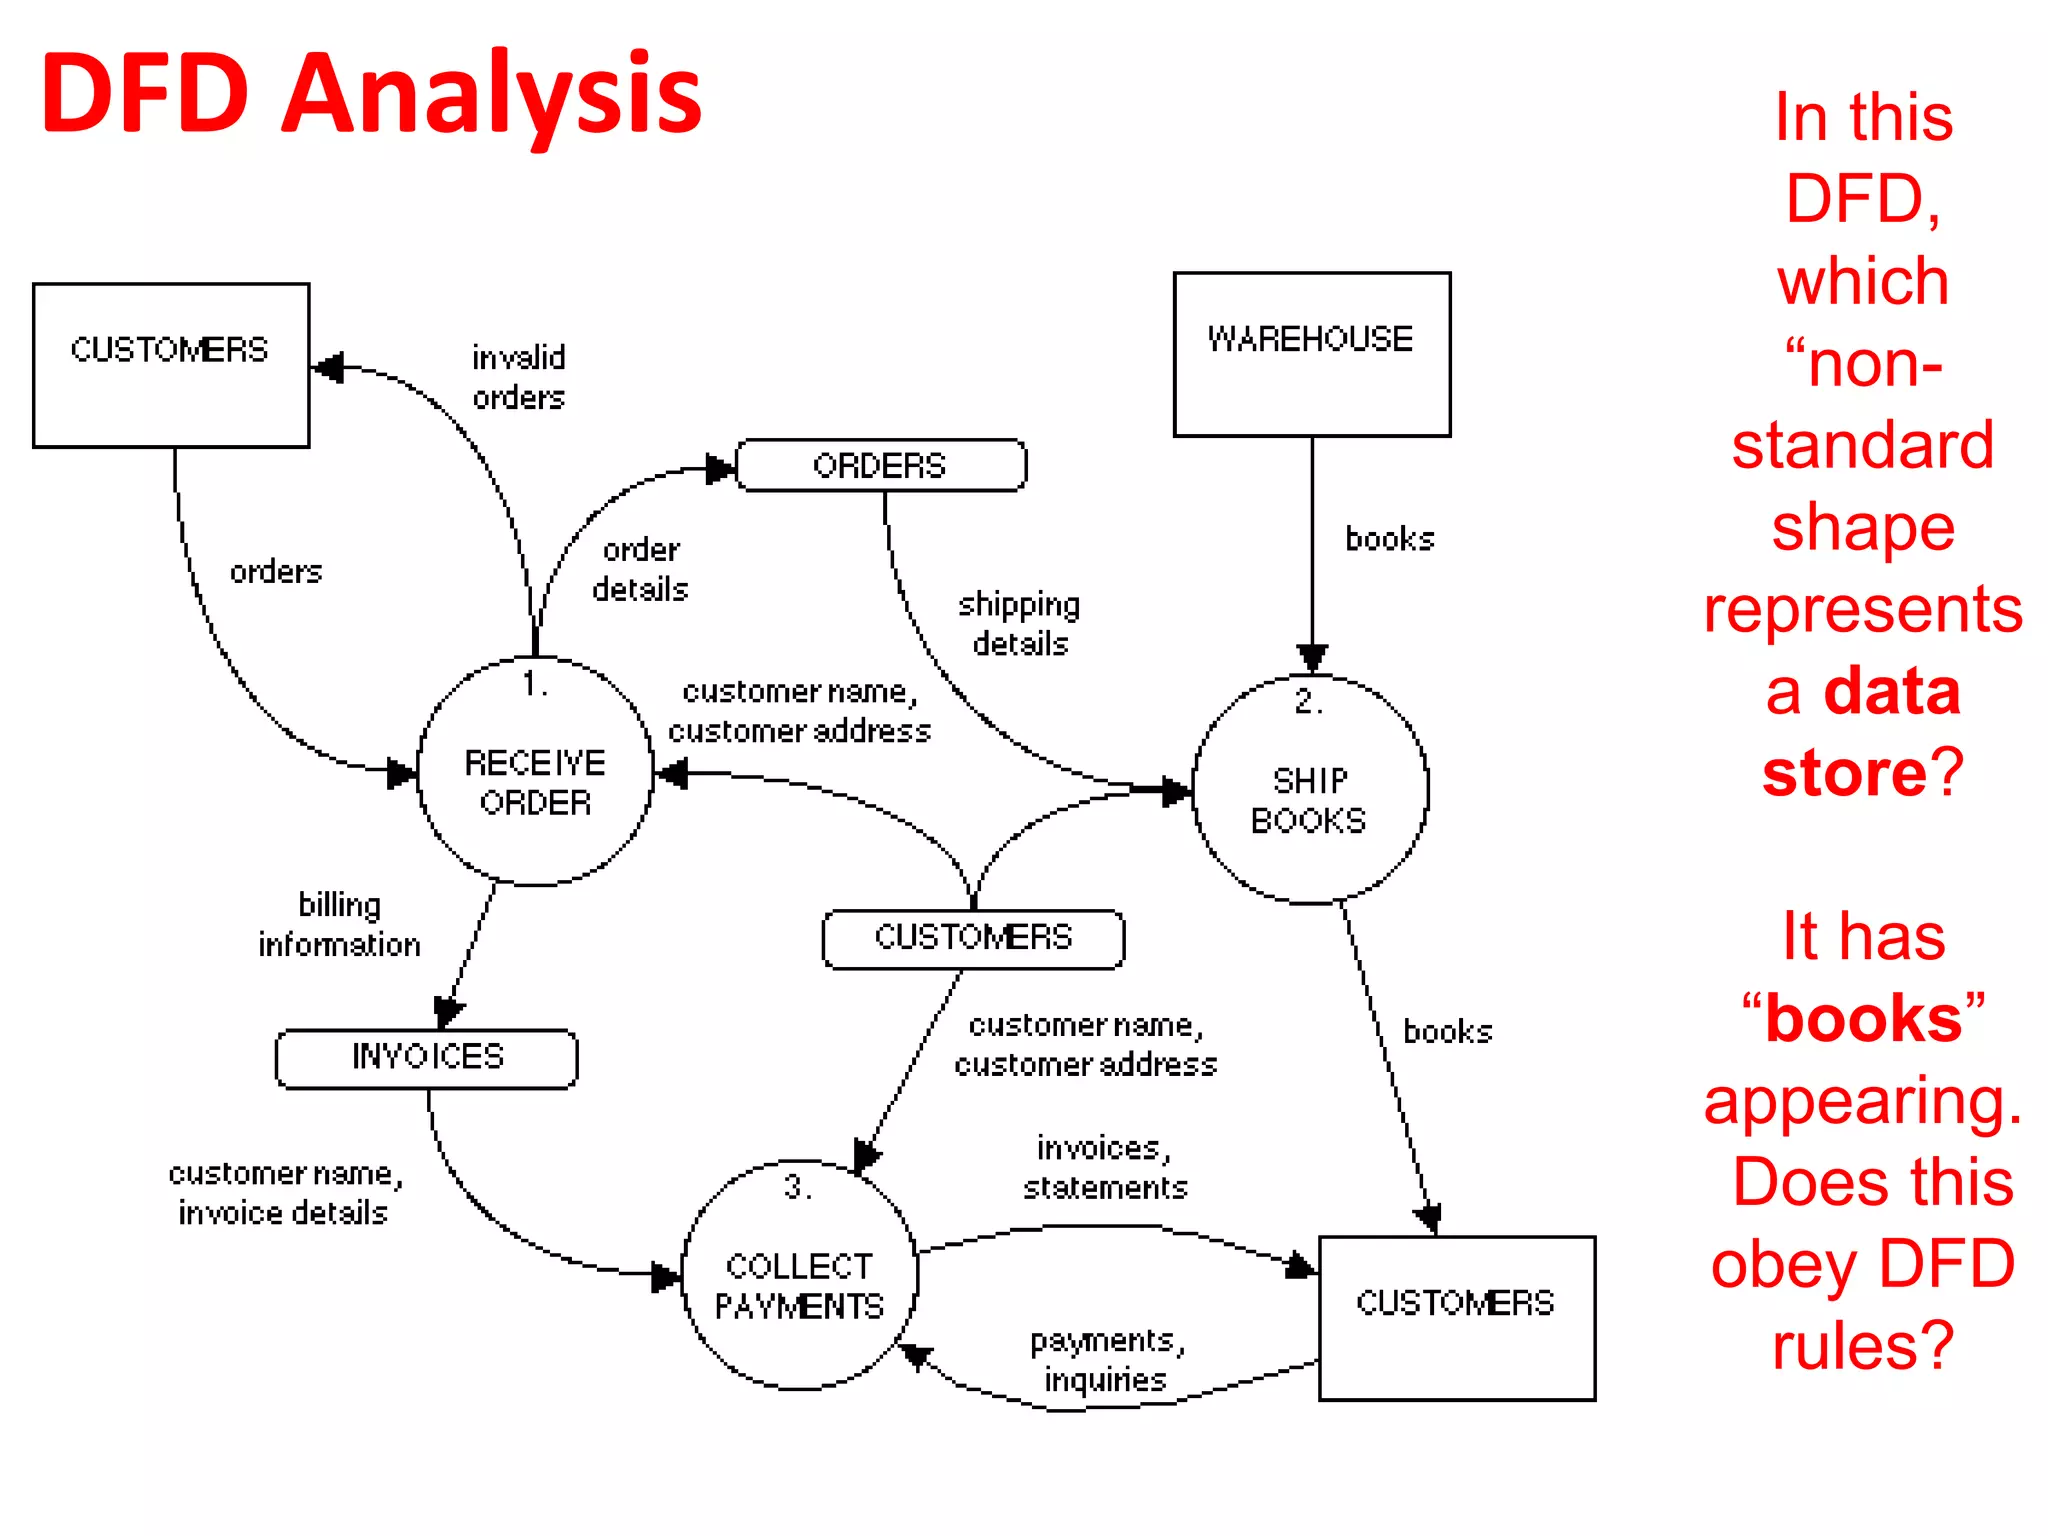
Data stores can be electronic or manual; naming conventions and duplication rules for effective DFDs.
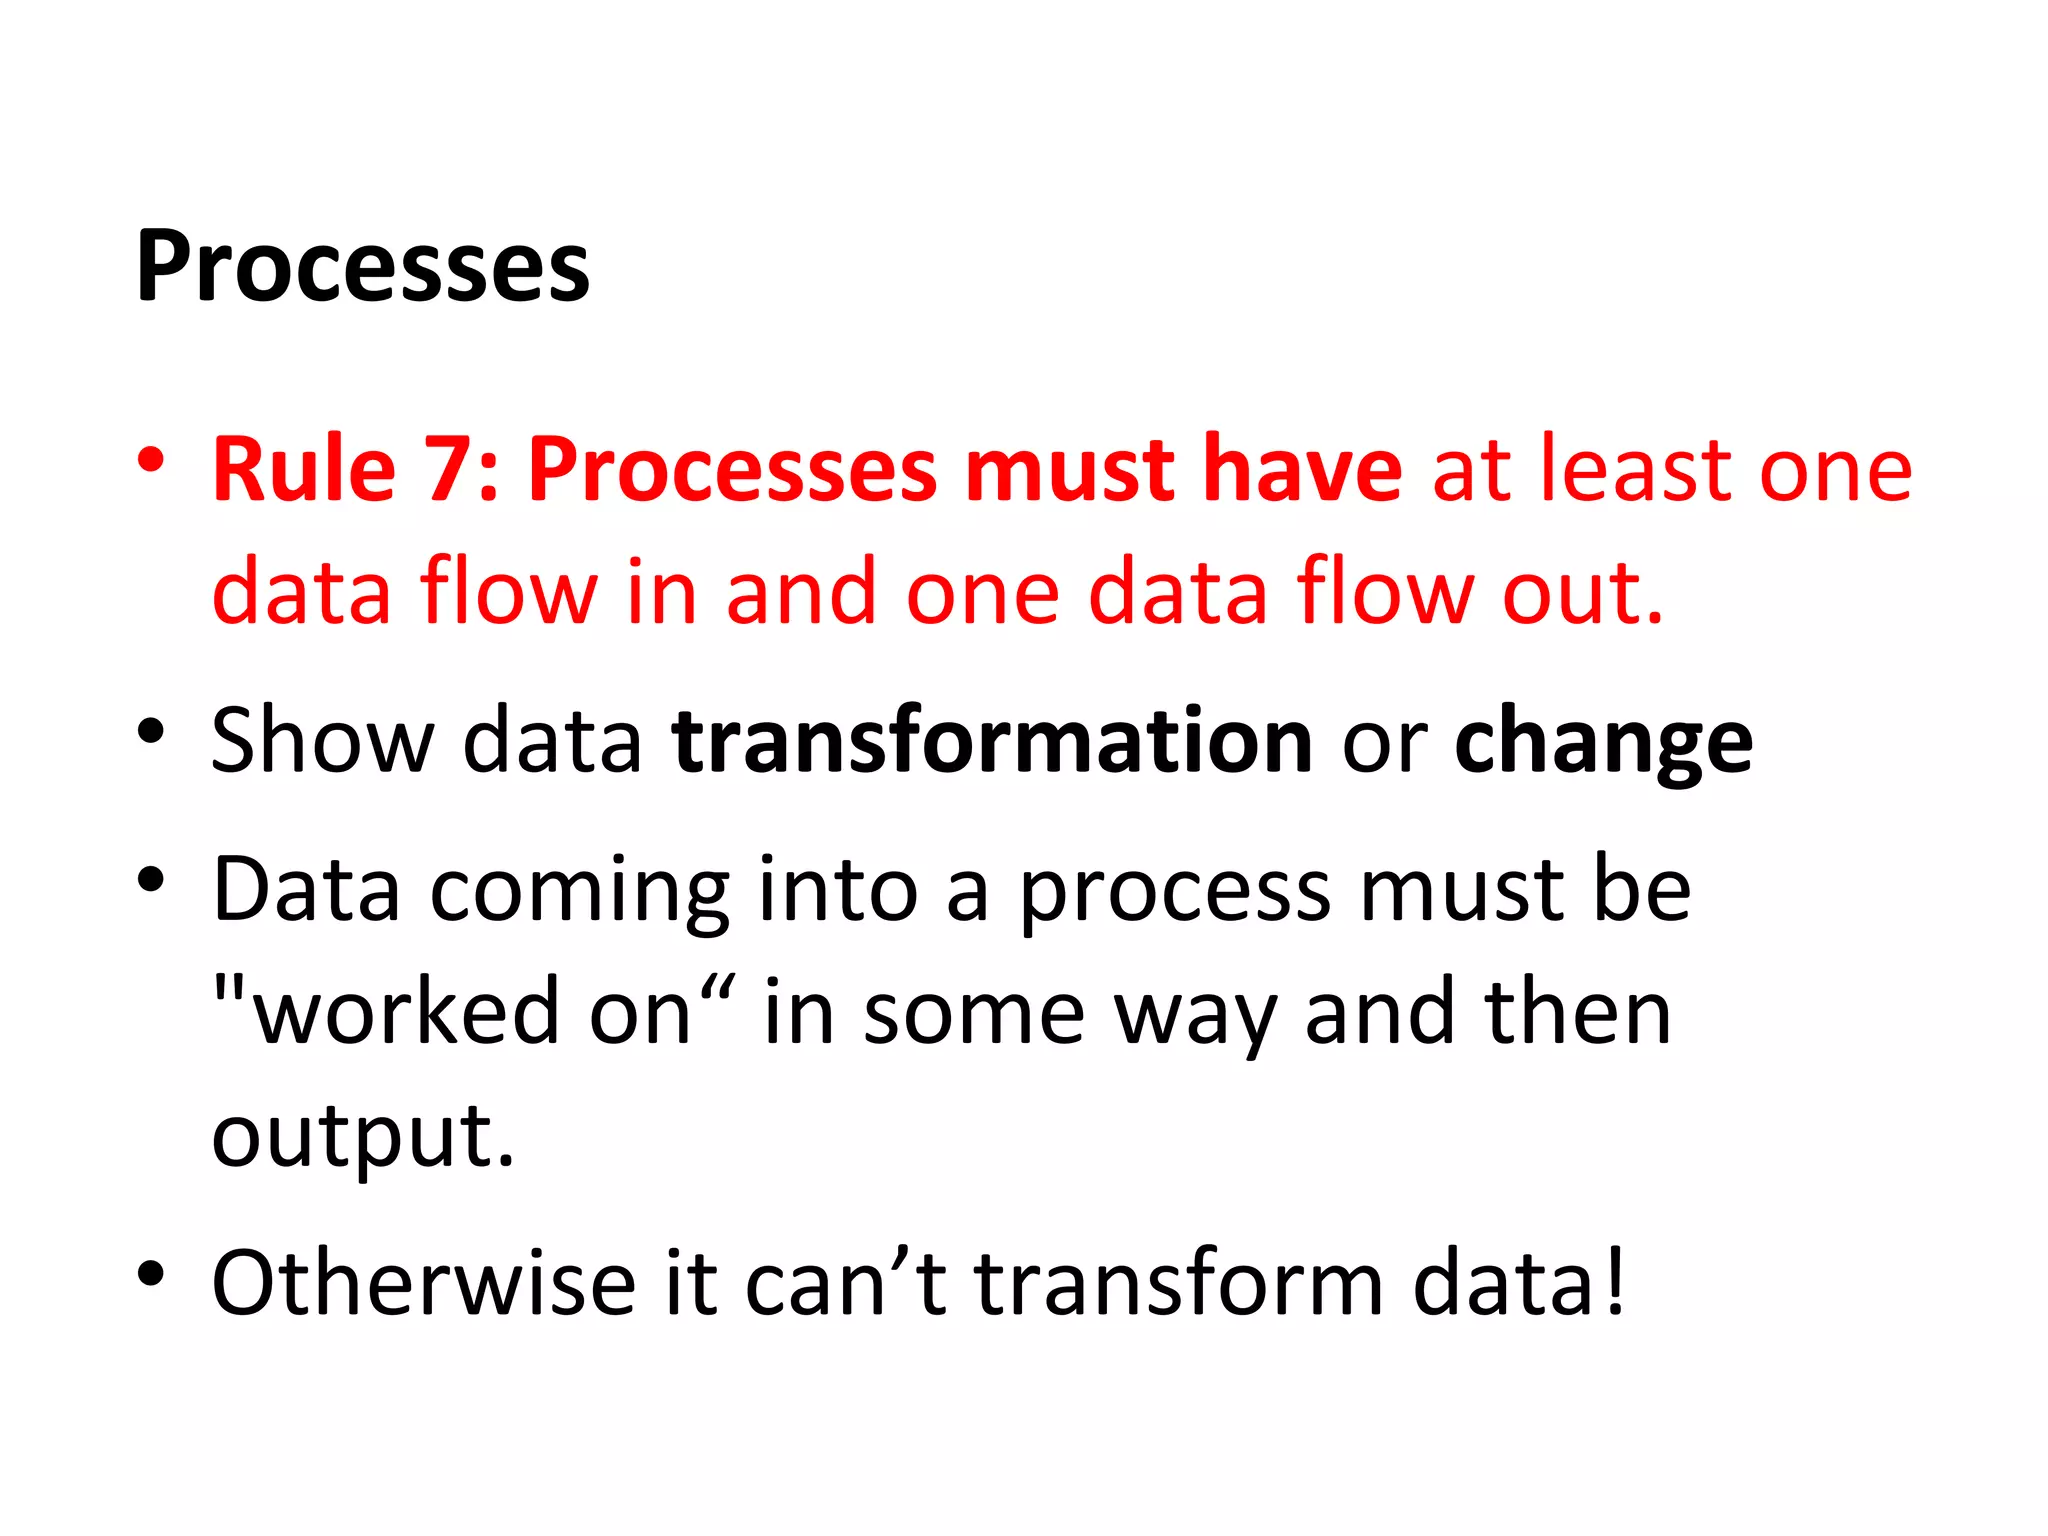
DFD processes require inputs and outputs, should be named descriptively, and follow numerical hierarchy.Illustrates incorrect data flow representations like direct data flows between entities or stores.
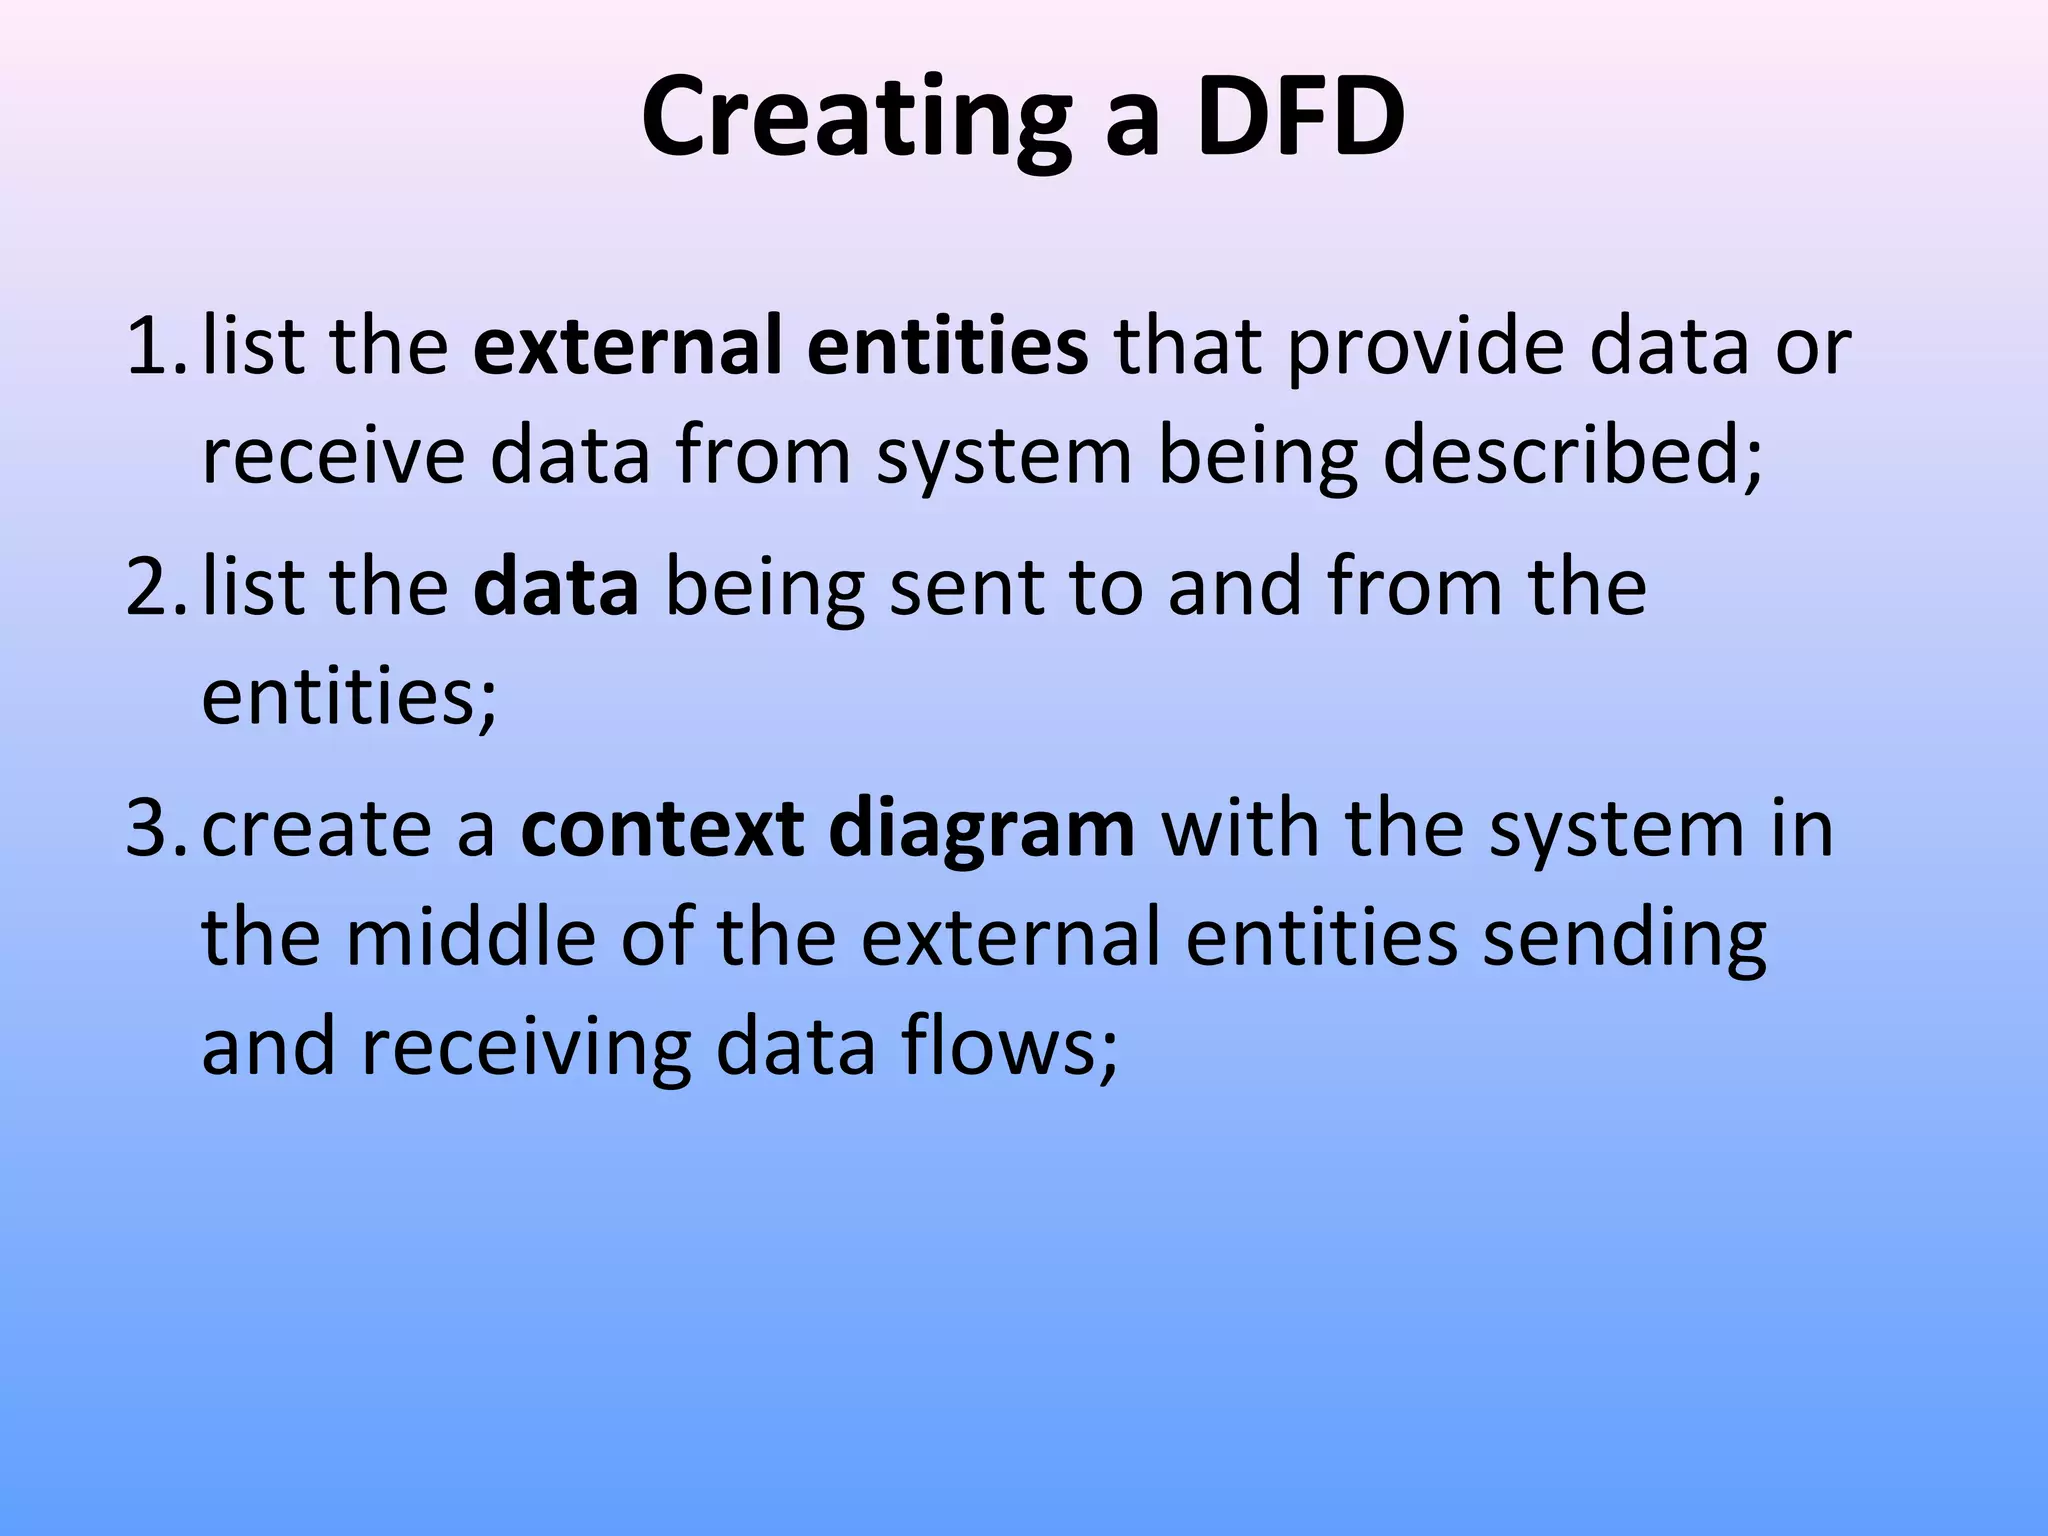
Detailed process for creating a DFD includes identifying entities, data flows, and processing functions.
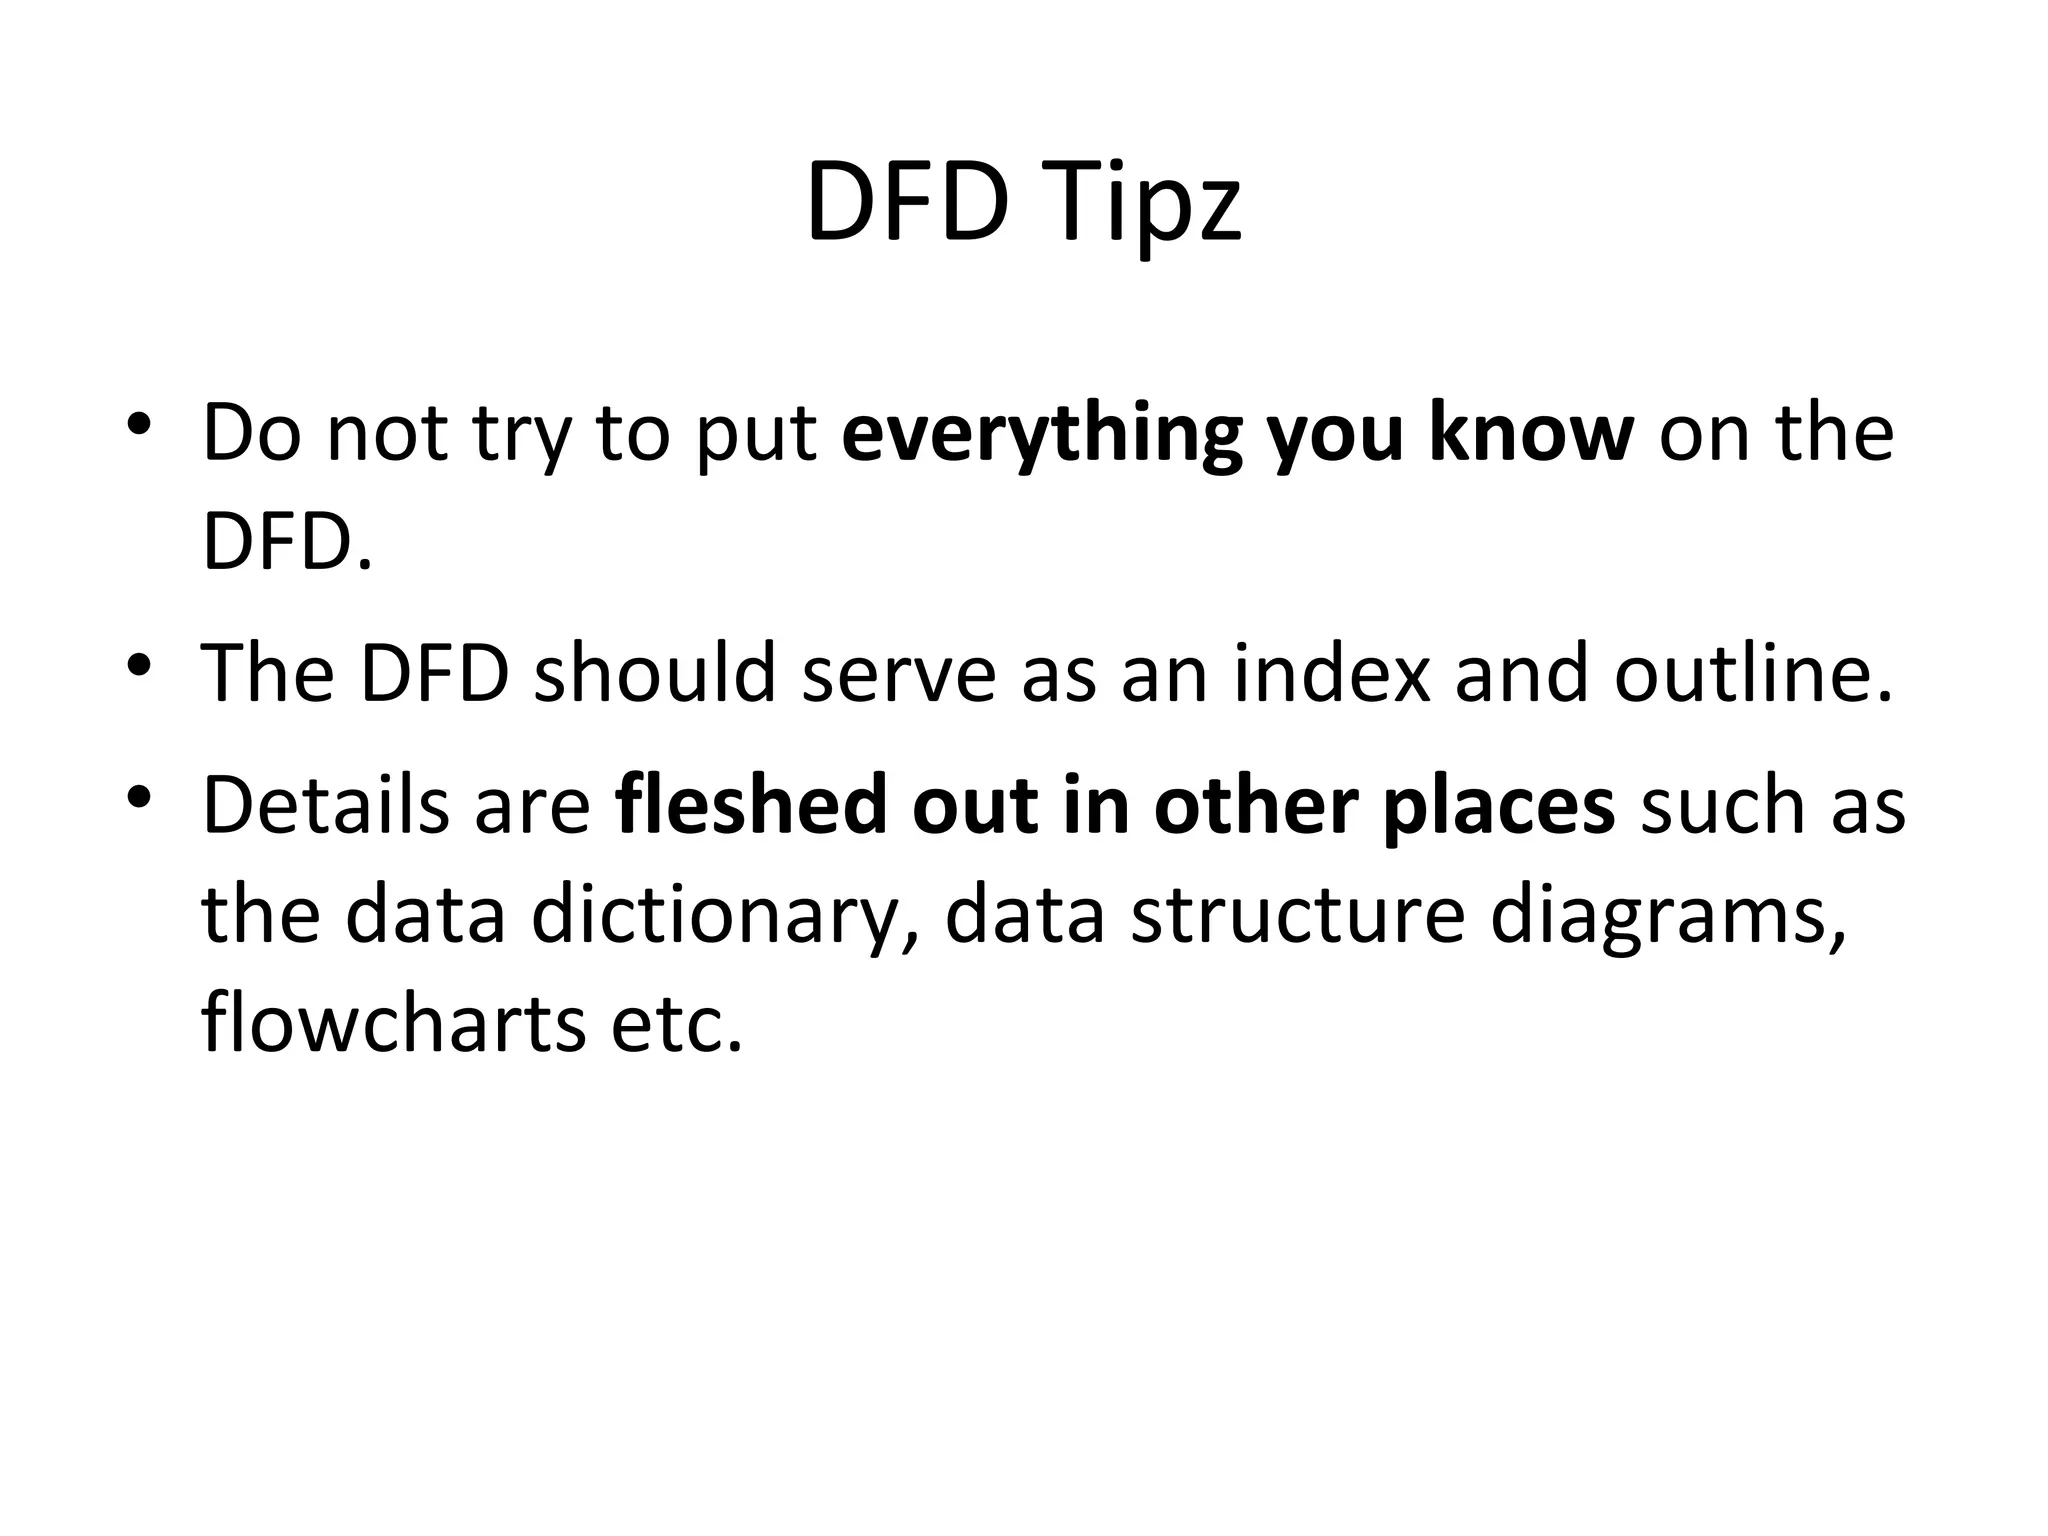
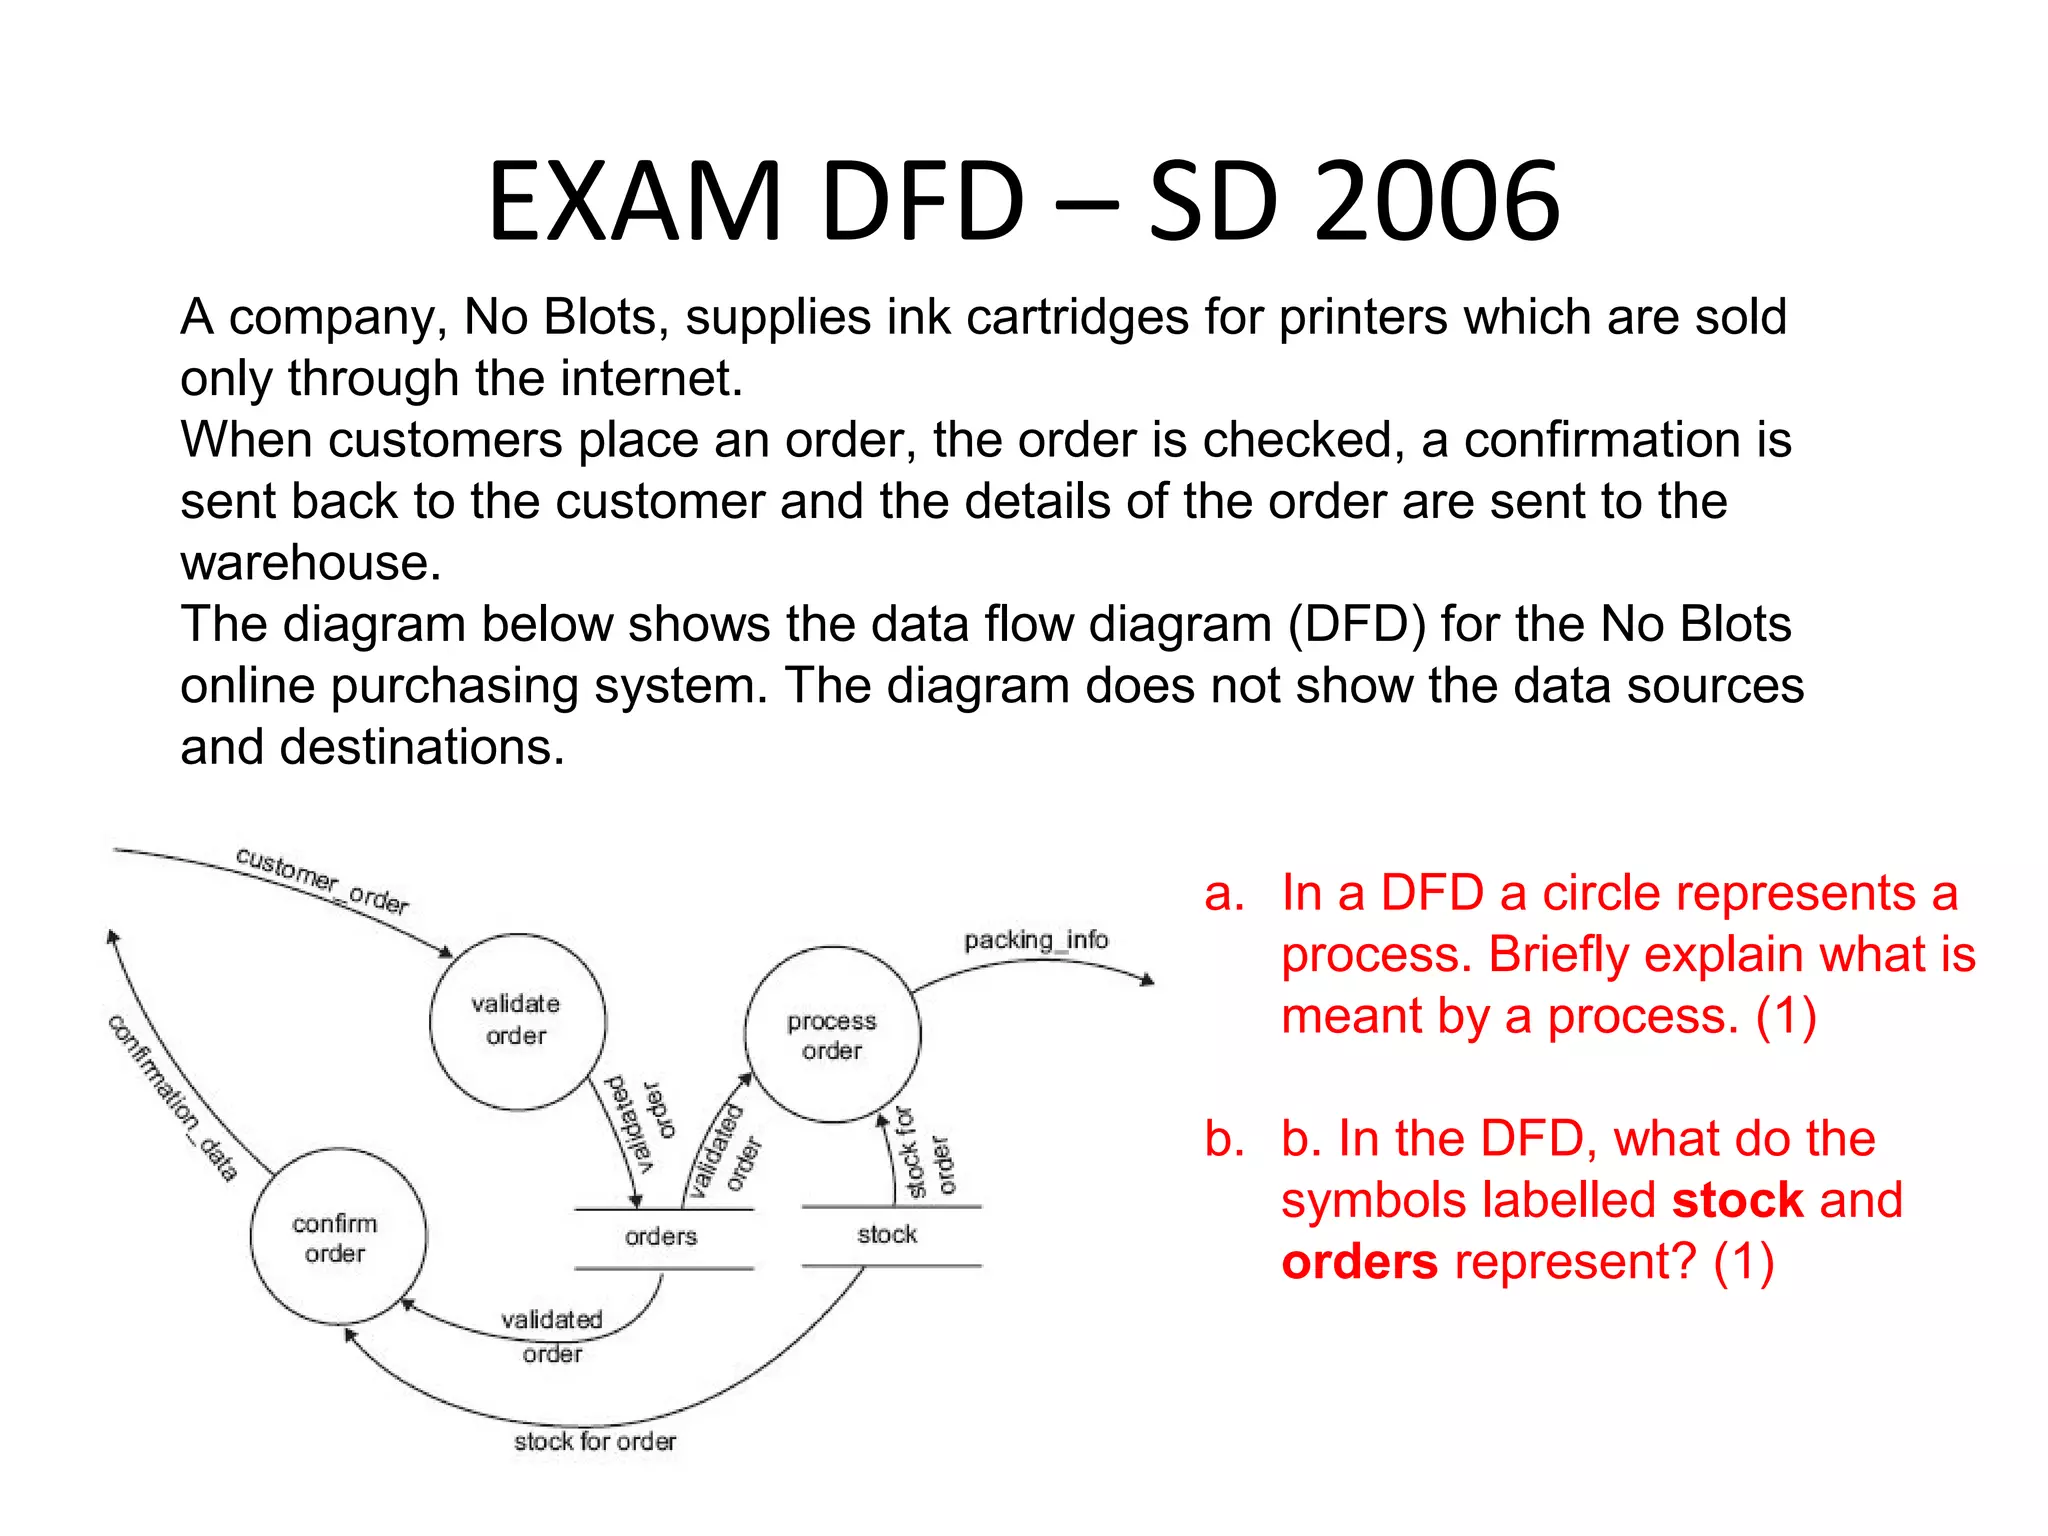
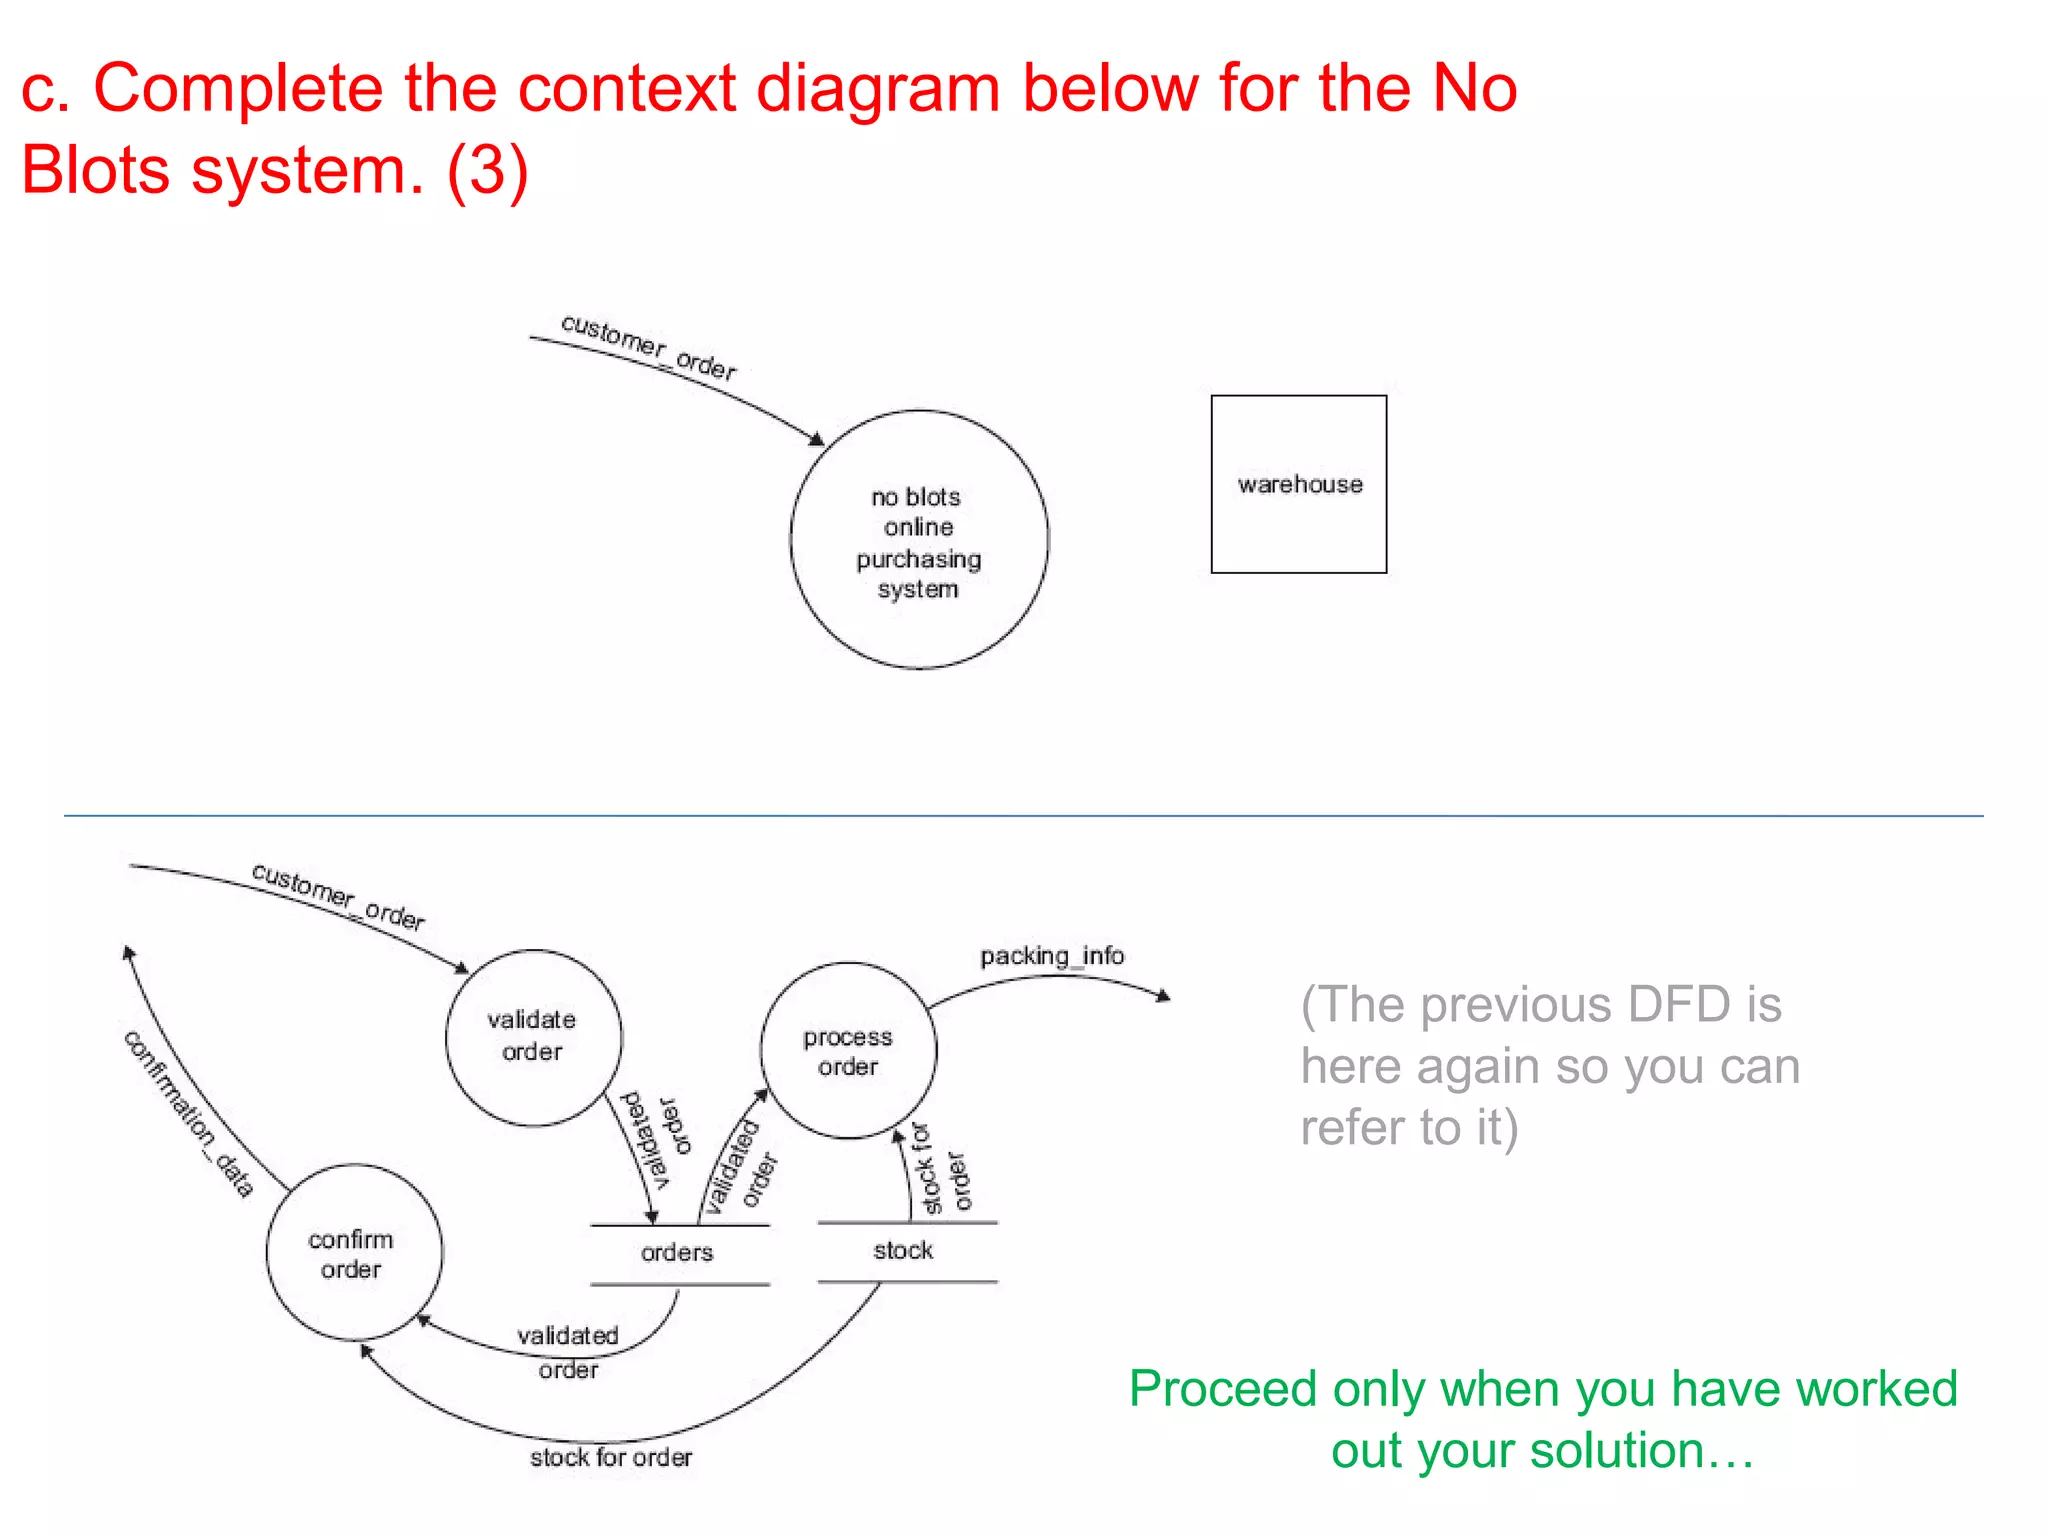
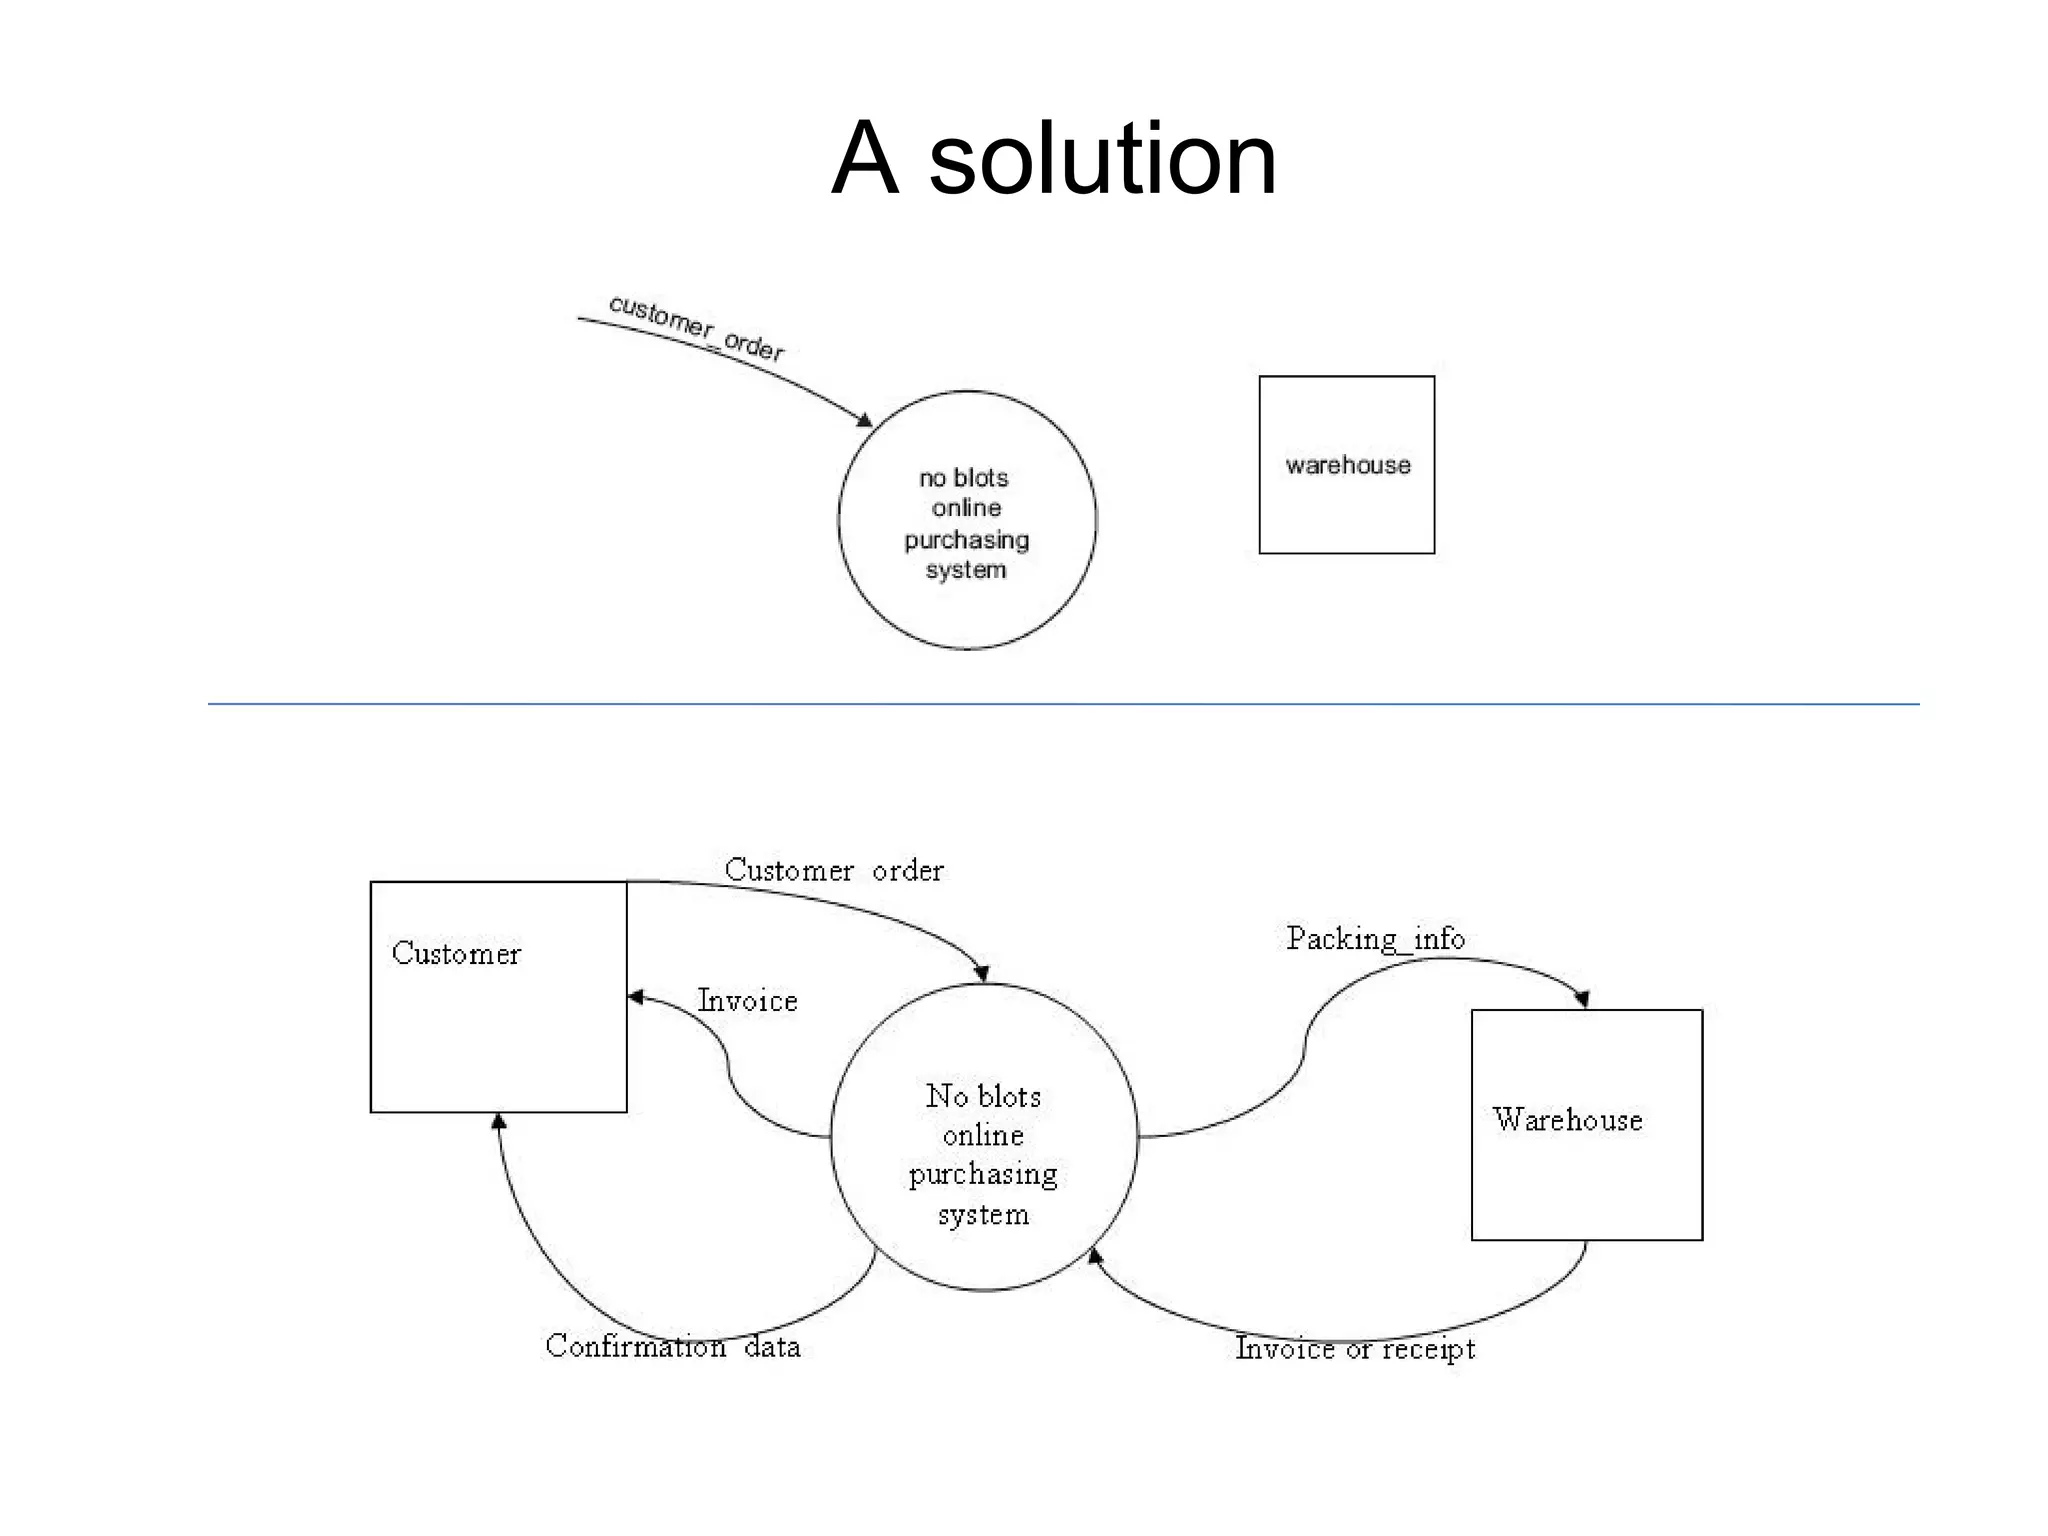
Tips for labeling, avoiding physical item references, and maintaining clarity while developing DFDs.A case study on a DFD for an online purchasing system outlines processes, symbols, and involves problem-solving.
Encourages analysis of DFDs and acknowledges resources and permissions for using and modifying presentations.
IT Applications TheorySlideshows
IT Applications Theory Slideshows
Data Flow Diagrams
Data Flow Diagrams
(DFD)
(DFD)
& Context diagrams
& Context diagrams
By Mark Kelly
McKinnon Secondary College
Vceit.com
2.
Context Diagram
• Ahigh-level Data Flow Diagram (DFD).
• Shows a system in relation to other external
systems
• Does not show details within the system
• The simplest form of a DFD.
3.
Context Diagram
• Contains:
–One Process – the whole system as a single shape
– No Data Store
– One or more External Entities – other systems
with a data flow to the system being described.
– Two or more Data Flows
• Later will zoom in and expand a context
diagram into sub-processes, creating more
detailed DFDs.
DFD/Context diagram shapes
•External Entity: sources or
destinations of data
• Data Flow: movement of data.
Entity
name
data name
• Data Store: where data is stored
(e.g. database)
data store name
…OR…
data store name …OR…
data store name
7.
DFD/Context diagram shapes
•Process: an activity that transforms or
manipulates the data (combines,
reorders, converts, etc.).
Process
name
External Entities:
– Canbe duplicated on the diagram one or
more times, to avoid line crossing.
– Are not part of the system being studied.
– May be part of the same organisation, but
are beyond the influence of the system
being described.
10.
External Entities:
– Canrepresent another system or subsystem
within the same organisation.
– Must receive data from or send data to the
system being described.
– Are placed on the edges of the DFD
External Entities
• Rule1: In a DFD do not show direct data
flow from one external entity to
another.
• They are irrelevant to the system being
described because they are external.
• Like how a conversation between two
people you don’t know is irrelevant to
you.
Data Flows:
• Rule2: Only represent data, not material
goods like books, goods.
• Shown as arrows with labels.
• Must be named.
• Rule 3: Only include one type of data per
arrow. E.g. “Orders”, “Customer Data”
• Do not use arrows with heads on each end.
Identify each flow separately.
15.
Data Flows:
• Afork in a data flow means that the same
data goes to two destinations.
• The same data coming from several locations
can also be joined.
r
orde
d
Vali
New order
Validat
e
order
Inva
lid o
rder
Data Stores:
• Wheredata is stored
• They look the same whether stored
electronically (e.g. Database) or manually (e.g.
paper files)
• Must be named
r
orde
d
Vali
New order
Validat
e
order
Inva
lid o
rder
Orders
18.
Data Stores:
• Nameis usually the plural form of the data
being flowed into it.
• E.g. An ‘order’ is stored in a datastore called
‘orders’
• Makes sense!
r
orde
d
Vali
New order
Validat
e
order
Inva
lid o
rder
Orders
19.
Data Stores:
• Canbe duplicated one or more times to avoid
line crossing.
• Can be shared by two or more systems.
• Contents of datastore are detailed elsewhere
in a data dictionary.
• Sometimes show as
Data store
Data Store
Data store
20.
Data store
• Canalso appear like this if it’s a duplicate
Data Store
• Duplicates are used to avoid having data flow
arrows crossing each other.
• The extra vertical line reminds you that this
data store already appears in the chart and is
not a new store.
Processes
• Rule 7:Processes must have at least one
data flow in and one data flow out.
• Show data transformation or change
• Data coming into a process must be
"worked on“ in some way and then
output.
• Otherwise it can’t transform data!
24.
Processes
• Are namedwith a verb and an object of
the verb (the thing being processed)
– E.g. “Calculate (verb) wages (object)”.
25.
Processes
• Each processshould represent only one
function or action.
• An "and" in the name probably betrays
the presence of more than one process.
26.
Processes
• Are numberedbased on their level of detail
– e.g. in a level 1 DFD, a top level process may be Process
14.
– Zoom in to a level 2 DFD and Process 14 opens up to
reveal the next level of detail: processes 14.1, 14.2, 14.3,
14.4.
– Zoom in to process 14.3 in a level 3 DFD and show
processes 14.3.1 to 14.3.6.
• Should generally move from top to bottom
and left to right.
27.
Processes
• Rule 5:Processes have no order of operation
stated or implied.
• E.g. Just because one process to above or to
the left of another process does not mean
that process must take place before the other
one.
28.
IT’S A BADDFD
• Do not use direct data flows from one data
store to another. There must be a process
between the store.s
• Do not use direct data flows from an external
entity to a data store flows. Again, a process
is needed between them.
• Do not show direct data flows between
external entities.
29.
Bad! Flow betweenexternal
entities
Fire brigade
Weather forecast
Weather bureau
Weather forecast
Call for help
Assess
fire risk
30.
Bad! Flow directto data store
Fire brigade
Weather bureau
Weather forecast
Call for help
Forecast history
Assess
fire risk
Weather forecast
31.
Bad! Flow directbetween data
stores
Customer
Order
Invoice
Process
order
Order
Inventory
Stock check
Stock numbers
Orders
32.
Creating a DFD
1.listthe external entities that provide data or
receive data from system being described;
2.list the data being sent to and from the
entities;
3.create a context diagram with the system in
the middle of the external entities sending
and receiving data flows;
33.
Creating a DFD
4.List the processing functions carried out in
the system;
5. Identify the data connections between
these processing functions;
6. Explode each process and repeat above
steps as needed.
34.
DFD Tipz
• Labelyour processes carefully. A process just
labelled "Produce Report" and has the output
of "Report" says little – what is the report
about?
• If you have trouble labelling anything on the
diagram, it may be because you don’t fully
understand what it does!
• Stick with it until a clear label is found.
35.
DFD Tipz
• Rule2 again - Ignore physical items like
people, products, trucks, cake ingredients
• Rule 4: Do not label processes as people (e.g.
“Secretary”).
• DFDs are not concerned with who does a
process, but what the process is.
• Besides, the secretary might have several
functions – tea maker, mail runner,
receptionist. Identify the process, not the
body.
36.
DFD Tipz
• Rule5 again: Time and place are not
important.
• It does not matter whether one data flow
occurs before or after another data flow, or in
which office it happens.
• Don’t worry about how or when a process
happens. It just happens!
37.
DFD Tipz
• Dataflows are pathways for data. Think about what
data is needed to perform a process or update a data
store.
• Rule 6: A DFD is not a flowchart and should not have
loops or transfer of control.
• Rule 7: Keep your DFD clear and easy to read –
avoid crowding or crossed data flow lines.
38.
DFD Tipz
• Donot try to put everything you know on the
DFD.
• The DFD should serve as an index and outline.
• Details are fleshed out in other places such as
the data dictionary, data structure diagrams,
flowcharts etc.
39.
EXAM DFD –SD 2006
A company, No Blots, supplies ink cartridges for printers which are sold
only through the internet.
When customers place an order, the order is checked, a confirmation is
sent back to the customer and the details of the order are sent to the
warehouse.
The diagram below shows the data flow diagram (DFD) for the No Blots
online purchasing system. The diagram does not show the data sources
and destinations.
a. In a DFD a circle represents a
process. Briefly explain what is
meant by a process. (1)
b. b. In the DFD, what do the
symbols labelled stock and
orders represent? (1)
40.
c. Complete thecontext diagram below for the No
Blots system. (3)
(The previous DFD is
here again so you can
refer to it)
Proceed only when you have worked
out your solution…
Acknowledgements
• Thanks toKenneth A. Kozar for DFD info at
• http://spot.colorado.edu/%7Ekozar/DFDtechnique.html
• Another great site (even if it does naughtily show material
flows as well as data flows)...
http://yourdon.com/strucanalysis/wiki/index.php?
title=Chapter_9
44.
IT APPLICATIONS SLIDESHOWS
ByMark Kelly
McKinnon Secondary College
vceit.com
These slideshows may be freely used, modified or distributed by teachers and students
anywhere on the planet (but not elsewhere).
They may NOT be sold.
They must NOT be redistributed if you modify them.