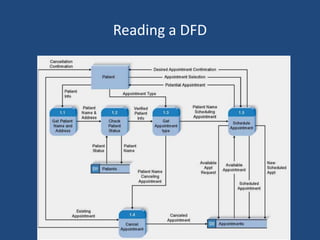
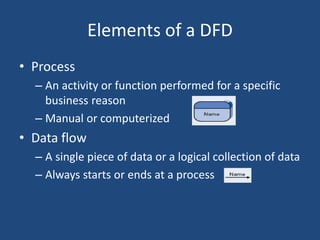
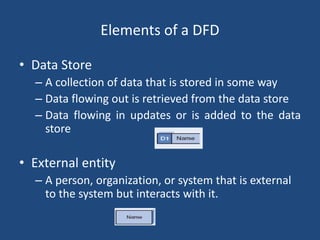
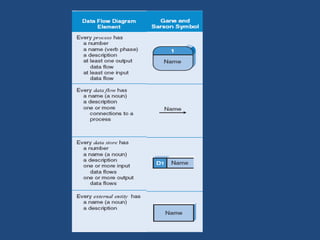
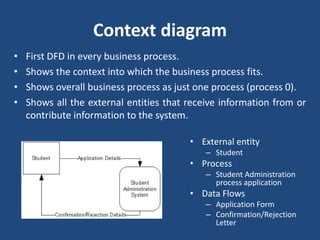
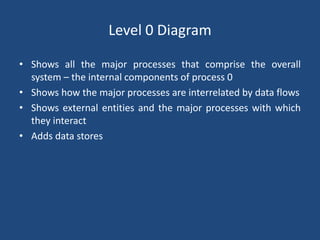
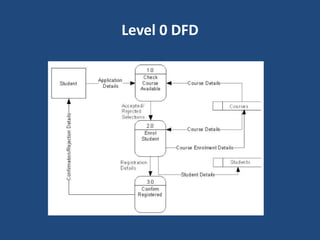

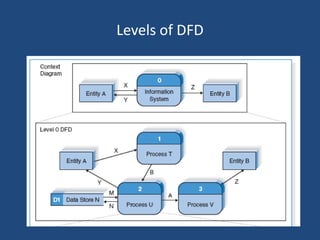
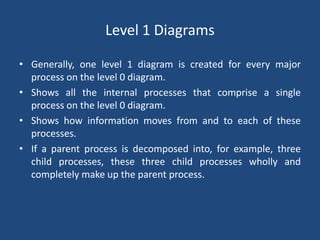
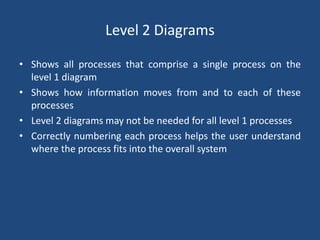

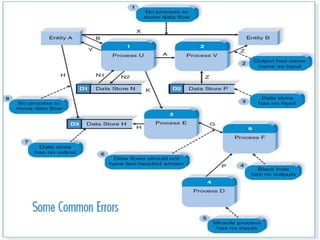

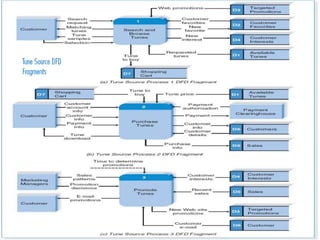
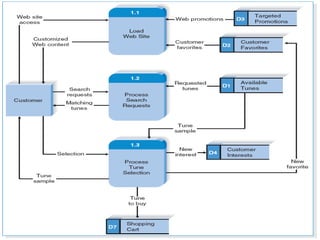
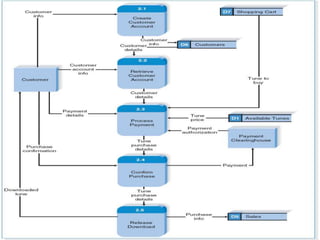
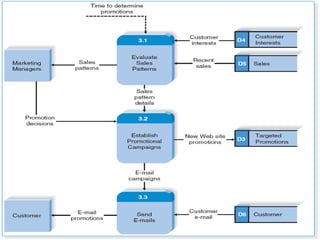

This document discusses data flow diagrams (DFDs) and their elements. It explains that a DFD visually shows how data moves through an information system by using graphical symbols like processes, data stores, external entities, and data flows. It provides examples of a context diagram showing one overall process and all external entities, as well as a level 0 diagram breaking that process into major sub-processes and showing data flows between them. The document also outlines how DFDs can be further decomposed into level 1, 2, and additional diagrams to show internal processes and data flows in more detail.