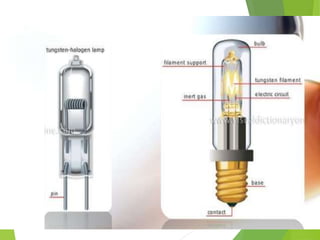
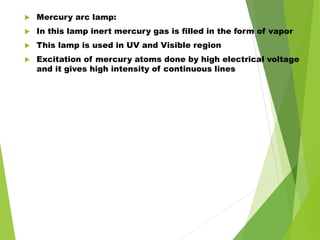
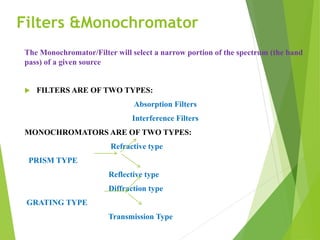
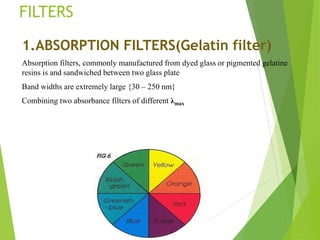
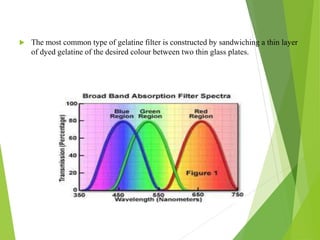
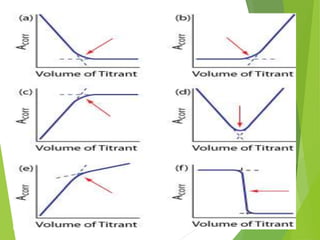
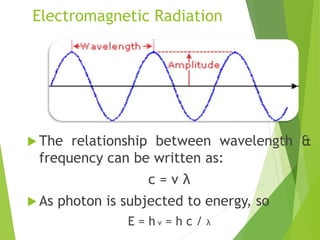
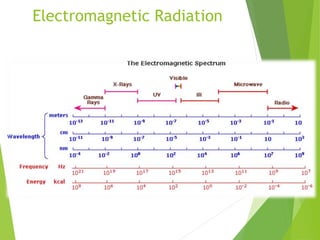
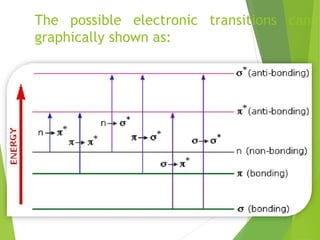
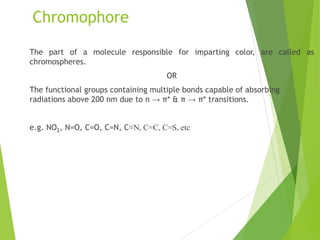
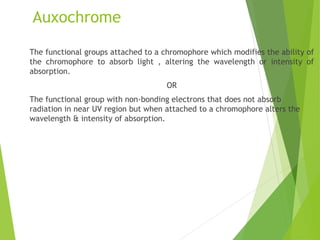
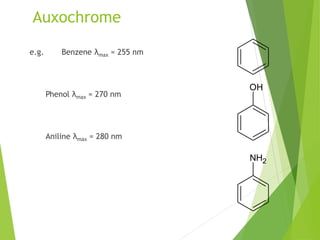
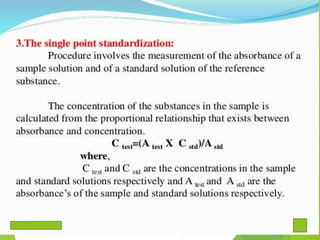
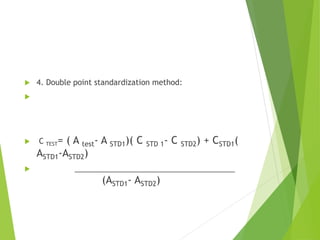
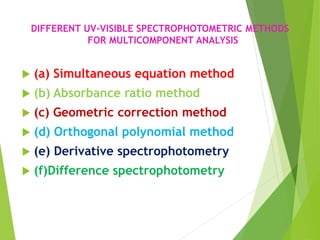
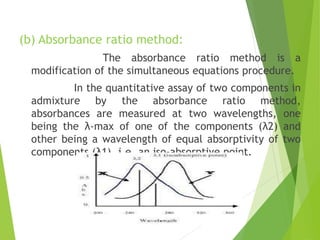
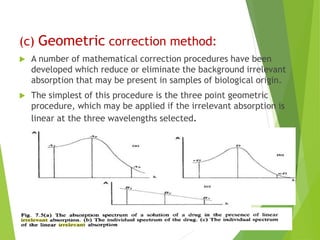
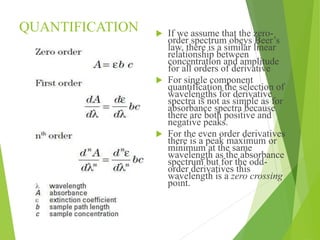
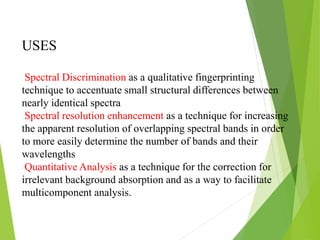
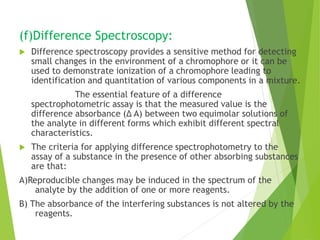
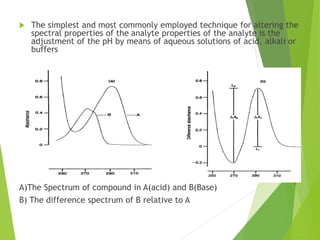
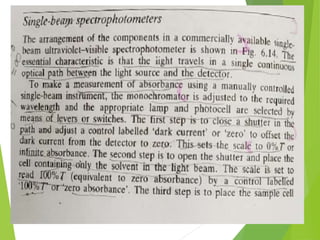
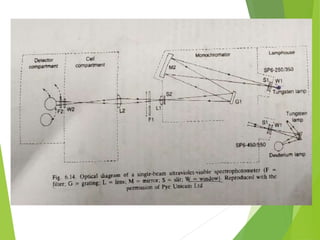
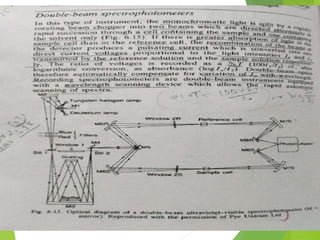
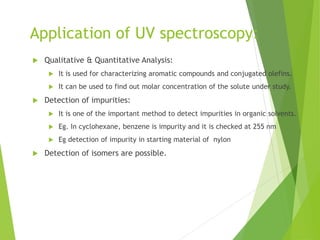
The document provides an extensive overview of UV/Visible spectroscopy, including principles, types of spectroscopy, electronic transitions, and the Beer-Lambert law. It discusses the concepts of absorbance shifts, instrumentation components, and methods for quantitative analysis of single and multi-component dosage forms. Key terms like chromophore and auxochrome, along with detailed methodologies for spectrophotometric analysis, are also covered.

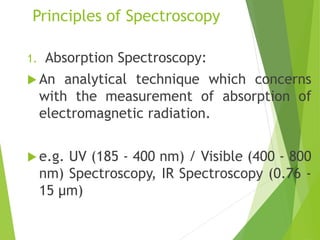


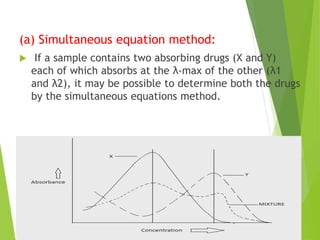
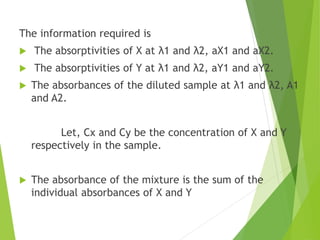
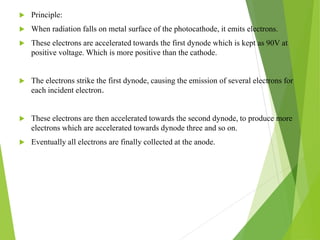
![ At λ1 A1 = aX1* Cx + aY1* Cy …………… (1)
At λ2 A2 = aX2* Cx + aY2* Cy…………....(2)
Now divide (2) with (1)
A2/A1 = (aX2* Cx + aY2* Cy)/(aX1* Cx + aY1* Cy)
Divide each term with (Cx + Cy)
A2/A1 = (aX2* Cx + aY2* Cy) / (Cx + Cy) (aX1* Cx + aY1* Cy) / (Cx + Cy)
Put Fx = Cx / (Cx + Cy) and Fy = Cy / (Cx + Cy)
A2/A1 = [aX2 Fx + aY2 Fy] / [aX1 Fx + aY1Fy]
Where Fx is the fraction of X and Fy is the fraction of Y i.e. Fy = 1-Fx
Therefore,
A2/A1 = [aX2 Fx + aY2 (1-Fx)] / [aX1 Fx + aY1(1-Fx)]
= [aX2 Fx + aY2 – aY2Fx] / [aX1 Fx + aY1 – aY1Fx]](https://image.slidesharecdn.com/uv-231023115545-eaeb86f3/85/UV-Visible-spectroscopy-64-320.jpg)
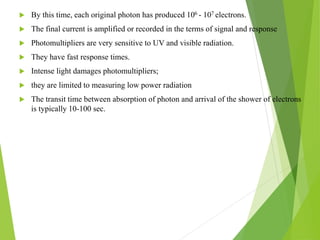
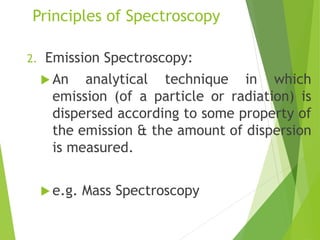
![At iso-absorptive point
aX1 = aY1 and Cx = Cy
There fore A2/A1 = [aX2 Fx + aY2 – aY2Fx] / aX1
= (aX2 Fx/ aX1) + (aY2/ aX1) –( aY2Fx/ aX1)
Let Qx = aX2/aX1 , Qy = aY2/aY1 and absorption ratio Qm = A2/A1
Qm = Fx (Qx-Qy) + Qy
Fx = (Qm – Qy) / (Qx – Qy) ………………………..(3)
From the equations (1) A1 = aX1 (Cx + Cy)
there fore Cx + Cy = A1 / aX1
There fore Cx = (A1/aX1) – Cy ……………………(4)
From the equation (3)
Cx / (Cx + Cy) = (Qm – Qy) / (Qx – Qy)
There fore Cx / (A1 / aX1) = (Qm – Qy) / (Qx – Qy)
There fore Cx = [(Qm – Qy) / (Qx – Qy)] X (A1 / aX1) …………(5)](https://image.slidesharecdn.com/uv-231023115545-eaeb86f3/85/UV-Visible-spectroscopy-65-320.jpg)

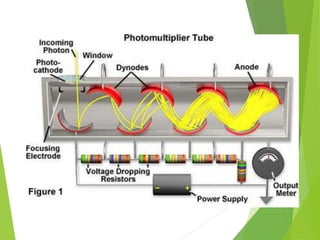
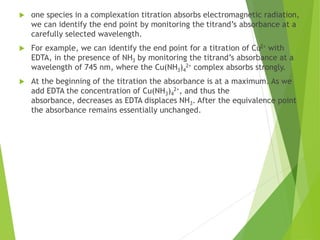
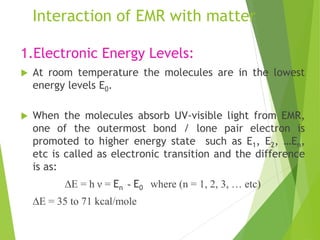
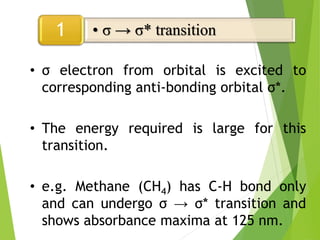
![ Dissociation constants of acids and bases.
PH = PKa + log [A-] / [HA]
From the above equation, the PKa value can be
calculated if the ratio of [A-] / [HA] is known at a
particular PH. and the ratio of [A-] / [HA] can be
determined spectrophotometrically from the graph
plotted between absorbance and wavelength at
different PH values.](https://image.slidesharecdn.com/uv-231023115545-eaeb86f3/85/UV-Visible-spectroscopy-92-320.jpg)