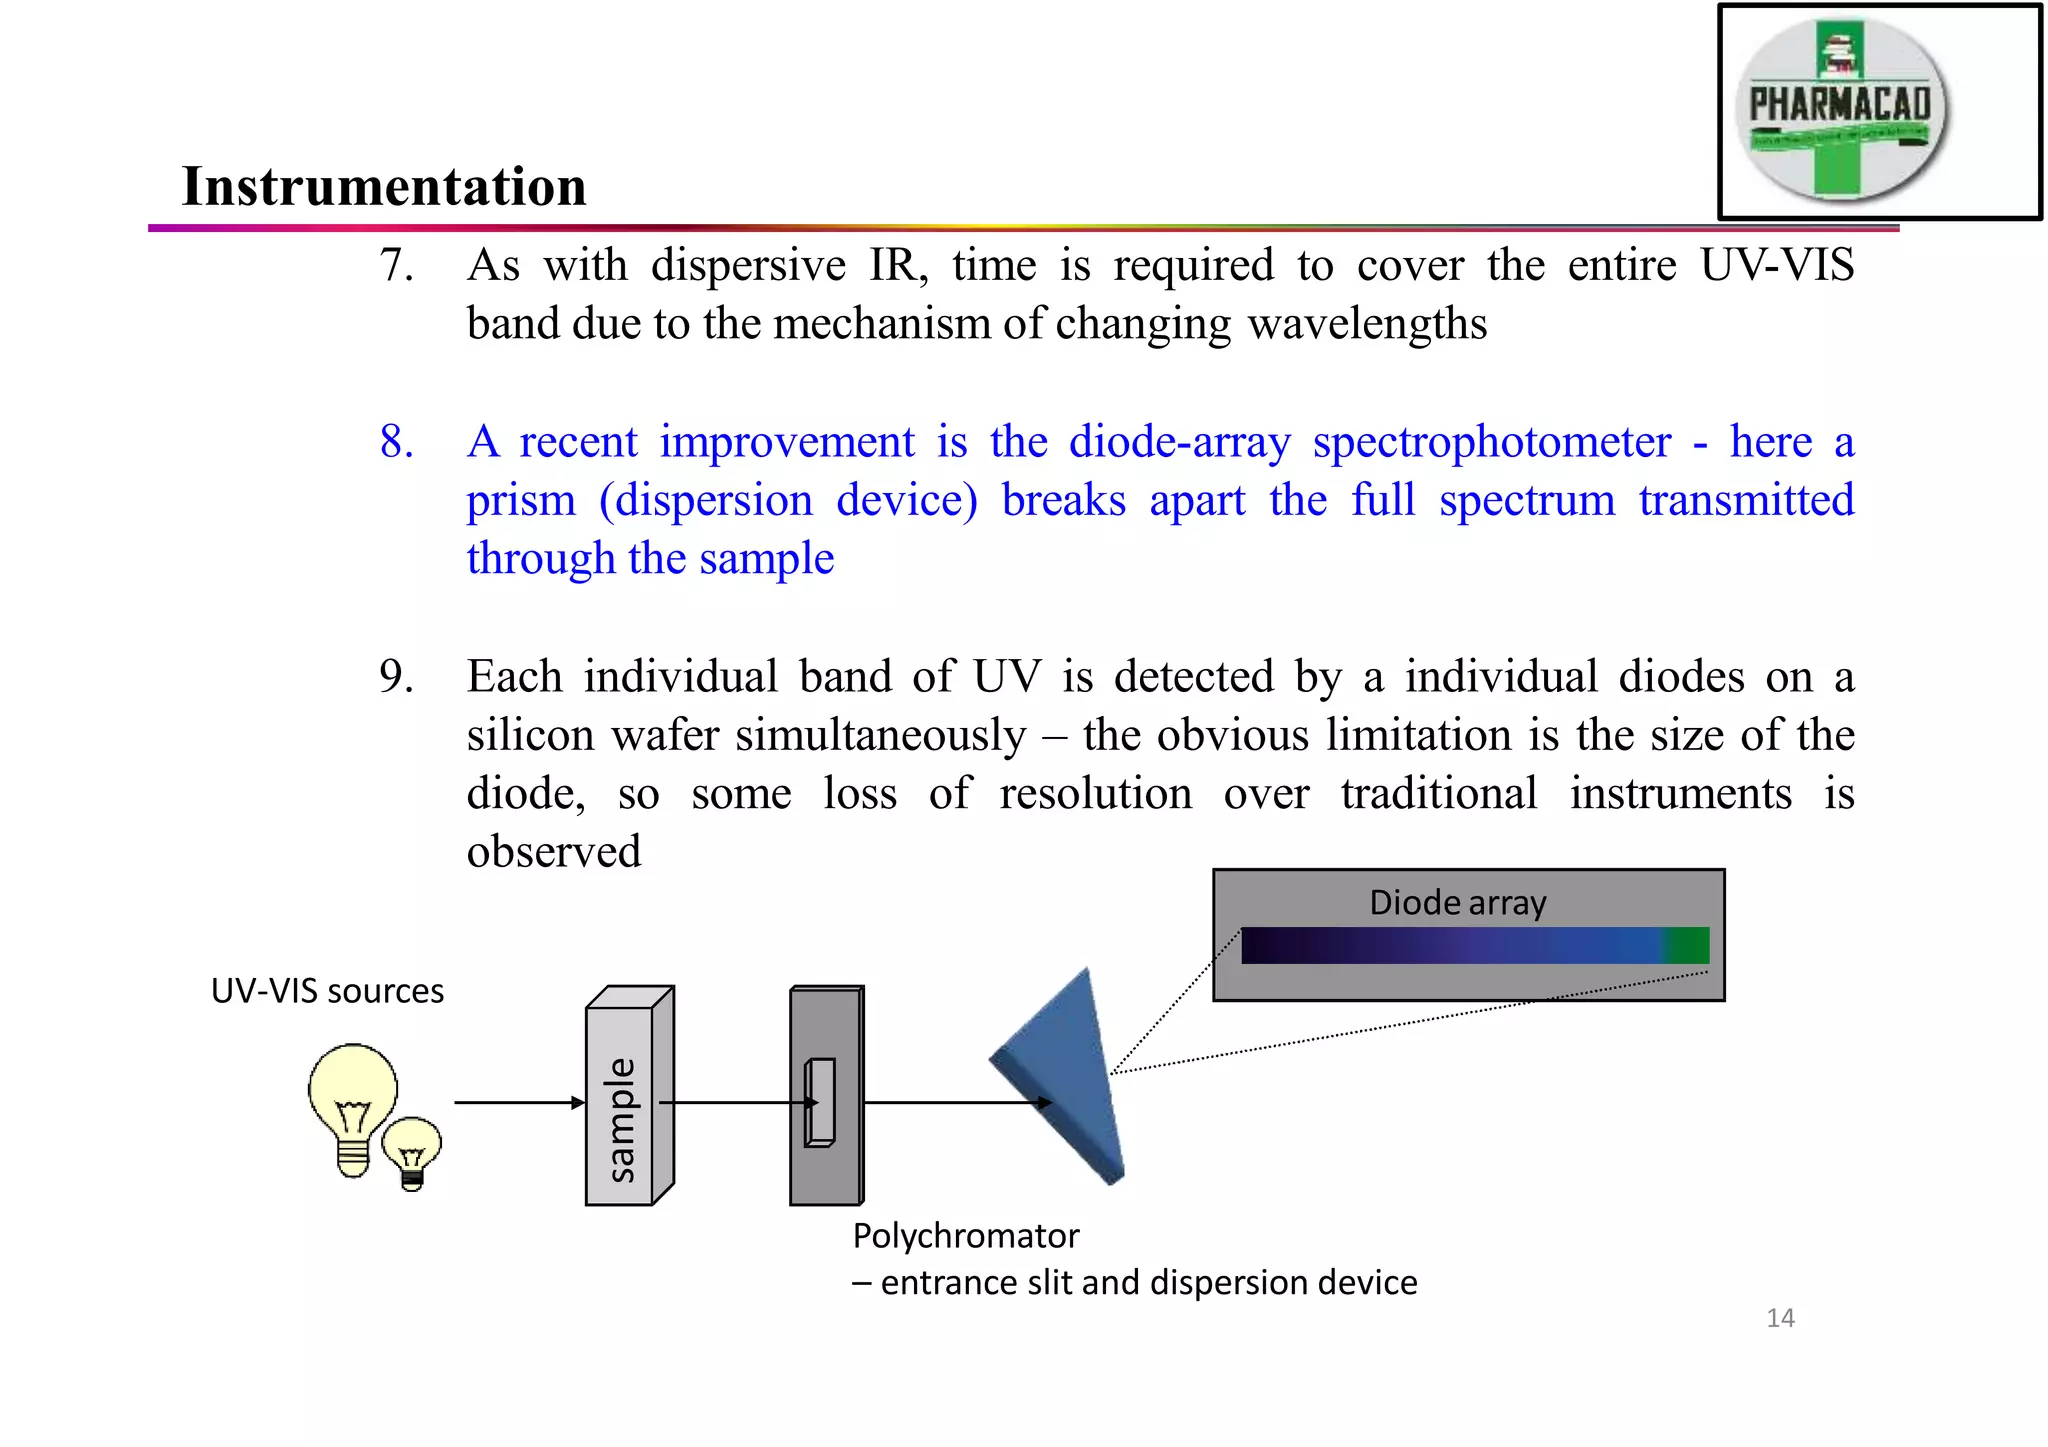
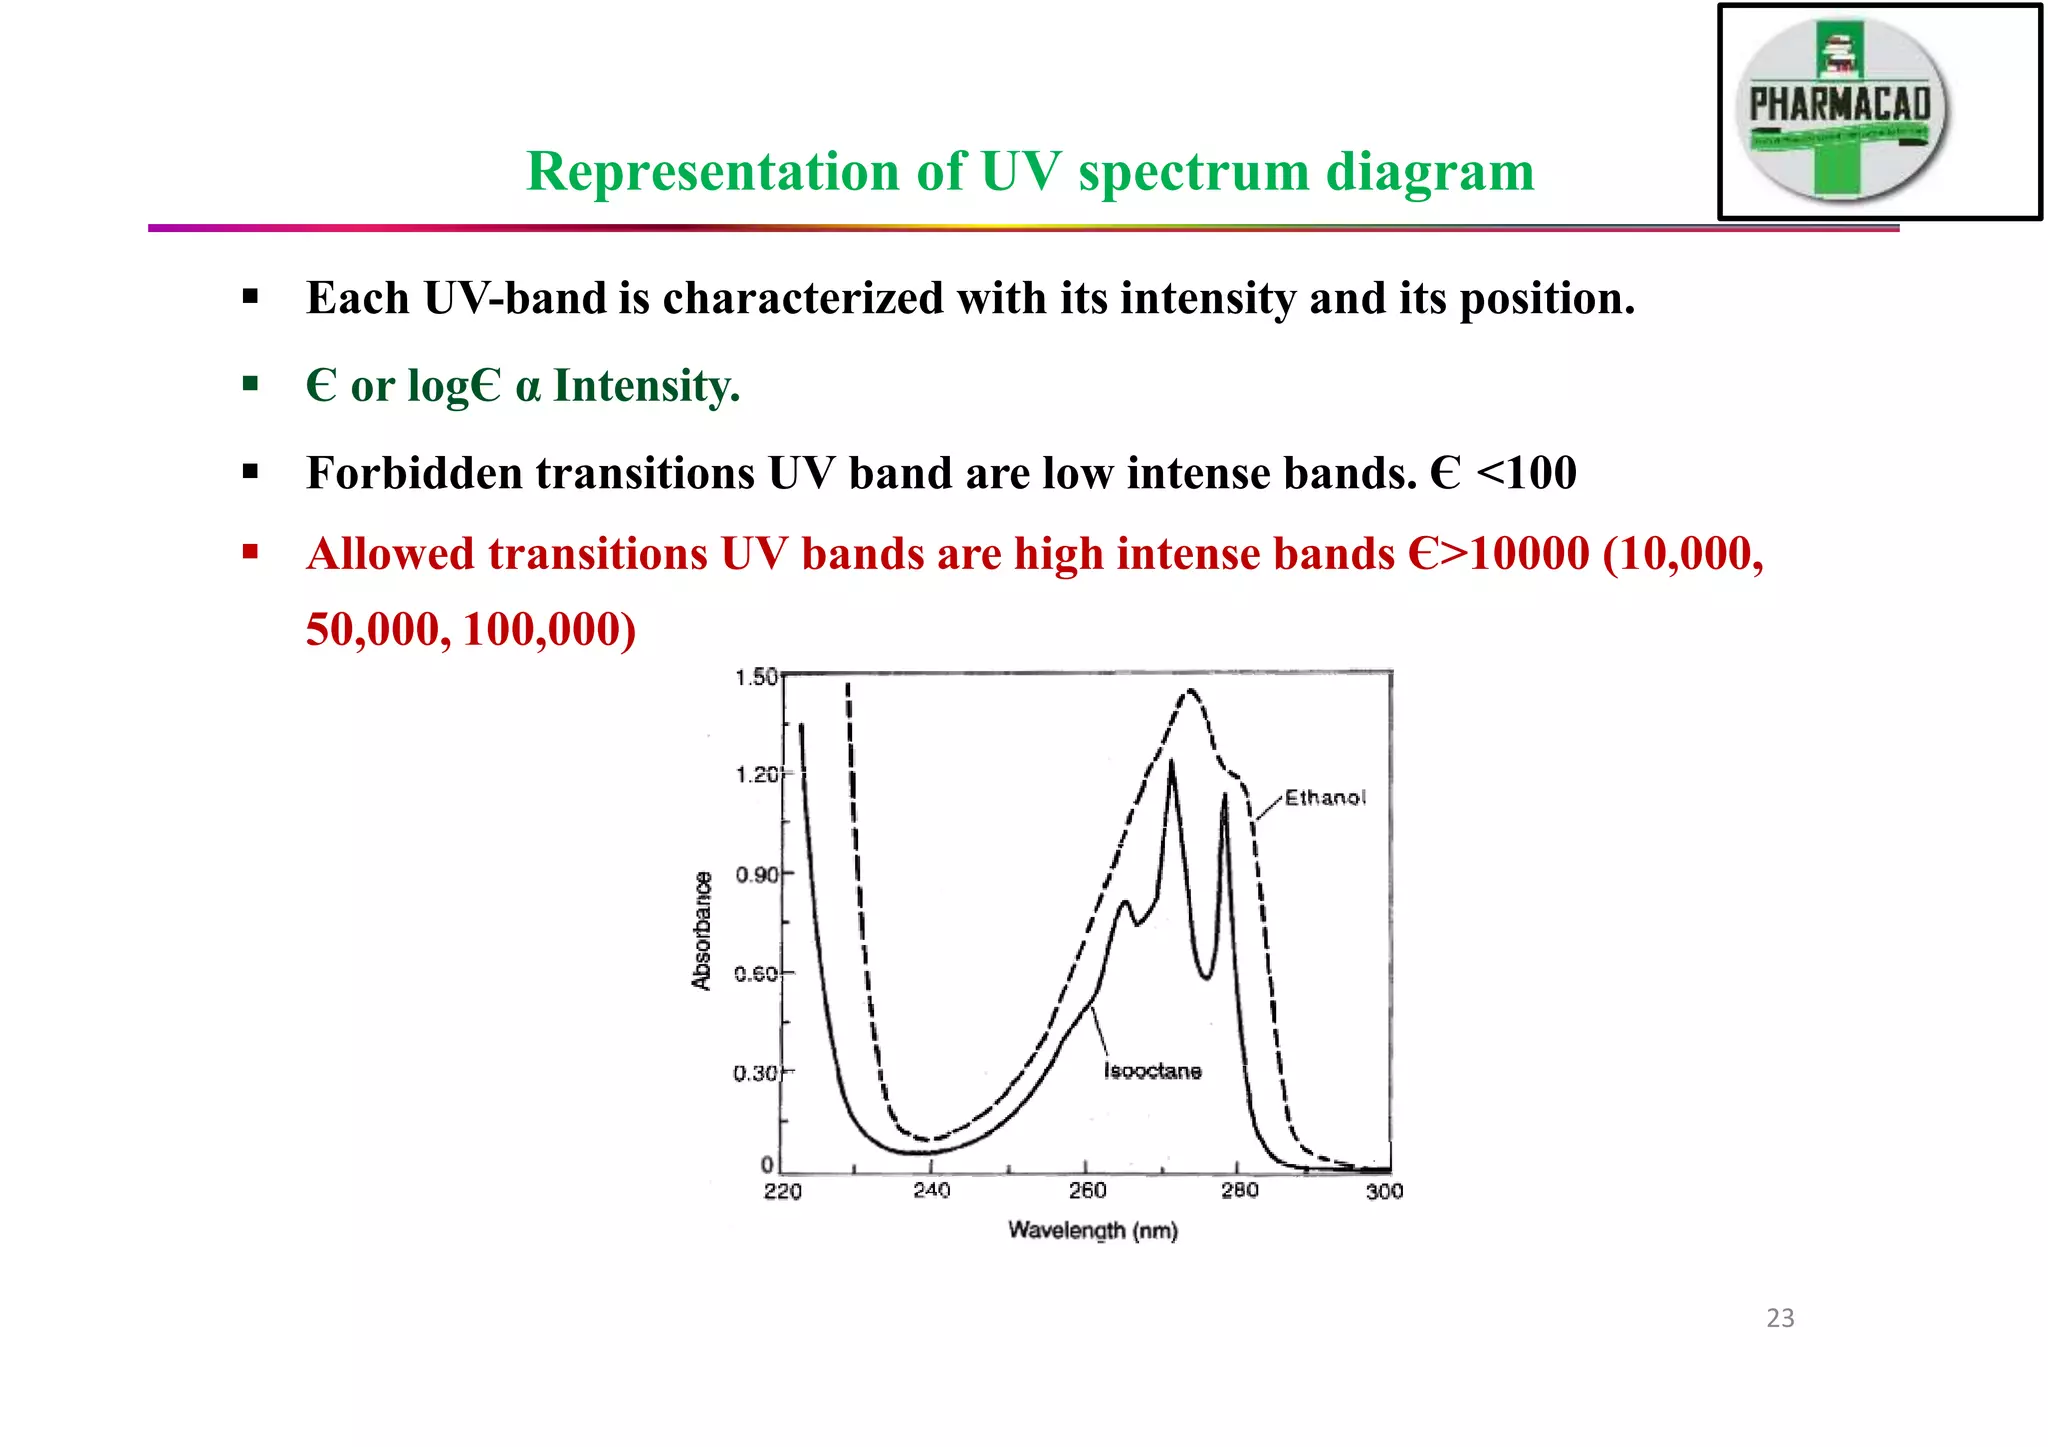
SlideShare a Scribd company logo
NIPER
1
PHARMACAD
NIPER
Introduction
 Spectroscopy is the tool for study of atomic & molecular structure.
 UV/visible spectroscopy is also called electronic spectroscopy because the
absorption spectra are a result of the behaviour of electrons in the target
molecules.
 It deals with interaction of electronic radiation with matter involving the
measurement & interpretation of the extension of absorption or emission of
EMR by molecule.
 It provides information about electronic properties of molecules
 Most important consequence of such interaction is the energy is absorbed or
emitted by the matter in discrete amount called as quanta.
2
NIPER
Introduction
 UV radiation starts at blue end of visible light (4000 Å) & ends at
2000 Å.
 It divided into two spectral region-
Near UV region- 2000Å – 4000Å.
Far UV region- below 2000 Å.
 UV-spectroscopy involved with electronic excitation.
3
NIPER
Introduction
 The difference in energy between molecular bonding, non-bonding
and anti-bonding orbitals ranges from 125–650 kJ/mole
 This energy corresponds to EM radiation in the ultraviolet (UV)
region, 200-400 nm, and visible (VIS) regions 400-800 nm of the
spectrum
4
Characteristics of UV-Vis spectra of Organic Molecules
 Absorb mostly in UV, unless highly conjugated system
 Spectra are broad, usually to broad for qualitative identification
purposes
 The most common detector for HPLC
Introduction
The Spectroscopic Process
 In UV spectroscopy, the sample is irradiated with the broad spectrum
of the UV radiation
 If a particular electronic transition matches the energy of a certain band
of UV, it will be absorbed
 The remaining UV light passes through the sample and is observed
 From this residual radiation a spectrum is obtained with “gaps” at these
discrete energies – this is called an absorption spectrum
NIPER
6
 According to MO concept when molecule irradiated with UV-VIS
radiation the transfer of electron takes place from HOMO level to
LUMO level (valency shell MO’s) .
 During these electron transfers, the molecule absorbs energy and
absorbed energy converted into UV-VIS peaks/ bands .
 The transfer of electrons from HOMO to LUMO (BMO-ABMO) is
called electronic excitations or transitions.
NIPER
Molecular Orbitals
7
Graphical Representation of MOs
Energy
s
n
Atomic orbital
Atomic orbital
s
Molecular orbitals
Occupied levels
Unoccupied levels
NIPER
8
NIPER
All possible excitations
1)
2)
3)
4)
5)
6)
*
*
*
*
n
n
*
*
Types of MOs
9
Observed electronic transitions
 From the molecular orbital diagram, there are several possible electronic
transitions that can occur, each of a different relative energy:
Energy
s
s
n
s
s
n
n
s
s
alkanes
carbonyls
unsaturated cmpds.
O, N, S, halogens
carbonyls
NIPER
10
Observed electronic transitions
 Special equipment to study vacuum or far UV is required
 Routine organic UV spectra are typically collected from 200-700 nm
 This limits the transitions that can be observed:
n
n
s s
s
s
carbonyls
alkanes 150 nm
carbonyls 170 nm
unsaturated cmpds.180 nm √ - if conjugated!
O, N, S, halogens 190 nm
300 nm √
Energy
11
NIPER
Instrumentation
sample
reference
detector
I0
I0 I0
I
1. The construction of a traditional UV-VIS spectrometer is very similar
to an IR, as similar functions – sample handling, irradiation, detection
and output are required
2. Here is a simple schematic that covers most modern UV
spectrometers:
log(I0/I) = A
200 700
,nm
monochromator/
beam splitter optics
UV-VIS sources
NIPER
12
Instrumentation
3. Two sources are required to scan the entire UV-VIS band:
 Deuterium lamp – covers the UV – 200–330
 Tungsten lamp – covers 330–700
4. As with the dispersive IR, the lamps illuminate the entire band of UV
or visible light; the monochromator (grating or prism) gradually
changes the small bands of radiation sent to the beam splitter
5. The beam splitter sends a separate band to a cell containing the
sample solution and a reference solution
6. The detector measures the difference between the transmitted light
through the sample (I) vs. the incident light (I0) and sends this
information to the recorder
NIPER
13
Instrumentation
sample
Polychromator
– entrance slit and dispersion device
7. As with dispersive IR, time is required to cover the entire UV-VIS
band due to the mechanism of changing wavelengths
8. A recent improvement is the diode-array spectrophotometer - here a
prism (dispersion device) breaks apart the full spectrum transmitted
through the sample
9. Each individual band of UV is detected by a individual diodes on a
silicon wafer simultaneously – the obvious limitation is the size of the
diode, so some loss of resolution over traditional instruments is
observed
Diode array
UV-VIS sources
NIPER
14
Instrumentation
Instrumentation – Sample Handling
1. Virtually all UV spectra are recorded solution-phase
2. Cells can be made of plastic, glass or quartz
3. Only quartz is transparent in the full 200-700 nm range; plastic and
glass are only suitable for visible spectra
4.Concentration (we will cover shortly) is empirically determined A
typical sample cell (commonly called a cuvet):
NIPER
15
Instrumentation
Instrumentation – Sample Handling
5. Solvents must be transparent in the region to be observed; the
wavelength where a solvent is no longer transparent is referred to as
the cutoff
6. Since spectra are only obtained up to 200 nm, solvents typically only
need to lack conjugated π systems or carbonyls
Common solvents and cutoffs:
acetonitrile 190
chloroform 240
cyclohexane 195
1,4-dioxane 215
95% ethanol 205
n-hexane 201
methanol 205
isooctane 195
water 190
NIPER
16
Instrumentation and Spectra
Instrumentation – Sample Handling
7. Additionally solvents must preserve the fine structure (where it is
actually observed in UV!) where possible
8. H-bonding further complicates the effect of vibrational and rotational
energy levels on electronic transitions.
9. The more non-polar the solvent, the better (this is not always possible)
NIPER
17
 Transitions are faster due to parallel
arrangement of π and π* orbital's.
 Interactions / overlapping is more
irrespective of energy gap.
 Transitions slow due to
perpendicular arrangement of
n and π* orbitals.
 These transitions may be due to
vibrations or twisting of the
bonds.
NIPER
 Allowed excitations are more probable and faster
 Forbidden excitations (less probable)
Electronic Excitations
18
*** Selection Rules
 Not all transitions that are possible are observed
 For an electron to transition, certain quantum mechanical constraints
apply – these are called “selection rules”
 For example, an electron cannot change its spin quantum number
during a transition – these are “forbidden”
Other examples include:
 the number of electrons that can be excited at one time
 symmetry properties of the molecule
 symmetry of the electronic states
 To further complicate matters, “forbidden” transitions are sometimes
observed (albeit at low intensity) due to other factors
NIPER
19
*** Selection Rules
1) The symmetry allowed excitations are high probable excitations.
Ex: π—π*
2) Symmetry forbidden excitations are low probable excitations
Ex: n—π*
3) Excitations can takes place among BMO to ABMO and NBMO to
ABMO’S.
4) During electronic transition spin inversion is forbidden.
NIPER
20
5) During electronic transitions change in multiplicity is forbidden.
NIPER
*** Selection Rules
21
6) Change in position of nuclei of bond during electronic transition is forbidden
(Frank Condon Principle).
(There is no change in the internuclear distance of the molecule during the
excitation process. This is known as “Franck-Condon principle”.)
NIPER
*** Selection Rules
22
Representation of UV spectrum diagram
 Each UV-band is characterized with its intensity and its position.
 Є or logЄ α Intensity.
 Forbidden transitions UV band are low intense bands. Є <100
 Allowed transitions UV bands are high intense bands Є>10000 (10,000,
50,000, 100,000)
NIPER
23
Є = Molar absorptivity or Molar extension coefficient FromBeer’s-
Lamberts law
A = Є. c. l
Where A = Absorbance ( no units)
c = concentration (moles/lit)
l = length of solution or thickness of sol. or length of the tube/cell
NIPER
Representation of UV spectrum diagram
24
Q: Certain sample solutions concentration is 0.001 gms/100 ml. M.Wt is 424,
l = 1 cm, A = 0. 3025. Calculate Є ?
NIPER
Problems
25
Q: For a solution of camphor in hexane in a 10 cm cell absorbance at 295 nm
was found to be 2.52. What is the concentration of Camphor ? Molar
extenction coefficient is 14.
NIPER
Problems
26
Important Terms
200 to 800 nm
• a) Chromophore:-
• Any group which is absorbing energy from UV-VIS range of radiation
called as Chromophore.
• b)Auxochrome:-
• The group which can not absorb radiation 200 to 800 nm range is the
auxochrome. Auxochrome shift UV band towards higher λ side (right). It
is called Bathochromic shift .
• Ex:- lone pair electron groups and –Ve charged groups.
NIPER
27
• c) Bathochromic Shift:-
• Movement of UV peak towards higher λ side (right side ) is called the
Bathochromic shift (red shift).
• d) Hypsochromic shift:-
• Movement of UV peak or band towards lower λ side (left side) is the
Hypsochromic shift (Blue Shift).
• e) Hyperchromic shift :-
• Increase in intensity of UV peak is hyperchromic shift (more Є or logЄ value)
• f) Hypochromic shift:-
• Decrease in intensity of UV peak of band (lower Є or logЄ value).
NIPER
Important Terms
28
Absorption & Intensity Shifts
NIPER
29
30
Theoretical prediction of λmax of conjugated π-system
 ***Woodward – fieser rules (Empirical rules)
 Eg: 1,3-butadiene system, c=c-c=c
 Parent acyclic diene 217 nm (base values, π-π*)
 Parent hetero annular diene 215 nm ( ,, )
 Parent homo annular dienes 253 nm ( ,, )
 Increments for the substituents
1) Alkyl group or ring residues +5
2) For each exocyclic double bond +5
3)
4)
5)
Double bond with extending conjugation +30
On diene if halogen present +5
On diene if alkoxy group present +6
NIPER
Limitation:-
 These rules are valid for unsaturated system which is having less than four
double bonds in conjugation.
 1)Acyclic C=C-C=C 217 nm
 2) Hetero annular (two double bonds not in the same ring)
 3) Homo annular (two double bonds with conjugation in same ring system)
 4) If in the same molecule homo and hetero dienes present, homo diene is
the base value (higher value)
NIPER
31
Q: Calculate the Absorption Maximum?
NIPER
32
Q: Calculate the Absorption Maximum? NIPER
33
Q: Calculate the Absorption Maximum? NIPER
34
Applications of UV-Visible Spectroscopy
35
36
Why should we learn this stuff?
After all, nobody solves structures with UV any longer!
 Many organic molecules have chromophores that absorb UV
 UV absorbance is about 1000 x easier to detect per mole than NMR
 Still used in following reactions where the chromophore changes. Useful
because timescale is so fast, and sensitivity so high. Kinetics, esp. in
biochemistry, enzymology.
 Most quantitative Analytical chemistry in organic chemistry is conducted
using HPLC with UV detectors
 One wavelength may not be the best for all compound in a mixture.
 Affects quantitative interpretation of HPLC peak heights
37
Practical Applications
• Pharmacy Practice
– Ultraquin (psoriasis med. Needs UV.Act.
– Pregnancy tests (colorimetric assays)
– Blood glucose tests, Bilichek
– ELISA’s
• Pharmaceutics
– pH titrations, purity measurement
– concentration measurement
38
Pharmaceutical Applications
 On Line Analysis of Vitamin A and Coloring Dyes for the Pharmaceutical
Industry
 Determination of Urinary Total Protein Output
 Analysis of total barbiturates
 Comparison of two physical light blocking agents for sunscreen lotions
 Determination of acetylsalicylic acid in aspirin using Total Fluorescence
Spectroscopy
 Automated determination of the uniformity of dosage in Quinine Sulfate
tablets using a Fibre Optics Autosampler
 Determining Cytochrome P450 by UV-Vis Spectrophotometry
 Light Transmittance of Plastic Pharmaceutical Containers
Applications of UV-Visible Spectroscopy
39
 Detection of functional groups
 Estimation of extent of conjugation
 Distinction in conjugated and non-conjugated compounds
 Identification of an unknown compound
 Examination of Polynuclear hydrocarbons
 Elucidation of the structure of Vitamins A and K
 Preference over two tautomeric forms
 Identification of compound in different solvents
 Determination of configurations of Geometrical isomers
 Distinguishes between Equatorial and Axial conformations
 Determination of strength of H-bonding
 Hindered rotation and conformational analysis
40
UV vs. IR vs. NMR
 UV has broad peaks relative to IR & NMR
 UV has less information than IR & NMR
 UV spectra are easier to collect
 UV spectra are faster to collect
 UV spectrometers are cheaper
 UV spectra require only nanograms of material or chemicals
41

More Related Content

What's hot

Infrared spectroscopy
Infrared spectroscopyInfrared spectroscopy
Infrared spectroscopy
Asma Ashraf
 
Instrumentation of uv spectroscopy
Instrumentation of uv spectroscopyInstrumentation of uv spectroscopy
Instrumentation of uv spectroscopy
Arabinda Changmai
 
INSTRUMENTATION OF UV-VISIBLE SPECTROPHOTOMETRY
INSTRUMENTATION OF UV-VISIBLE SPECTROPHOTOMETRYINSTRUMENTATION OF UV-VISIBLE SPECTROPHOTOMETRY
INSTRUMENTATION OF UV-VISIBLE SPECTROPHOTOMETRY
Ashwini Somayaji
 
NMR SPECTROSCOPY
NMR SPECTROSCOPYNMR SPECTROSCOPY
NMR SPECTROSCOPY
VidyaNani
 
uv spectroscopy by HARVINDAR SINGH .M.PHARM PHARMACEUTICS
 uv spectroscopy by HARVINDAR SINGH .M.PHARM PHARMACEUTICS uv spectroscopy by HARVINDAR SINGH .M.PHARM PHARMACEUTICS
uv spectroscopy by HARVINDAR SINGH .M.PHARM PHARMACEUTICS
Harevindarsingh
 
IR interpretation and sample handling
 IR interpretation and sample handling  IR interpretation and sample handling
IR interpretation and sample handling
Afzaye Rasul
 
GEL CHROMATOGRAPHY
GEL CHROMATOGRAPHYGEL CHROMATOGRAPHY
Quenching of Fluorescence
Quenching of FluorescenceQuenching of Fluorescence
Quenching of Fluorescence
Fatema Zohora
 
Solvents and solvent effect in UV - Vis Spectroscopy, By Dr. Umesh Kumar sh...
Solvents and  solvent effect in UV -  Vis Spectroscopy, By Dr. Umesh Kumar sh...Solvents and  solvent effect in UV -  Vis Spectroscopy, By Dr. Umesh Kumar sh...
Solvents and solvent effect in UV - Vis Spectroscopy, By Dr. Umesh Kumar sh...
Dr. UMESH KUMAR SHARMA
 
Thermal detectors of ir
Thermal detectors of irThermal detectors of ir
Thermal detectors of irSampath Kumar
 
Chemical Shift & Factors Affecting Chemical Shift
Chemical Shift & Factors Affecting Chemical ShiftChemical Shift & Factors Affecting Chemical Shift
Chemical Shift & Factors Affecting Chemical Shift
Keshav Singh
 
FACTORS INFLUENCING FLUORESCENCE INTENSITY
FACTORS INFLUENCING FLUORESCENCE INTENSITYFACTORS INFLUENCING FLUORESCENCE INTENSITY
FACTORS INFLUENCING FLUORESCENCE INTENSITY
aishuanju
 
Various factor affecting vibrational frequency in IR spectroscopy.
Various factor affecting vibrational frequency in IR spectroscopy.Various factor affecting vibrational frequency in IR spectroscopy.
Various factor affecting vibrational frequency in IR spectroscopy.
vishvajitsinh Bhati
 
BIOISOSTERSM
BIOISOSTERSMBIOISOSTERSM
BIOISOSTERSM
Tuba Khan
 
IR - Spectroscopy, theory, modes of vibration and sample handling. by Dr. Ume...
IR - Spectroscopy, theory, modes of vibration and sample handling. by Dr. Ume...IR - Spectroscopy, theory, modes of vibration and sample handling. by Dr. Ume...
IR - Spectroscopy, theory, modes of vibration and sample handling. by Dr. Ume...
Dr. UMESH KUMAR SHARMA
 
Uv visible-spectroscopy
Uv visible-spectroscopy Uv visible-spectroscopy
Uv visible-spectroscopy
Protik Biswas
 
Instrumentation of IR spectroscopy
Instrumentation of IR spectroscopyInstrumentation of IR spectroscopy
Instrumentation of IR spectroscopy
Talha Liaqat
 
SAR of Morphine
SAR of MorphineSAR of Morphine
SAR of Morphine
Nabiilah Naraino Majie
 
Effect of solvent
Effect of solventEffect of solvent
Effect of solvent
Mahendra G S
 

What's hot (20)

Infrared spectroscopy
Infrared spectroscopyInfrared spectroscopy
Infrared spectroscopy
 
Instrumentation of uv spectroscopy
Instrumentation of uv spectroscopyInstrumentation of uv spectroscopy
Instrumentation of uv spectroscopy
 
INSTRUMENTATION OF UV-VISIBLE SPECTROPHOTOMETRY
INSTRUMENTATION OF UV-VISIBLE SPECTROPHOTOMETRYINSTRUMENTATION OF UV-VISIBLE SPECTROPHOTOMETRY
INSTRUMENTATION OF UV-VISIBLE SPECTROPHOTOMETRY
 
NMR SPECTROSCOPY
NMR SPECTROSCOPYNMR SPECTROSCOPY
NMR SPECTROSCOPY
 
Fluorimetry
FluorimetryFluorimetry
Fluorimetry
 
uv spectroscopy by HARVINDAR SINGH .M.PHARM PHARMACEUTICS
 uv spectroscopy by HARVINDAR SINGH .M.PHARM PHARMACEUTICS uv spectroscopy by HARVINDAR SINGH .M.PHARM PHARMACEUTICS
uv spectroscopy by HARVINDAR SINGH .M.PHARM PHARMACEUTICS
 
IR interpretation and sample handling
 IR interpretation and sample handling  IR interpretation and sample handling
IR interpretation and sample handling
 
GEL CHROMATOGRAPHY
GEL CHROMATOGRAPHYGEL CHROMATOGRAPHY
GEL CHROMATOGRAPHY
 
Quenching of Fluorescence
Quenching of FluorescenceQuenching of Fluorescence
Quenching of Fluorescence
 
Solvents and solvent effect in UV - Vis Spectroscopy, By Dr. Umesh Kumar sh...
Solvents and  solvent effect in UV -  Vis Spectroscopy, By Dr. Umesh Kumar sh...Solvents and  solvent effect in UV -  Vis Spectroscopy, By Dr. Umesh Kumar sh...
Solvents and solvent effect in UV - Vis Spectroscopy, By Dr. Umesh Kumar sh...
 
Thermal detectors of ir
Thermal detectors of irThermal detectors of ir
Thermal detectors of ir
 
Chemical Shift & Factors Affecting Chemical Shift
Chemical Shift & Factors Affecting Chemical ShiftChemical Shift & Factors Affecting Chemical Shift
Chemical Shift & Factors Affecting Chemical Shift
 
FACTORS INFLUENCING FLUORESCENCE INTENSITY
FACTORS INFLUENCING FLUORESCENCE INTENSITYFACTORS INFLUENCING FLUORESCENCE INTENSITY
FACTORS INFLUENCING FLUORESCENCE INTENSITY
 
Various factor affecting vibrational frequency in IR spectroscopy.
Various factor affecting vibrational frequency in IR spectroscopy.Various factor affecting vibrational frequency in IR spectroscopy.
Various factor affecting vibrational frequency in IR spectroscopy.
 
BIOISOSTERSM
BIOISOSTERSMBIOISOSTERSM
BIOISOSTERSM
 
IR - Spectroscopy, theory, modes of vibration and sample handling. by Dr. Ume...
IR - Spectroscopy, theory, modes of vibration and sample handling. by Dr. Ume...IR - Spectroscopy, theory, modes of vibration and sample handling. by Dr. Ume...
IR - Spectroscopy, theory, modes of vibration and sample handling. by Dr. Ume...
 
Uv visible-spectroscopy
Uv visible-spectroscopy Uv visible-spectroscopy
Uv visible-spectroscopy
 
Instrumentation of IR spectroscopy
Instrumentation of IR spectroscopyInstrumentation of IR spectroscopy
Instrumentation of IR spectroscopy
 
SAR of Morphine
SAR of MorphineSAR of Morphine
SAR of Morphine
 
Effect of solvent
Effect of solventEffect of solvent
Effect of solvent
 

Similar to UV Spectroscopy- Pharmaceutical Analysis

Ultra violet (UV) spectroscopy, introduction,principle instrumentation,differ...
Ultra violet (UV) spectroscopy, introduction,principle instrumentation,differ...Ultra violet (UV) spectroscopy, introduction,principle instrumentation,differ...
Ultra violet (UV) spectroscopy, introduction,principle instrumentation,differ...
mariomS7
 
Uv spectroscopy
Uv spectroscopyUv spectroscopy
Uv spectroscopy
Zainab&Sons
 
UV Spectroscopy
UV SpectroscopyUV Spectroscopy
UV Spectroscopy
Ashwani Dhingra
 
Uv visible spectroscopy
Uv visible spectroscopyUv visible spectroscopy
Uv visible spectroscopy
Narjis Shahid
 
Uv spectroscopy (Collected)
Uv spectroscopy (Collected)Uv spectroscopy (Collected)
Uv spectroscopy (Collected)
Istiqur Rahman
 
UV Spectroscopy
UV Spectroscopy UV Spectroscopy
UV Spectroscopy
Adnan Sohail Akhtar
 
Uvspectroscopyup 140119003106-phpapp01
Uvspectroscopyup 140119003106-phpapp01Uvspectroscopyup 140119003106-phpapp01
Uvspectroscopyup 140119003106-phpapp01
Shaik Imran
 
Uv-vis Spectroscopy
Uv-vis SpectroscopyUv-vis Spectroscopy
Uv-vis Spectroscopy
subramanian Subramanian
 
Uvspectroscopyup
UvspectroscopyupUvspectroscopyup
Uvspectroscopyup
Naveed Ahmed
 
Ultraviolet and visible spectrophotometer and Its application in pharmaceutic...
Ultraviolet and visible spectrophotometer and Its application in pharmaceutic...Ultraviolet and visible spectrophotometer and Its application in pharmaceutic...
Ultraviolet and visible spectrophotometer and Its application in pharmaceutic...
nikhil kadam
 
Spectroscopy of uv visible
Spectroscopy of uv visibleSpectroscopy of uv visible
Spectroscopy of uv visible
Bahauddin Zakariya University lahore
 
Chapter 1 ultraviolet Spectroscopy 1.pdf
Chapter 1 ultraviolet Spectroscopy 1.pdfChapter 1 ultraviolet Spectroscopy 1.pdf
Chapter 1 ultraviolet Spectroscopy 1.pdf
hend49
 
UV-Vis spectroscopy description note.ppt
UV-Vis spectroscopy description note.pptUV-Vis spectroscopy description note.ppt
UV-Vis spectroscopy description note.ppt
itelitel
 
UV ppt for m sc i (SPPU)
UV ppt for m sc i (SPPU)UV ppt for m sc i (SPPU)
UV ppt for m sc i (SPPU)
siraj174
 
Visible and ultraviolet spectroscopy
Visible and ultraviolet spectroscopyVisible and ultraviolet spectroscopy
Visible and ultraviolet spectroscopy
Rawat DA Greatt
 
Uv visible spectroscopy
Uv visible spectroscopyUv visible spectroscopy
Uv visible spectroscopy
gracepaulraj
 
Unit 5 Spectroscopic Techniques-converted (1) (1).pdf
Unit 5 Spectroscopic Techniques-converted (1) (1).pdfUnit 5 Spectroscopic Techniques-converted (1) (1).pdf
Unit 5 Spectroscopic Techniques-converted (1) (1).pdf
SurajShinde558909
 
UV visible spectroscopy
UV visible spectroscopyUV visible spectroscopy
UV visible spectroscopy
Akshay Patil
 
Uv – visible spectroscopy .
Uv – visible spectroscopy .Uv – visible spectroscopy .
Uv – visible spectroscopy .
selva446
 

Similar to UV Spectroscopy- Pharmaceutical Analysis (20)

Ultra violet (UV) spectroscopy, introduction,principle instrumentation,differ...
Ultra violet (UV) spectroscopy, introduction,principle instrumentation,differ...Ultra violet (UV) spectroscopy, introduction,principle instrumentation,differ...
Ultra violet (UV) spectroscopy, introduction,principle instrumentation,differ...
 
Uv spectroscopy
Uv spectroscopyUv spectroscopy
Uv spectroscopy
 
UV Spectroscopy
UV SpectroscopyUV Spectroscopy
UV Spectroscopy
 
Uv visible spectroscopy
Uv visible spectroscopyUv visible spectroscopy
Uv visible spectroscopy
 
Uv spectroscopy (Collected)
Uv spectroscopy (Collected)Uv spectroscopy (Collected)
Uv spectroscopy (Collected)
 
UV Spectroscopy
UV Spectroscopy UV Spectroscopy
UV Spectroscopy
 
Uvspectroscopyup 140119003106-phpapp01
Uvspectroscopyup 140119003106-phpapp01Uvspectroscopyup 140119003106-phpapp01
Uvspectroscopyup 140119003106-phpapp01
 
Uv-vis Spectroscopy
Uv-vis SpectroscopyUv-vis Spectroscopy
Uv-vis Spectroscopy
 
Uvspectroscopyup
UvspectroscopyupUvspectroscopyup
Uvspectroscopyup
 
Ultraviolet and visible spectrophotometer and Its application in pharmaceutic...
Ultraviolet and visible spectrophotometer and Its application in pharmaceutic...Ultraviolet and visible spectrophotometer and Its application in pharmaceutic...
Ultraviolet and visible spectrophotometer and Its application in pharmaceutic...
 
Spectroscopy of uv visible
Spectroscopy of uv visibleSpectroscopy of uv visible
Spectroscopy of uv visible
 
Chapter 1 ultraviolet Spectroscopy 1.pdf
Chapter 1 ultraviolet Spectroscopy 1.pdfChapter 1 ultraviolet Spectroscopy 1.pdf
Chapter 1 ultraviolet Spectroscopy 1.pdf
 
UV-Vis spectroscopy description note.ppt
UV-Vis spectroscopy description note.pptUV-Vis spectroscopy description note.ppt
UV-Vis spectroscopy description note.ppt
 
UV ppt for m sc i (SPPU)
UV ppt for m sc i (SPPU)UV ppt for m sc i (SPPU)
UV ppt for m sc i (SPPU)
 
Visible and ultraviolet spectroscopy
Visible and ultraviolet spectroscopyVisible and ultraviolet spectroscopy
Visible and ultraviolet spectroscopy
 
Uv visible spectroscopy
Uv visible spectroscopyUv visible spectroscopy
Uv visible spectroscopy
 
Unit 5 Spectroscopic Techniques-converted (1) (1).pdf
Unit 5 Spectroscopic Techniques-converted (1) (1).pdfUnit 5 Spectroscopic Techniques-converted (1) (1).pdf
Unit 5 Spectroscopic Techniques-converted (1) (1).pdf
 
uv.pptx
uv.pptxuv.pptx
uv.pptx
 
UV visible spectroscopy
UV visible spectroscopyUV visible spectroscopy
UV visible spectroscopy
 
Uv – visible spectroscopy .
Uv – visible spectroscopy .Uv – visible spectroscopy .
Uv – visible spectroscopy .
 

Recently uploaded

aaaaaaaaaaaaaaaaaaaaaaaaaaaaaaaaaaaaaaaaa
aaaaaaaaaaaaaaaaaaaaaaaaaaaaaaaaaaaaaaaaaaaaaaaaaaaaaaaaaaaaaaaaaaaaaaaaaaaaaaaaaa
aaaaaaaaaaaaaaaaaaaaaaaaaaaaaaaaaaaaaaaaa
siemaillard
 
How to Make a Field invisible in Odoo 17
How to Make a Field invisible in Odoo 17How to Make a Field invisible in Odoo 17
How to Make a Field invisible in Odoo 17
Celine George
 
Thesis Statement for students diagnonsed withADHD.ppt
Thesis Statement for students diagnonsed withADHD.pptThesis Statement for students diagnonsed withADHD.ppt
Thesis Statement for students diagnonsed withADHD.ppt
EverAndrsGuerraGuerr
 
678020731-Sumas-y-Restas-Para-Colorear.pdf
678020731-Sumas-y-Restas-Para-Colorear.pdf678020731-Sumas-y-Restas-Para-Colorear.pdf
678020731-Sumas-y-Restas-Para-Colorear.pdf
CarlosHernanMontoyab2
 
CLASS 11 CBSE B.St Project AIDS TO TRADE - INSURANCE
CLASS 11 CBSE B.St Project AIDS TO TRADE - INSURANCECLASS 11 CBSE B.St Project AIDS TO TRADE - INSURANCE
CLASS 11 CBSE B.St Project AIDS TO TRADE - INSURANCE
BhavyaRajput3
 
June 3, 2024 Anti-Semitism Letter Sent to MIT President Kornbluth and MIT Cor...
June 3, 2024 Anti-Semitism Letter Sent to MIT President Kornbluth and MIT Cor...June 3, 2024 Anti-Semitism Letter Sent to MIT President Kornbluth and MIT Cor...
June 3, 2024 Anti-Semitism Letter Sent to MIT President Kornbluth and MIT Cor...
Levi Shapiro
 
special B.ed 2nd year old paper_20240531.pdf
special B.ed 2nd year old paper_20240531.pdfspecial B.ed 2nd year old paper_20240531.pdf
special B.ed 2nd year old paper_20240531.pdf
Special education needs
 
The geography of Taylor Swift - some ideas
The geography of Taylor Swift - some ideasThe geography of Taylor Swift - some ideas
The geography of Taylor Swift - some ideas
GeoBlogs
 
CACJapan - GROUP Presentation 1- Wk 4.pdf
CACJapan - GROUP Presentation 1- Wk 4.pdfCACJapan - GROUP Presentation 1- Wk 4.pdf
CACJapan - GROUP Presentation 1- Wk 4.pdf
camakaiclarkmusic
 
Mule 4.6 & Java 17 Upgrade | MuleSoft Mysore Meetup #46
Mule 4.6 & Java 17 Upgrade | MuleSoft Mysore Meetup #46Mule 4.6 & Java 17 Upgrade | MuleSoft Mysore Meetup #46
Mule 4.6 & Java 17 Upgrade | MuleSoft Mysore Meetup #46
MysoreMuleSoftMeetup
 
Operation Blue Star - Saka Neela Tara
Operation Blue Star   -  Saka Neela TaraOperation Blue Star   -  Saka Neela Tara
Operation Blue Star - Saka Neela Tara
Balvir Singh
 
Embracing GenAI - A Strategic Imperative
Embracing GenAI - A Strategic ImperativeEmbracing GenAI - A Strategic Imperative
Embracing GenAI - A Strategic Imperative
Peter Windle
 
Synthetic Fiber Construction in lab .pptx
Synthetic Fiber Construction in lab .pptxSynthetic Fiber Construction in lab .pptx
Synthetic Fiber Construction in lab .pptx
Pavel ( NSTU)
 
The Roman Empire A Historical Colossus.pdf
The Roman Empire A Historical Colossus.pdfThe Roman Empire A Historical Colossus.pdf
The Roman Empire A Historical Colossus.pdf
kaushalkr1407
 
2024.06.01 Introducing a competency framework for languag learning materials ...
2024.06.01 Introducing a competency framework for languag learning materials ...2024.06.01 Introducing a competency framework for languag learning materials ...
2024.06.01 Introducing a competency framework for languag learning materials ...
Sandy Millin
 
Chapter 3 - Islamic Banking Products and Services.pptx
Chapter 3 - Islamic Banking Products and Services.pptxChapter 3 - Islamic Banking Products and Services.pptx
Chapter 3 - Islamic Banking Products and Services.pptx
Mohd Adib Abd Muin, Senior Lecturer at Universiti Utara Malaysia
 
Phrasal Verbs.XXXXXXXXXXXXXXXXXXXXXXXXXX
Phrasal Verbs.XXXXXXXXXXXXXXXXXXXXXXXXXXPhrasal Verbs.XXXXXXXXXXXXXXXXXXXXXXXXXX
Phrasal Verbs.XXXXXXXXXXXXXXXXXXXXXXXXXX
MIRIAMSALINAS13
 
Sha'Carri Richardson Presentation 202345
Sha'Carri Richardson Presentation 202345Sha'Carri Richardson Presentation 202345
Sha'Carri Richardson Presentation 202345
beazzy04
 
Lapbook sobre os Regimes Totalitários.pdf
Lapbook sobre os Regimes Totalitários.pdfLapbook sobre os Regimes Totalitários.pdf
Lapbook sobre os Regimes Totalitários.pdf
Jean Carlos Nunes Paixão
 
The approach at University of Liverpool.pptx
The approach at University of Liverpool.pptxThe approach at University of Liverpool.pptx
The approach at University of Liverpool.pptx
Jisc
 

Recently uploaded (20)

aaaaaaaaaaaaaaaaaaaaaaaaaaaaaaaaaaaaaaaaa
aaaaaaaaaaaaaaaaaaaaaaaaaaaaaaaaaaaaaaaaaaaaaaaaaaaaaaaaaaaaaaaaaaaaaaaaaaaaaaaaaa
aaaaaaaaaaaaaaaaaaaaaaaaaaaaaaaaaaaaaaaaa
 
How to Make a Field invisible in Odoo 17
How to Make a Field invisible in Odoo 17How to Make a Field invisible in Odoo 17
How to Make a Field invisible in Odoo 17
 
Thesis Statement for students diagnonsed withADHD.ppt
Thesis Statement for students diagnonsed withADHD.pptThesis Statement for students diagnonsed withADHD.ppt
Thesis Statement for students diagnonsed withADHD.ppt
 
678020731-Sumas-y-Restas-Para-Colorear.pdf
678020731-Sumas-y-Restas-Para-Colorear.pdf678020731-Sumas-y-Restas-Para-Colorear.pdf
678020731-Sumas-y-Restas-Para-Colorear.pdf
 
CLASS 11 CBSE B.St Project AIDS TO TRADE - INSURANCE
CLASS 11 CBSE B.St Project AIDS TO TRADE - INSURANCECLASS 11 CBSE B.St Project AIDS TO TRADE - INSURANCE
CLASS 11 CBSE B.St Project AIDS TO TRADE - INSURANCE
 
June 3, 2024 Anti-Semitism Letter Sent to MIT President Kornbluth and MIT Cor...
June 3, 2024 Anti-Semitism Letter Sent to MIT President Kornbluth and MIT Cor...June 3, 2024 Anti-Semitism Letter Sent to MIT President Kornbluth and MIT Cor...
June 3, 2024 Anti-Semitism Letter Sent to MIT President Kornbluth and MIT Cor...
 
special B.ed 2nd year old paper_20240531.pdf
special B.ed 2nd year old paper_20240531.pdfspecial B.ed 2nd year old paper_20240531.pdf
special B.ed 2nd year old paper_20240531.pdf
 
The geography of Taylor Swift - some ideas
The geography of Taylor Swift - some ideasThe geography of Taylor Swift - some ideas
The geography of Taylor Swift - some ideas
 
CACJapan - GROUP Presentation 1- Wk 4.pdf
CACJapan - GROUP Presentation 1- Wk 4.pdfCACJapan - GROUP Presentation 1- Wk 4.pdf
CACJapan - GROUP Presentation 1- Wk 4.pdf
 
Mule 4.6 & Java 17 Upgrade | MuleSoft Mysore Meetup #46
Mule 4.6 & Java 17 Upgrade | MuleSoft Mysore Meetup #46Mule 4.6 & Java 17 Upgrade | MuleSoft Mysore Meetup #46
Mule 4.6 & Java 17 Upgrade | MuleSoft Mysore Meetup #46
 
Operation Blue Star - Saka Neela Tara
Operation Blue Star   -  Saka Neela TaraOperation Blue Star   -  Saka Neela Tara
Operation Blue Star - Saka Neela Tara
 
Embracing GenAI - A Strategic Imperative
Embracing GenAI - A Strategic ImperativeEmbracing GenAI - A Strategic Imperative
Embracing GenAI - A Strategic Imperative
 
Synthetic Fiber Construction in lab .pptx
Synthetic Fiber Construction in lab .pptxSynthetic Fiber Construction in lab .pptx
Synthetic Fiber Construction in lab .pptx
 
The Roman Empire A Historical Colossus.pdf
The Roman Empire A Historical Colossus.pdfThe Roman Empire A Historical Colossus.pdf
The Roman Empire A Historical Colossus.pdf
 
2024.06.01 Introducing a competency framework for languag learning materials ...
2024.06.01 Introducing a competency framework for languag learning materials ...2024.06.01 Introducing a competency framework for languag learning materials ...
2024.06.01 Introducing a competency framework for languag learning materials ...
 
Chapter 3 - Islamic Banking Products and Services.pptx
Chapter 3 - Islamic Banking Products and Services.pptxChapter 3 - Islamic Banking Products and Services.pptx
Chapter 3 - Islamic Banking Products and Services.pptx
 
Phrasal Verbs.XXXXXXXXXXXXXXXXXXXXXXXXXX
Phrasal Verbs.XXXXXXXXXXXXXXXXXXXXXXXXXXPhrasal Verbs.XXXXXXXXXXXXXXXXXXXXXXXXXX
Phrasal Verbs.XXXXXXXXXXXXXXXXXXXXXXXXXX
 
Sha'Carri Richardson Presentation 202345
Sha'Carri Richardson Presentation 202345Sha'Carri Richardson Presentation 202345
Sha'Carri Richardson Presentation 202345
 
Lapbook sobre os Regimes Totalitários.pdf
Lapbook sobre os Regimes Totalitários.pdfLapbook sobre os Regimes Totalitários.pdf
Lapbook sobre os Regimes Totalitários.pdf
 
The approach at University of Liverpool.pptx
The approach at University of Liverpool.pptxThe approach at University of Liverpool.pptx
The approach at University of Liverpool.pptx
 

UV Spectroscopy- Pharmaceutical Analysis

  • 2. NIPER Introduction  Spectroscopy is the tool for study of atomic & molecular structure.  UV/visible spectroscopy is also called electronic spectroscopy because the absorption spectra are a result of the behaviour of electrons in the target molecules.  It deals with interaction of electronic radiation with matter involving the measurement & interpretation of the extension of absorption or emission of EMR by molecule.  It provides information about electronic properties of molecules  Most important consequence of such interaction is the energy is absorbed or emitted by the matter in discrete amount called as quanta. 2
  • 3. NIPER Introduction  UV radiation starts at blue end of visible light (4000 Å) & ends at 2000 Å.  It divided into two spectral region- Near UV region- 2000Å – 4000Å. Far UV region- below 2000 Å.  UV-spectroscopy involved with electronic excitation. 3
  • 4. NIPER Introduction  The difference in energy between molecular bonding, non-bonding and anti-bonding orbitals ranges from 125–650 kJ/mole  This energy corresponds to EM radiation in the ultraviolet (UV) region, 200-400 nm, and visible (VIS) regions 400-800 nm of the spectrum 4
  • 5. Characteristics of UV-Vis spectra of Organic Molecules  Absorb mostly in UV, unless highly conjugated system  Spectra are broad, usually to broad for qualitative identification purposes  The most common detector for HPLC
  • 6. Introduction The Spectroscopic Process  In UV spectroscopy, the sample is irradiated with the broad spectrum of the UV radiation  If a particular electronic transition matches the energy of a certain band of UV, it will be absorbed  The remaining UV light passes through the sample and is observed  From this residual radiation a spectrum is obtained with “gaps” at these discrete energies – this is called an absorption spectrum NIPER 6
  • 7.  According to MO concept when molecule irradiated with UV-VIS radiation the transfer of electron takes place from HOMO level to LUMO level (valency shell MO’s) .  During these electron transfers, the molecule absorbs energy and absorbed energy converted into UV-VIS peaks/ bands .  The transfer of electrons from HOMO to LUMO (BMO-ABMO) is called electronic excitations or transitions. NIPER Molecular Orbitals 7
  • 8. Graphical Representation of MOs Energy s n Atomic orbital Atomic orbital s Molecular orbitals Occupied levels Unoccupied levels NIPER 8
  • 10. Observed electronic transitions  From the molecular orbital diagram, there are several possible electronic transitions that can occur, each of a different relative energy: Energy s s n s s n n s s alkanes carbonyls unsaturated cmpds. O, N, S, halogens carbonyls NIPER 10
  • 11. Observed electronic transitions  Special equipment to study vacuum or far UV is required  Routine organic UV spectra are typically collected from 200-700 nm  This limits the transitions that can be observed: n n s s s s carbonyls alkanes 150 nm carbonyls 170 nm unsaturated cmpds.180 nm √ - if conjugated! O, N, S, halogens 190 nm 300 nm √ Energy 11 NIPER
  • 12. Instrumentation sample reference detector I0 I0 I0 I 1. The construction of a traditional UV-VIS spectrometer is very similar to an IR, as similar functions – sample handling, irradiation, detection and output are required 2. Here is a simple schematic that covers most modern UV spectrometers: log(I0/I) = A 200 700 ,nm monochromator/ beam splitter optics UV-VIS sources NIPER 12
  • 13. Instrumentation 3. Two sources are required to scan the entire UV-VIS band:  Deuterium lamp – covers the UV – 200–330  Tungsten lamp – covers 330–700 4. As with the dispersive IR, the lamps illuminate the entire band of UV or visible light; the monochromator (grating or prism) gradually changes the small bands of radiation sent to the beam splitter 5. The beam splitter sends a separate band to a cell containing the sample solution and a reference solution 6. The detector measures the difference between the transmitted light through the sample (I) vs. the incident light (I0) and sends this information to the recorder NIPER 13
  • 14. Instrumentation sample Polychromator – entrance slit and dispersion device 7. As with dispersive IR, time is required to cover the entire UV-VIS band due to the mechanism of changing wavelengths 8. A recent improvement is the diode-array spectrophotometer - here a prism (dispersion device) breaks apart the full spectrum transmitted through the sample 9. Each individual band of UV is detected by a individual diodes on a silicon wafer simultaneously – the obvious limitation is the size of the diode, so some loss of resolution over traditional instruments is observed Diode array UV-VIS sources NIPER 14
  • 15. Instrumentation Instrumentation – Sample Handling 1. Virtually all UV spectra are recorded solution-phase 2. Cells can be made of plastic, glass or quartz 3. Only quartz is transparent in the full 200-700 nm range; plastic and glass are only suitable for visible spectra 4.Concentration (we will cover shortly) is empirically determined A typical sample cell (commonly called a cuvet): NIPER 15
  • 16. Instrumentation Instrumentation – Sample Handling 5. Solvents must be transparent in the region to be observed; the wavelength where a solvent is no longer transparent is referred to as the cutoff 6. Since spectra are only obtained up to 200 nm, solvents typically only need to lack conjugated π systems or carbonyls Common solvents and cutoffs: acetonitrile 190 chloroform 240 cyclohexane 195 1,4-dioxane 215 95% ethanol 205 n-hexane 201 methanol 205 isooctane 195 water 190 NIPER 16
  • 17. Instrumentation and Spectra Instrumentation – Sample Handling 7. Additionally solvents must preserve the fine structure (where it is actually observed in UV!) where possible 8. H-bonding further complicates the effect of vibrational and rotational energy levels on electronic transitions. 9. The more non-polar the solvent, the better (this is not always possible) NIPER 17
  • 18.  Transitions are faster due to parallel arrangement of π and π* orbital's.  Interactions / overlapping is more irrespective of energy gap.  Transitions slow due to perpendicular arrangement of n and π* orbitals.  These transitions may be due to vibrations or twisting of the bonds. NIPER  Allowed excitations are more probable and faster  Forbidden excitations (less probable) Electronic Excitations 18
  • 19. *** Selection Rules  Not all transitions that are possible are observed  For an electron to transition, certain quantum mechanical constraints apply – these are called “selection rules”  For example, an electron cannot change its spin quantum number during a transition – these are “forbidden” Other examples include:  the number of electrons that can be excited at one time  symmetry properties of the molecule  symmetry of the electronic states  To further complicate matters, “forbidden” transitions are sometimes observed (albeit at low intensity) due to other factors NIPER 19
  • 20. *** Selection Rules 1) The symmetry allowed excitations are high probable excitations. Ex: π—π* 2) Symmetry forbidden excitations are low probable excitations Ex: n—π* 3) Excitations can takes place among BMO to ABMO and NBMO to ABMO’S. 4) During electronic transition spin inversion is forbidden. NIPER 20
  • 21. 5) During electronic transitions change in multiplicity is forbidden. NIPER *** Selection Rules 21
  • 22. 6) Change in position of nuclei of bond during electronic transition is forbidden (Frank Condon Principle). (There is no change in the internuclear distance of the molecule during the excitation process. This is known as “Franck-Condon principle”.) NIPER *** Selection Rules 22
  • 23. Representation of UV spectrum diagram  Each UV-band is characterized with its intensity and its position.  Є or logЄ α Intensity.  Forbidden transitions UV band are low intense bands. Є <100  Allowed transitions UV bands are high intense bands Є>10000 (10,000, 50,000, 100,000) NIPER 23
  • 24. Є = Molar absorptivity or Molar extension coefficient FromBeer’s- Lamberts law A = Є. c. l Where A = Absorbance ( no units) c = concentration (moles/lit) l = length of solution or thickness of sol. or length of the tube/cell NIPER Representation of UV spectrum diagram 24
  • 25. Q: Certain sample solutions concentration is 0.001 gms/100 ml. M.Wt is 424, l = 1 cm, A = 0. 3025. Calculate Є ? NIPER Problems 25
  • 26. Q: For a solution of camphor in hexane in a 10 cm cell absorbance at 295 nm was found to be 2.52. What is the concentration of Camphor ? Molar extenction coefficient is 14. NIPER Problems 26
  • 27. Important Terms 200 to 800 nm • a) Chromophore:- • Any group which is absorbing energy from UV-VIS range of radiation called as Chromophore. • b)Auxochrome:- • The group which can not absorb radiation 200 to 800 nm range is the auxochrome. Auxochrome shift UV band towards higher λ side (right). It is called Bathochromic shift . • Ex:- lone pair electron groups and –Ve charged groups. NIPER 27
  • 28. • c) Bathochromic Shift:- • Movement of UV peak towards higher λ side (right side ) is called the Bathochromic shift (red shift). • d) Hypsochromic shift:- • Movement of UV peak or band towards lower λ side (left side) is the Hypsochromic shift (Blue Shift). • e) Hyperchromic shift :- • Increase in intensity of UV peak is hyperchromic shift (more Є or logЄ value) • f) Hypochromic shift:- • Decrease in intensity of UV peak of band (lower Є or logЄ value). NIPER Important Terms 28
  • 29. Absorption & Intensity Shifts NIPER 29
  • 30. 30 Theoretical prediction of λmax of conjugated π-system  ***Woodward – fieser rules (Empirical rules)  Eg: 1,3-butadiene system, c=c-c=c  Parent acyclic diene 217 nm (base values, π-π*)  Parent hetero annular diene 215 nm ( ,, )  Parent homo annular dienes 253 nm ( ,, )  Increments for the substituents 1) Alkyl group or ring residues +5 2) For each exocyclic double bond +5 3) 4) 5) Double bond with extending conjugation +30 On diene if halogen present +5 On diene if alkoxy group present +6 NIPER
  • 31. Limitation:-  These rules are valid for unsaturated system which is having less than four double bonds in conjugation.  1)Acyclic C=C-C=C 217 nm  2) Hetero annular (two double bonds not in the same ring)  3) Homo annular (two double bonds with conjugation in same ring system)  4) If in the same molecule homo and hetero dienes present, homo diene is the base value (higher value) NIPER 31
  • 32. Q: Calculate the Absorption Maximum? NIPER 32
  • 33. Q: Calculate the Absorption Maximum? NIPER 33
  • 34. Q: Calculate the Absorption Maximum? NIPER 34
  • 35. Applications of UV-Visible Spectroscopy 35
  • 36. 36 Why should we learn this stuff? After all, nobody solves structures with UV any longer!  Many organic molecules have chromophores that absorb UV  UV absorbance is about 1000 x easier to detect per mole than NMR  Still used in following reactions where the chromophore changes. Useful because timescale is so fast, and sensitivity so high. Kinetics, esp. in biochemistry, enzymology.  Most quantitative Analytical chemistry in organic chemistry is conducted using HPLC with UV detectors  One wavelength may not be the best for all compound in a mixture.  Affects quantitative interpretation of HPLC peak heights
  • 37. 37 Practical Applications • Pharmacy Practice – Ultraquin (psoriasis med. Needs UV.Act. – Pregnancy tests (colorimetric assays) – Blood glucose tests, Bilichek – ELISA’s • Pharmaceutics – pH titrations, purity measurement – concentration measurement
  • 38. 38 Pharmaceutical Applications  On Line Analysis of Vitamin A and Coloring Dyes for the Pharmaceutical Industry  Determination of Urinary Total Protein Output  Analysis of total barbiturates  Comparison of two physical light blocking agents for sunscreen lotions  Determination of acetylsalicylic acid in aspirin using Total Fluorescence Spectroscopy  Automated determination of the uniformity of dosage in Quinine Sulfate tablets using a Fibre Optics Autosampler  Determining Cytochrome P450 by UV-Vis Spectrophotometry  Light Transmittance of Plastic Pharmaceutical Containers
  • 39. Applications of UV-Visible Spectroscopy 39  Detection of functional groups  Estimation of extent of conjugation  Distinction in conjugated and non-conjugated compounds  Identification of an unknown compound  Examination of Polynuclear hydrocarbons  Elucidation of the structure of Vitamins A and K  Preference over two tautomeric forms  Identification of compound in different solvents  Determination of configurations of Geometrical isomers  Distinguishes between Equatorial and Axial conformations  Determination of strength of H-bonding  Hindered rotation and conformational analysis
  • 40. 40 UV vs. IR vs. NMR  UV has broad peaks relative to IR & NMR  UV has less information than IR & NMR  UV spectra are easier to collect  UV spectra are faster to collect  UV spectrometers are cheaper  UV spectra require only nanograms of material or chemicals
  • 41. 41