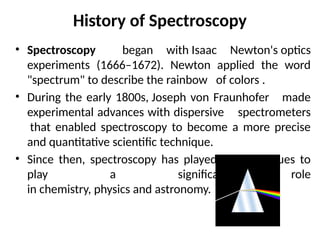
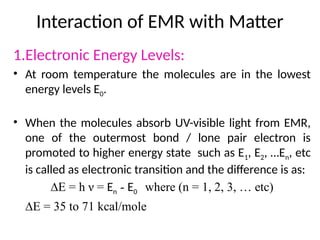
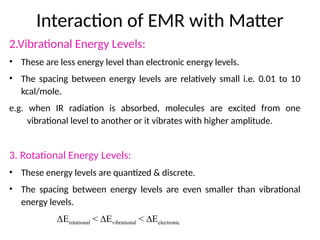
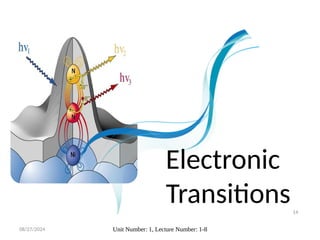
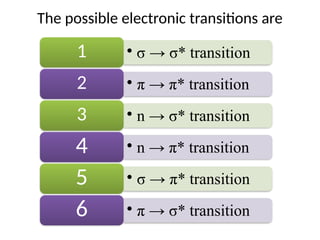
The document covers fundamental principles of UV-Visible spectroscopy, detailing the nature of light, electromagnetic radiation, and the history of spectroscopy from Isaac Newton's experiments to modern techniques. It explains various spectroscopic methods, electronic transitions, chromophores, and auxochromes, along with the Beer-Lambert Law and its limitations. Additionally, the document describes the instrumentation used in UV-Visible spectrophotometry, including light sources and monochromators.


![08/27/2024 Unit Number: 1, Lecture Number: 1-8 95
By using the formula: Cu =
[Au/As]×Cs×d;
Where,
Cu= Concentration of unknown,
Cs= Concentration of standard,
Au= Absorbance of Unknown
As= Absorbance of standard
d= Dilution factor
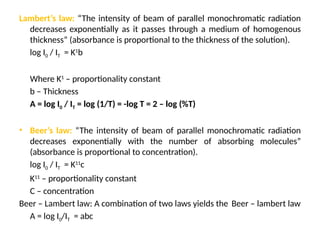
By using the equations through Beer’s
curve:
Y = mX + C
Where,
M= gradient of the line
C= y-intercept
X and Y are Axis of Graph
Single Component Analysis](https://image.slidesharecdn.com/uvvisiblespectroscopy-240827111617-17449677/85/UV-Visible-Spectroscopy-electronic-transitions-pptx-95-320.jpg)