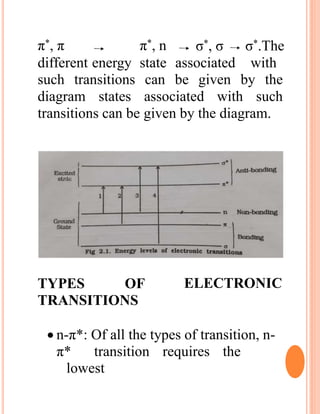
The document provides an introduction to spectroscopy, focusing on the measurement and interpretation of electromagnetic radiation absorbed or emitted by atoms or molecules. It discusses the types of electromagnetic radiation, their energy relationships, and various electronic transitions involved in UV and visible spectroscopy. Additionally, it covers important concepts such as chromophores, solvent effects, and the laws governing absorption of radiation, including Beer's and Lambert's laws.

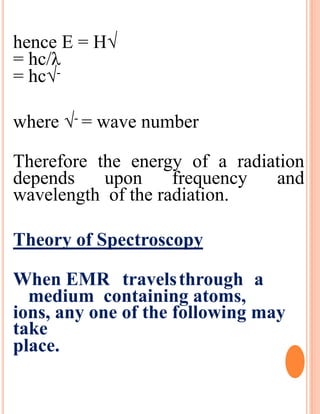
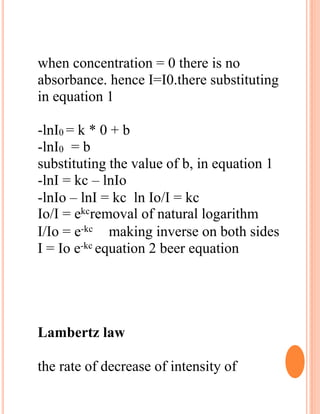
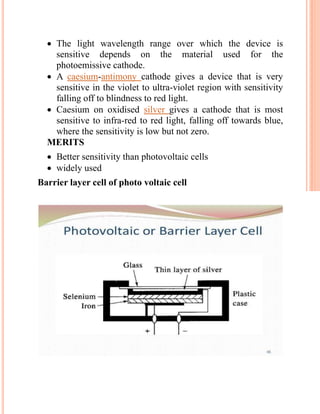
![[The decrease in the intensity of incident
light (I) with concentration (C) is
proportional to the intensity of incident
light(I)]
-dI/dc = kI
(removing and introducing the constant
of proporationality ‘k’)
- dI/I =k dc
rearranging
terms
-ln I = kc + b equation 1
on integration, b is constant of
integration](https://image.slidesharecdn.com/uvvisiblesprctroscopyppt-200803122313/85/Uv-visible-sprctroscopy-ppt-33-320.jpg)
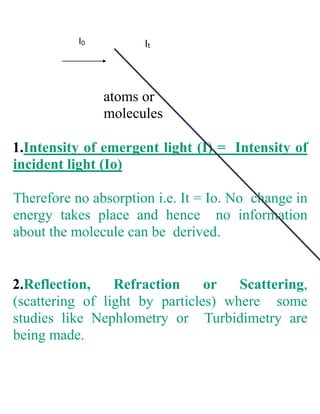
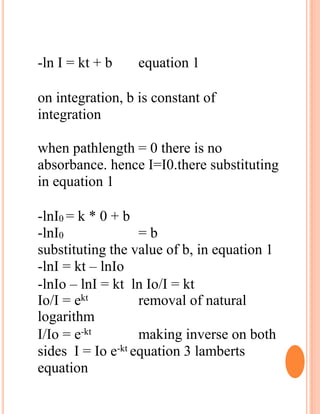
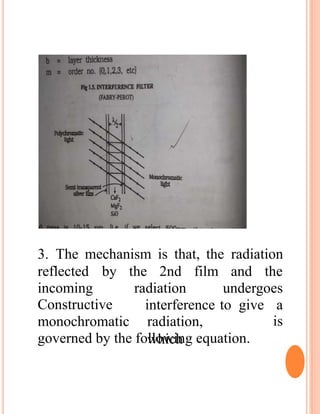
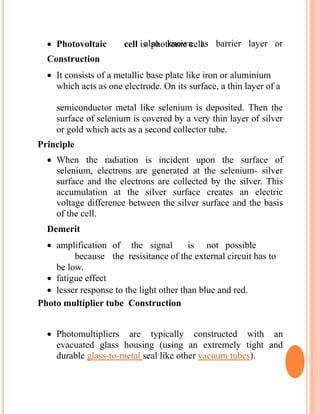
![monochromatic light with the thickness
of the medium is directly proportional to
the intensity of incident light.
Accordingly, -dI/dt I
[The decrease in the intensity of incident
light (I) with concentration (C) is
proportional to the intensity of incident
light(I)]
-dI/dt = kl
(removing and introducing the constant
of proporationality ‘k’)
- dI/I =k dt
rearranging
terms](https://image.slidesharecdn.com/uvvisiblesprctroscopyppt-200803122313/85/Uv-visible-sprctroscopy-ppt-35-320.jpg)
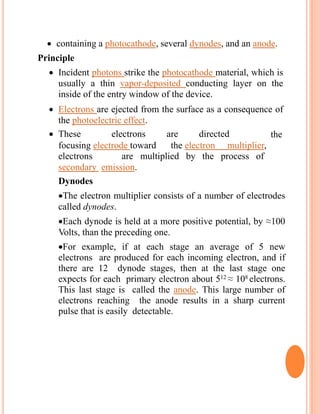
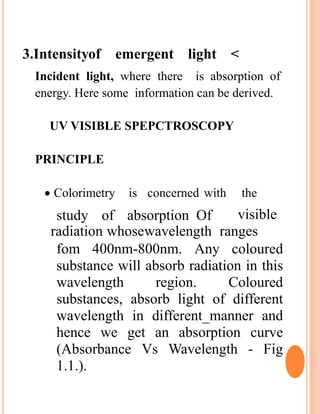
![(ii) Derivative spectrophotometric method
In this method, spectral isolation is achieved rather than
chromatographic isolation. In derivative spectrum the change in
absorbance with respect to wavelength (vs) wavelength is
Recorded first and second derivative spectrum is recorded and
the characteristic peak for the individual components can be
identified and quantified, using a calibration curve of pure
substance.
(iii) Difference Spectrophotometric method
This method is especially useful to quantify a substance when
interfering species are present. The principle is that absorbance
difference between two forms of the same drug is measured.
This method is used to quantify drugs in biological fluid.
4. Qualitative analysis
UVabsorption spectroscopy can characterize those types of
compounds which absorbs UV radiation. Identification is done
by comparing the absorption spectrum with the spectra of
known compounds.
UV absorption spectroscopy is generally used for characterizing
aromatic compounds and aromatic olefins.
Dissociation constants of acids and bases.
PH = PKa + log [A-] / [HA]
From the above equation, the PKa value can be calculated if the
ratio of [A-] / [HA] is known at a particular PH. and the ratio of
[A-] / [HA] can be determined spectrophotometrically from the
graph plotted between absorbance and wavelength at different
PH values.](https://image.slidesharecdn.com/uvvisiblesprctroscopyppt-200803122313/85/Uv-visible-sprctroscopy-ppt-82-320.jpg)