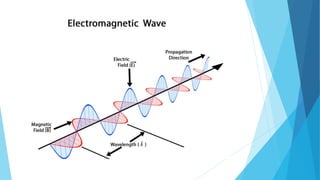
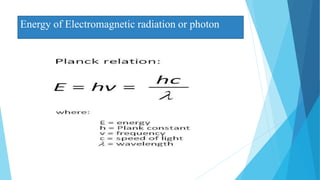
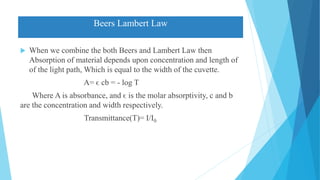
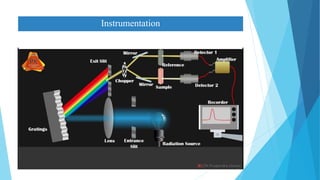
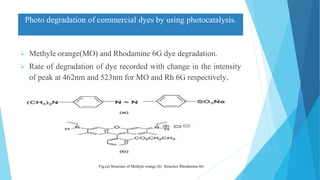
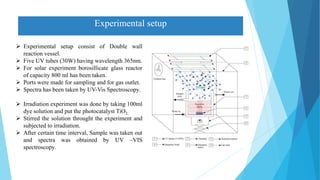
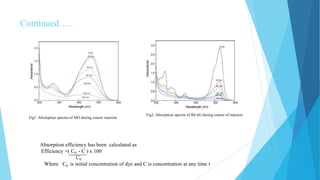
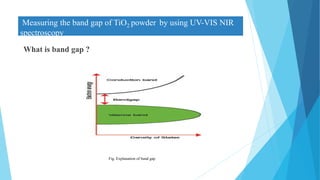
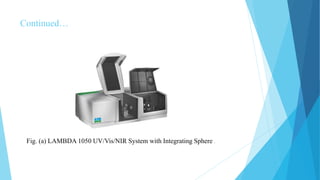
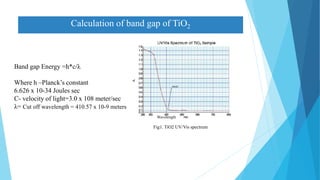
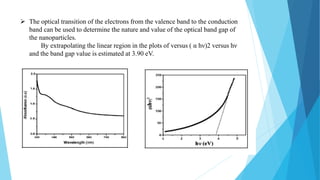
UV-VISIBLE-NIR SPECTROSCOPY
PRESENTED BY
SHIV SHANKAR (19DR0143) &
SHIVSHANKAR PRASAD(19DR0145)
Contents
 Electromagnetic radiation & spectrum.
 Spectroscopy.
 Colorimetry.
 UV-spectroscopy.
 NIR-spectroscopy.
 Electronic transitions.
 Terms used in UV-Visible spectroscopy.
 Beer lambert’s law.
 Instrumentation.
 Applications.
 References
Electromagnetic Radiation
 Electromagnetic radiation is a type of energy that is transmitted
through all medium. Light is supposed to dual characteristic,
particle(corpuscles) and wave.
 Radiant energy has wave nature and being associated with
electric as well as magnetic field, these radiations are called
electromagnetic radiation.
 The field may be represented as electric and magnetic vectors
oscillating in mutually perpendicular planes.
Energy of Electromagnetic radiation or photon
ELECTROMAGNETIC SPECTRUM
 The arrangement obtained by arranging various types of
electromagnetic waves or radiations in order of their increasing
wavelength or decreasing frequencies is called electromagnetic
spectrum.
 These are artificial divisions in the sense that they have been
defined solely as a result of differences in the instrumentation
required for producing and detecting radiation of a given
frequency range.
REGION OF ELECTROMAGNETIC RADIATION
 UV-200-400nm
 Violet: 400 - 420 nm
 Indigo: 420 - 440 nm
 Blue: 440 - 490 nm
 Green: 490 - 570 nm
 Yellow: 570 - 585 nm
 Orange: 585 - 620 nm
 Red: 620 - 780 nm
 NIR:780-2500
UV-Visible-NIR Wavelength range
SPECTROSCOPY
Spectroscopy is the study of the interaction between matter and
electromagnetic radiation.
Types of Spectroscopy
1. Atomic spectroscopy : Here, the changes in energy takes
place at atomic level.
E.g: Atomic absorption spectroscopy, Flame photometry
2. Molecular spectroscopy : Here, the changes in energy takes
place at molecular level.
E.g: UV spectroscopy, colorimetry, infra red spectroscopy
Absorption Spectrophotometer.
 It is used for the measurement of absorptive capacity for radiant
energy in the visible, UV and IR regions of the spectrum.
 Absorption spectrophotometry can be defined as the measurement
of absorption of radiant energy by various substances.
Visible spectroscopy/Colorimetry
 λ- 400-800nm
 Colored substance absorbs light of different λ in different manner and hence
get an absorption curve
 The λ at which maximum absorption takes place is called as λmax .
 λmax is characteristic for every colored substance
 On plotting a graph of concentration v/s absorbance, we get a calibration
curve that is useful in determining the concentration or amount of a drug
substance in the given sample solution.
UV SPECTROSCOPY
 It is study of absorption of UV-radiation which ranges from 200-
400nm.
 Valence electrons absorb the energy thereby molecules undergoes
transition from ground state to excited state.
 This absorption characteristic depends on the nature of electrons
present.
 Types of electrons
 σ electrons: in saturated compounds
 π electrons: in unsaturated compounds
 n electrons: in non bonded electrons or lone pair.
There are three types of electronic transition which can be
considered:
1. Transitions involving σ,π and n electrons.
2.Transitions involving charge-transfer electrons.
3.Transitions involving d and f electrons .
Types of electronic transition
1. Transitions involving σ,π and n electrons.
σ-σ*
 σ electron from orbital is excited to corresponding anti-bonding orbital σ*.
 The energy required is large for this transition.
 The organic compounds in which all the valence shell electrons are involved
in the formation of σ bond do not show absorption in normal uv region (200-
400nm)
 This transition is observed with saturated compounds.
 The usual spectroscopic technique cannot be used below 200 nm.
 To study this high energy transition, the entire region should be evacuated
(Vacuum uv region)
 Eg: Methane(CH₄) has C-H bond only and can undergo σ-σ* transition and
shows absorption maxima at 122nm.
π- π*
 π electron in a bonding orbital is excited to corresponding anti-
bonding orbital π*.
 Energy required is less when compared to n-σ*
 Compounds containing multiple bonds like alkenes, alkynes,
carbonyls, nitriles, aromatic compounds etc undergo π-π*
transition.
 Eg: Alkenes generally absorb in the region 170-205nm.
 Absorption bands in carbonyls (180 nm)
 Saturated compounds containing one hetero atom with unshared
pair of electrons(n) like O,N,S and halogens are capable of n-σ*
transition.
 These transition require less energy than σ-σ* transition.
 In saturated alkyl halides, the energy required for transition
decrease with increase in the size of halogen atom (or decrease in
electronegativity).
 E.g: Methyl chloride has a λmax of 173nm. Methyl iodide has a
λmax of 258nm
 This type of transition is very sensitive to hydrogen bonding E.g.:
Alcohol & amines.
 Hydrogen bonding shift the uv absorptions to shorter wavelength.
n- σ*
 An electron from non-bonding orbital is promoted to anti-bonding
π* orbital.
 Compounds containing double bonds involving hetero
atoms(C=O,N=O) undergo such type of transitions.
 This transition require minimum energy out of all transitions and
shows absorption band at longer wavelength around 300nm.
 Eg: Saturated aldehydes shows both type of transitions (n-π*, π-
π*) at {low energy and high energy} around 290 and 180 nm.
n-π*
CHROMOPHORE
 Chromophore is isolated covalently bonded group responsible for
the absorption of light radiation.
 These groups exhibits absorption of electromagnetic radiations in
the visible or ultraviolet region.
C=C , C=O, NO2 etc.
 Some of the important chromophores are carbonyls, acids, esters,
nitrile, ethylenic groups.
Terms Used in UV- Spectroscopy
 These are saturated or un-saturated groups which themselves do
not absorb radiations, but when present along with a chromophore
enhances the absorbing properties of chromophore.
 Also known as colour enhancing group.
 All auxochromes have one or more non-bonding pair of
electrons.
E.G –NH2 ,-OH ,-OR,-COOH etc
 It extend the conjugation of a chromophore by sharing the non-
bonding electrons
Auxo-chrome
1.Bathochromic shift(red shift)
 When the absorption maxima(λmax)of a compound shifts to longer
wavelength, it is known as bathochromic shift or red shift.
 The effect is due to the presence of auxochrome or by change of
solvent.
 Eg: The n-π* transition for carbonyl compounds experiences
bathochromic shift when the polarity of solvent is decreased.
Absorption intensity shift
2.Hypsochromic Shift( Blue shift)
 When the absorption maxima (λmax) of a compound shifts to a
shorter wavelength, it is known as hypsochromic shift or blue
shift.
 The effect is due to the presence of a group causes removal of
conjugation or by change of solvent.
 Aniline shows blue shift in acidic medium since it loses
conjugation. Aniline(280nm) & Anilinium ion (203nm).
 When absorption intensity of a compound is increased, it is
known as hyperchromic shift or effect.
 Introduction of auxochrome usually increase absorption intensity.
 E.g: Pyridine + auxochrome --> 2,methyl pyridine
Absorption intensity of pyridine =2750
Absorption intensity of 2,methyl pyridine=3560
3.Hyperchromic Effect
4.Hypochromic Effect
 When absorption intensity of a compound is decreased, it is
known as hypochromic effect.
 An introduction of a group which distorts the geometry of a
molecules causes hypochromic Effect.
Shift and Effects
 NIR spectroscopy utilizes the spectral range between 780nm-
2500nm and provide much more structural information of
behavior of combination of bond.
 This method is based on molecular overtone and combination
vibration of C-H,O-H and N-H.
 These are subjected to vibrational energy changes when irradiated
by NIR frequency and two vibration pattern exist in these bonds
including stretch and bent vibration.
 Addition of normal transition of vibration called overtones.
 Molar absorptivity in the NIR region is very small.
Near Infrared Spectroscopy
Absorption Law’ s
The absorption of light by any absorbing material is governed by two laws .
1.Bouger-Lambert law
2.Beer’s law
1. Bouger-Lambert law: This law is states that “ The amount of the light absorbed is
depend on the thickness of the absorbing material & the intensity of the incident light”.
I – Intensity of transmitted light
I0 - initial intensity of incident light
b– thickness (path –length)
k – linear absorption co-efficient
The power term can be removed by converting to the log form.
ln(I/I0)= -kb
ln(I0/I )= kb or 2.303 log( I0/I) =kb.
It states that, the amount of light absorbed by a material is depend
on the number of absorbing molecule (concentration).
It can be represented as–
A= 2.303 log(I0/I) = k’c
where
k’=absorptivity constant, c= concentration of sample.
I -Intensity of transmitted light
I0 - initial intensity of incident light
2. Beer’s Law
Beers Lambert Law
 When we combine the both Beers and Lambert Law then
Absorption of material depends upon concentration and length of
of the light path, Which is equal to the width of the cuvette.
A= ϵ cb = - log T
Where A is absorbance, and ϵ is the molar absorptivity, c and b
are the concentration and width respectively.
Transmittance(T)= I/I0
Instrumentation
Light source: UV: - Hydrogen lamp ( hydrogen stored under
pressure) Deuterium lamp and Xenon lampit is not regularly used
because of unstability and also the radiation of UV causes the
generation of ozone by ionization of the oxygen molecule.
Visible range light source :– Tungston filament lamp , Tungston
halogen lamp and carbon arc lamp.
Monochromators : Consists of an entrance slit which admits the
polychromatic light from the source.
Continued…
Application of UV-Vis-NIR Spectroscopy
Photo degradation of commercial dyes by using photocatalysis.
 Methyle orange(MO) and Rhodamine 6G dye degradation.
 Rate of degradation of dye recorded with change in the intensity
of peak at 462nm and 523nm for MO and Rh 6G respectively.
Fig.(a) Structure of Methyle orange (b) Structure Rhodamine 6G
Experimental setup
 Experimental setup consist of Double wall
reaction vessel.
 Five UV tubes (30W) having wavelength 365nm.
 For solar experiment borosillicate glass reactor
of capacity 800 ml has been taken.
 Ports were made for sampling and for gas outlet.
 Spectra has been taken by UV-Vis Spectroscopy.
 Irradiation experiment was done by taking 100ml
dye solution and put the photocatalyst TiO2.
 Stirred the solution throught the experiment and
subjected to irradiation.
 After certain time interval, Sample was taken out
and spectra was obtained by UV –VIS
spectroscopy.
Continued…..
Fig1. Absorption spectra of MO during course reaction
Fig2. Absorption spectra of Rh 6G during course of reaction
Absorption efficiency has been calculated as
Efficiency =( C0 - C ) x 100
C0
Where C0 is initial concentration of dye and C is concentration at any time t
Measuring the band gap of TiO2 powder by using UV-VIS NIR
spectroscopy
What is band gap ?
Fig. Explanation of band gap
Continued…
Fig. (a) LAMBDA 1050 UV/Vis/NIR System with Integrating Sphere .
Calculation of band gap of TiO2
Fig1. TiO2 UV/Vis spectrum
Wavelength
Band gap Energy =h*c/λ
Where h –Planck’s constant
6.626 x 10⁻³⁴ Joules sec
C- velocity of light=3.0 x 10⁸ meter/sec
λ= Cut off wavelength = 410.57 x 10⁻⁹ meters
To estimate energy structures and optical properties of nanoparticles
 We calculate optical absorption coefficient in the wavelength range of
300–800 nm by using formula:-
α = 1/d log(1/T)
Where
α=absorption cofficient, d=Thickness,T=Transmittance.
 The absorption coefficient was very low for photon energies in the
visible region, while a rapid increase in the absorption coefficient
occurred in the UV region.
 Generally, the wavelength of the maximum exciton absorption (λmax)
decreases as the particle size decreases due to increase in band gap of
photo generated electron – hole carriers
Continued…
 It is noticed that NiO nanoparticles exhibit a blue shift in the
absorption onset.
 The absorption edge of nanoparticles is obtained at 320 nm and a
blue shift is observed.
 The absorption coefficient ( α ) is obeying the following relation
for high photon energies (hv)-
α=A(hv -Eg)1/2/h v
 where α , Eg and A are the absorption coefficient, band gap and
constant respectively.
 The optical transition of the electrons from the valence band to the conduction
band can be used to determine the nature and value of the optical band gap of
the nanoparticles.
By extrapolating the linear region in the plots of versus ( α hν)2 versus hν
and the band gap value is estimated at 3.90 eV.
References
1. Elementary organic spectroscopy,principles & chemical applications,Y.R
Sharma,Revised edition,pg n.o 18,26,27.
2. Pharmaceutical chemistry,Instrumental techniques,vol 2,Leslie.G.chatten,pg n.o 21-
24.
3. Principles and practice of analytical chemistry,F.W Fifield & D.kealey, 5th edition
,pg n.o 270-274.
4. Pharmaceutical analysis,P.Parimoo, pg n.o 147,151,152,165.
5. Industrial methods of chemical analysis,B.K Sharma,pg n.o 46-65,91-113.
6. Kansal, S. K., Singh, M., & Sud, D. (2007). Studies on photodegradation of two
commercial dyes in aqueous phase using different photocatalysts. Journal of hazardous
materials, 141(3), 581-590.
7. Hoffman, M., Martin, S., Choi, W., & Bahnemann, D. (1995). “Environmental
applications of semiconductor photo catalysis,” Chemical Review, vol. 95, pp. 69-96.
Continued…..
8. Wade, J. (2005). An investigation of TiO2-ZnFe2O4 nanocomposites for visible
light photocatalysis.
9. Wikipedia: Bandgap definition and diagram.
10. Sagadevan, S., & Podder, J. (2015). Investigations on structural, optical,
morphological and electrical properties of nickel oxide nanoparticles. International
Journal of Nanoparticles, 8(3-4), 289-301.
THANK YOU

UV- VISIBLE-NIR spectroscopy-IIT DHANBAD

  • 1.
    UV-VISIBLE-NIR SPECTROSCOPY PRESENTED BY SHIVSHANKAR (19DR0143) & SHIVSHANKAR PRASAD(19DR0145)
  • 2.
    Contents  Electromagnetic radiation& spectrum.  Spectroscopy.  Colorimetry.  UV-spectroscopy.  NIR-spectroscopy.  Electronic transitions.  Terms used in UV-Visible spectroscopy.  Beer lambert’s law.  Instrumentation.  Applications.  References
  • 3.
    Electromagnetic Radiation  Electromagneticradiation is a type of energy that is transmitted through all medium. Light is supposed to dual characteristic, particle(corpuscles) and wave.  Radiant energy has wave nature and being associated with electric as well as magnetic field, these radiations are called electromagnetic radiation.  The field may be represented as electric and magnetic vectors oscillating in mutually perpendicular planes.
  • 5.
    Energy of Electromagneticradiation or photon
  • 6.
    ELECTROMAGNETIC SPECTRUM  Thearrangement obtained by arranging various types of electromagnetic waves or radiations in order of their increasing wavelength or decreasing frequencies is called electromagnetic spectrum.  These are artificial divisions in the sense that they have been defined solely as a result of differences in the instrumentation required for producing and detecting radiation of a given frequency range.
  • 7.
  • 8.
     UV-200-400nm  Violet:400 - 420 nm  Indigo: 420 - 440 nm  Blue: 440 - 490 nm  Green: 490 - 570 nm  Yellow: 570 - 585 nm  Orange: 585 - 620 nm  Red: 620 - 780 nm  NIR:780-2500 UV-Visible-NIR Wavelength range
  • 9.
    SPECTROSCOPY Spectroscopy is thestudy of the interaction between matter and electromagnetic radiation. Types of Spectroscopy 1. Atomic spectroscopy : Here, the changes in energy takes place at atomic level. E.g: Atomic absorption spectroscopy, Flame photometry 2. Molecular spectroscopy : Here, the changes in energy takes place at molecular level. E.g: UV spectroscopy, colorimetry, infra red spectroscopy
  • 10.
    Absorption Spectrophotometer.  Itis used for the measurement of absorptive capacity for radiant energy in the visible, UV and IR regions of the spectrum.  Absorption spectrophotometry can be defined as the measurement of absorption of radiant energy by various substances.
  • 11.
    Visible spectroscopy/Colorimetry  λ-400-800nm  Colored substance absorbs light of different λ in different manner and hence get an absorption curve  The λ at which maximum absorption takes place is called as λmax .  λmax is characteristic for every colored substance  On plotting a graph of concentration v/s absorbance, we get a calibration curve that is useful in determining the concentration or amount of a drug substance in the given sample solution.
  • 12.
    UV SPECTROSCOPY  Itis study of absorption of UV-radiation which ranges from 200- 400nm.  Valence electrons absorb the energy thereby molecules undergoes transition from ground state to excited state.  This absorption characteristic depends on the nature of electrons present.  Types of electrons  σ electrons: in saturated compounds  π electrons: in unsaturated compounds  n electrons: in non bonded electrons or lone pair.
  • 13.
    There are threetypes of electronic transition which can be considered: 1. Transitions involving σ,π and n electrons. 2.Transitions involving charge-transfer electrons. 3.Transitions involving d and f electrons . Types of electronic transition
  • 14.
    1. Transitions involvingσ,π and n electrons.
  • 15.
    σ-σ*  σ electronfrom orbital is excited to corresponding anti-bonding orbital σ*.  The energy required is large for this transition.  The organic compounds in which all the valence shell electrons are involved in the formation of σ bond do not show absorption in normal uv region (200- 400nm)  This transition is observed with saturated compounds.  The usual spectroscopic technique cannot be used below 200 nm.  To study this high energy transition, the entire region should be evacuated (Vacuum uv region)  Eg: Methane(CH₄) has C-H bond only and can undergo σ-σ* transition and shows absorption maxima at 122nm.
  • 16.
    π- π*  πelectron in a bonding orbital is excited to corresponding anti- bonding orbital π*.  Energy required is less when compared to n-σ*  Compounds containing multiple bonds like alkenes, alkynes, carbonyls, nitriles, aromatic compounds etc undergo π-π* transition.  Eg: Alkenes generally absorb in the region 170-205nm.  Absorption bands in carbonyls (180 nm)
  • 17.
     Saturated compoundscontaining one hetero atom with unshared pair of electrons(n) like O,N,S and halogens are capable of n-σ* transition.  These transition require less energy than σ-σ* transition.  In saturated alkyl halides, the energy required for transition decrease with increase in the size of halogen atom (or decrease in electronegativity).  E.g: Methyl chloride has a λmax of 173nm. Methyl iodide has a λmax of 258nm  This type of transition is very sensitive to hydrogen bonding E.g.: Alcohol & amines.  Hydrogen bonding shift the uv absorptions to shorter wavelength. n- σ*
  • 18.
     An electronfrom non-bonding orbital is promoted to anti-bonding π* orbital.  Compounds containing double bonds involving hetero atoms(C=O,N=O) undergo such type of transitions.  This transition require minimum energy out of all transitions and shows absorption band at longer wavelength around 300nm.  Eg: Saturated aldehydes shows both type of transitions (n-π*, π- π*) at {low energy and high energy} around 290 and 180 nm. n-π*
  • 19.
    CHROMOPHORE  Chromophore isisolated covalently bonded group responsible for the absorption of light radiation.  These groups exhibits absorption of electromagnetic radiations in the visible or ultraviolet region. C=C , C=O, NO2 etc.  Some of the important chromophores are carbonyls, acids, esters, nitrile, ethylenic groups. Terms Used in UV- Spectroscopy
  • 20.
     These aresaturated or un-saturated groups which themselves do not absorb radiations, but when present along with a chromophore enhances the absorbing properties of chromophore.  Also known as colour enhancing group.  All auxochromes have one or more non-bonding pair of electrons. E.G –NH2 ,-OH ,-OR,-COOH etc  It extend the conjugation of a chromophore by sharing the non- bonding electrons Auxo-chrome
  • 21.
    1.Bathochromic shift(red shift) When the absorption maxima(λmax)of a compound shifts to longer wavelength, it is known as bathochromic shift or red shift.  The effect is due to the presence of auxochrome or by change of solvent.  Eg: The n-π* transition for carbonyl compounds experiences bathochromic shift when the polarity of solvent is decreased. Absorption intensity shift
  • 22.
    2.Hypsochromic Shift( Blueshift)  When the absorption maxima (λmax) of a compound shifts to a shorter wavelength, it is known as hypsochromic shift or blue shift.  The effect is due to the presence of a group causes removal of conjugation or by change of solvent.  Aniline shows blue shift in acidic medium since it loses conjugation. Aniline(280nm) & Anilinium ion (203nm).
  • 23.
     When absorptionintensity of a compound is increased, it is known as hyperchromic shift or effect.  Introduction of auxochrome usually increase absorption intensity.  E.g: Pyridine + auxochrome --> 2,methyl pyridine Absorption intensity of pyridine =2750 Absorption intensity of 2,methyl pyridine=3560 3.Hyperchromic Effect
  • 24.
    4.Hypochromic Effect  Whenabsorption intensity of a compound is decreased, it is known as hypochromic effect.  An introduction of a group which distorts the geometry of a molecules causes hypochromic Effect.
  • 25.
  • 26.
     NIR spectroscopyutilizes the spectral range between 780nm- 2500nm and provide much more structural information of behavior of combination of bond.  This method is based on molecular overtone and combination vibration of C-H,O-H and N-H.  These are subjected to vibrational energy changes when irradiated by NIR frequency and two vibration pattern exist in these bonds including stretch and bent vibration.  Addition of normal transition of vibration called overtones.  Molar absorptivity in the NIR region is very small. Near Infrared Spectroscopy
  • 27.
    Absorption Law’ s Theabsorption of light by any absorbing material is governed by two laws . 1.Bouger-Lambert law 2.Beer’s law 1. Bouger-Lambert law: This law is states that “ The amount of the light absorbed is depend on the thickness of the absorbing material & the intensity of the incident light”. I – Intensity of transmitted light I0 - initial intensity of incident light b– thickness (path –length) k – linear absorption co-efficient The power term can be removed by converting to the log form. ln(I/I0)= -kb ln(I0/I )= kb or 2.303 log( I0/I) =kb.
  • 28.
    It states that,the amount of light absorbed by a material is depend on the number of absorbing molecule (concentration). It can be represented as– A= 2.303 log(I0/I) = k’c where k’=absorptivity constant, c= concentration of sample. I -Intensity of transmitted light I0 - initial intensity of incident light 2. Beer’s Law
  • 29.
    Beers Lambert Law When we combine the both Beers and Lambert Law then Absorption of material depends upon concentration and length of of the light path, Which is equal to the width of the cuvette. A= ϵ cb = - log T Where A is absorbance, and ϵ is the molar absorptivity, c and b are the concentration and width respectively. Transmittance(T)= I/I0
  • 30.
  • 31.
    Light source: UV:- Hydrogen lamp ( hydrogen stored under pressure) Deuterium lamp and Xenon lampit is not regularly used because of unstability and also the radiation of UV causes the generation of ozone by ionization of the oxygen molecule. Visible range light source :– Tungston filament lamp , Tungston halogen lamp and carbon arc lamp. Monochromators : Consists of an entrance slit which admits the polychromatic light from the source. Continued…
  • 32.
  • 33.
    Photo degradation ofcommercial dyes by using photocatalysis.  Methyle orange(MO) and Rhodamine 6G dye degradation.  Rate of degradation of dye recorded with change in the intensity of peak at 462nm and 523nm for MO and Rh 6G respectively. Fig.(a) Structure of Methyle orange (b) Structure Rhodamine 6G
  • 34.
    Experimental setup  Experimentalsetup consist of Double wall reaction vessel.  Five UV tubes (30W) having wavelength 365nm.  For solar experiment borosillicate glass reactor of capacity 800 ml has been taken.  Ports were made for sampling and for gas outlet.  Spectra has been taken by UV-Vis Spectroscopy.  Irradiation experiment was done by taking 100ml dye solution and put the photocatalyst TiO2.  Stirred the solution throught the experiment and subjected to irradiation.  After certain time interval, Sample was taken out and spectra was obtained by UV –VIS spectroscopy.
  • 35.
    Continued….. Fig1. Absorption spectraof MO during course reaction Fig2. Absorption spectra of Rh 6G during course of reaction Absorption efficiency has been calculated as Efficiency =( C0 - C ) x 100 C0 Where C0 is initial concentration of dye and C is concentration at any time t
  • 36.
    Measuring the bandgap of TiO2 powder by using UV-VIS NIR spectroscopy What is band gap ? Fig. Explanation of band gap
  • 37.
    Continued… Fig. (a) LAMBDA1050 UV/Vis/NIR System with Integrating Sphere .
  • 38.
    Calculation of bandgap of TiO2 Fig1. TiO2 UV/Vis spectrum Wavelength Band gap Energy =h*c/λ Where h –Planck’s constant 6.626 x 10⁻³⁴ Joules sec C- velocity of light=3.0 x 10⁸ meter/sec λ= Cut off wavelength = 410.57 x 10⁻⁹ meters
  • 39.
    To estimate energystructures and optical properties of nanoparticles  We calculate optical absorption coefficient in the wavelength range of 300–800 nm by using formula:- α = 1/d log(1/T) Where α=absorption cofficient, d=Thickness,T=Transmittance.  The absorption coefficient was very low for photon energies in the visible region, while a rapid increase in the absorption coefficient occurred in the UV region.  Generally, the wavelength of the maximum exciton absorption (λmax) decreases as the particle size decreases due to increase in band gap of photo generated electron – hole carriers
  • 40.
    Continued…  It isnoticed that NiO nanoparticles exhibit a blue shift in the absorption onset.  The absorption edge of nanoparticles is obtained at 320 nm and a blue shift is observed.  The absorption coefficient ( α ) is obeying the following relation for high photon energies (hv)- α=A(hv -Eg)1/2/h v  where α , Eg and A are the absorption coefficient, band gap and constant respectively.
  • 41.
     The opticaltransition of the electrons from the valence band to the conduction band can be used to determine the nature and value of the optical band gap of the nanoparticles. By extrapolating the linear region in the plots of versus ( α hν)2 versus hν and the band gap value is estimated at 3.90 eV.
  • 42.
    References 1. Elementary organicspectroscopy,principles & chemical applications,Y.R Sharma,Revised edition,pg n.o 18,26,27. 2. Pharmaceutical chemistry,Instrumental techniques,vol 2,Leslie.G.chatten,pg n.o 21- 24. 3. Principles and practice of analytical chemistry,F.W Fifield & D.kealey, 5th edition ,pg n.o 270-274. 4. Pharmaceutical analysis,P.Parimoo, pg n.o 147,151,152,165. 5. Industrial methods of chemical analysis,B.K Sharma,pg n.o 46-65,91-113. 6. Kansal, S. K., Singh, M., & Sud, D. (2007). Studies on photodegradation of two commercial dyes in aqueous phase using different photocatalysts. Journal of hazardous materials, 141(3), 581-590. 7. Hoffman, M., Martin, S., Choi, W., & Bahnemann, D. (1995). “Environmental applications of semiconductor photo catalysis,” Chemical Review, vol. 95, pp. 69-96.
  • 43.
    Continued….. 8. Wade, J.(2005). An investigation of TiO2-ZnFe2O4 nanocomposites for visible light photocatalysis. 9. Wikipedia: Bandgap definition and diagram. 10. Sagadevan, S., & Podder, J. (2015). Investigations on structural, optical, morphological and electrical properties of nickel oxide nanoparticles. International Journal of Nanoparticles, 8(3-4), 289-301.
  • 44.