Download to read offline
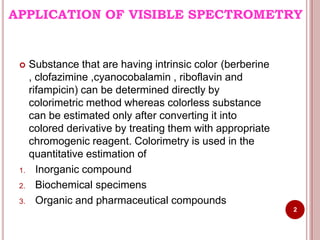
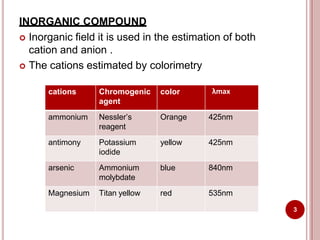
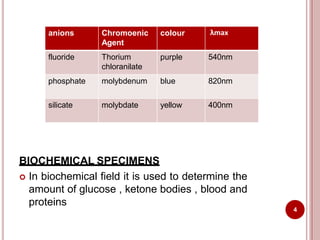
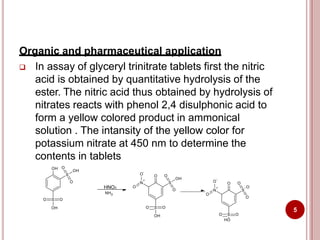
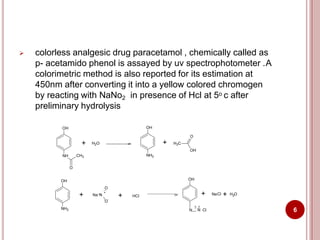
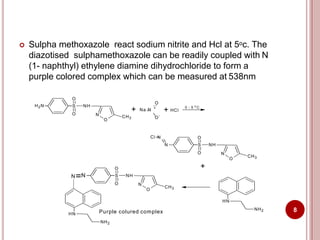
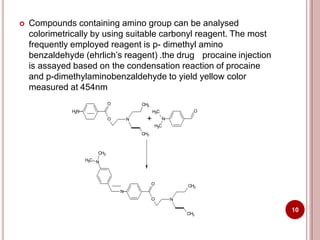
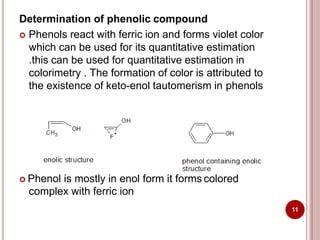
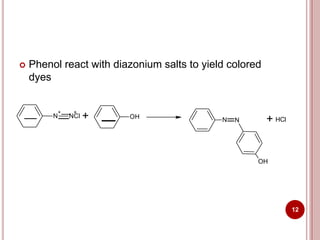
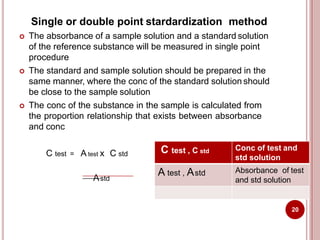
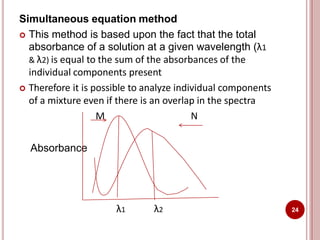
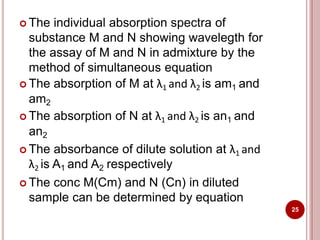


This document discusses applications of visible and UV spectrometry. It describes how colorimetry can be used to quantify both inorganic and organic compounds by converting colorless substances into colored derivatives using chromogenic reagents. Specific examples are provided for quantifying cations, anions, biochemical specimens, and pharmaceuticals colorimetrically. It also discusses how UV spectrometry can be used for quantitative and qualitative analysis of compounds. Methods described for quantitative analysis include using standard absorptivity values, calibration curves, and single/double point standardization. The document outlines approaches for analyzing both single component and multicomponent samples spectrophotometrically.


