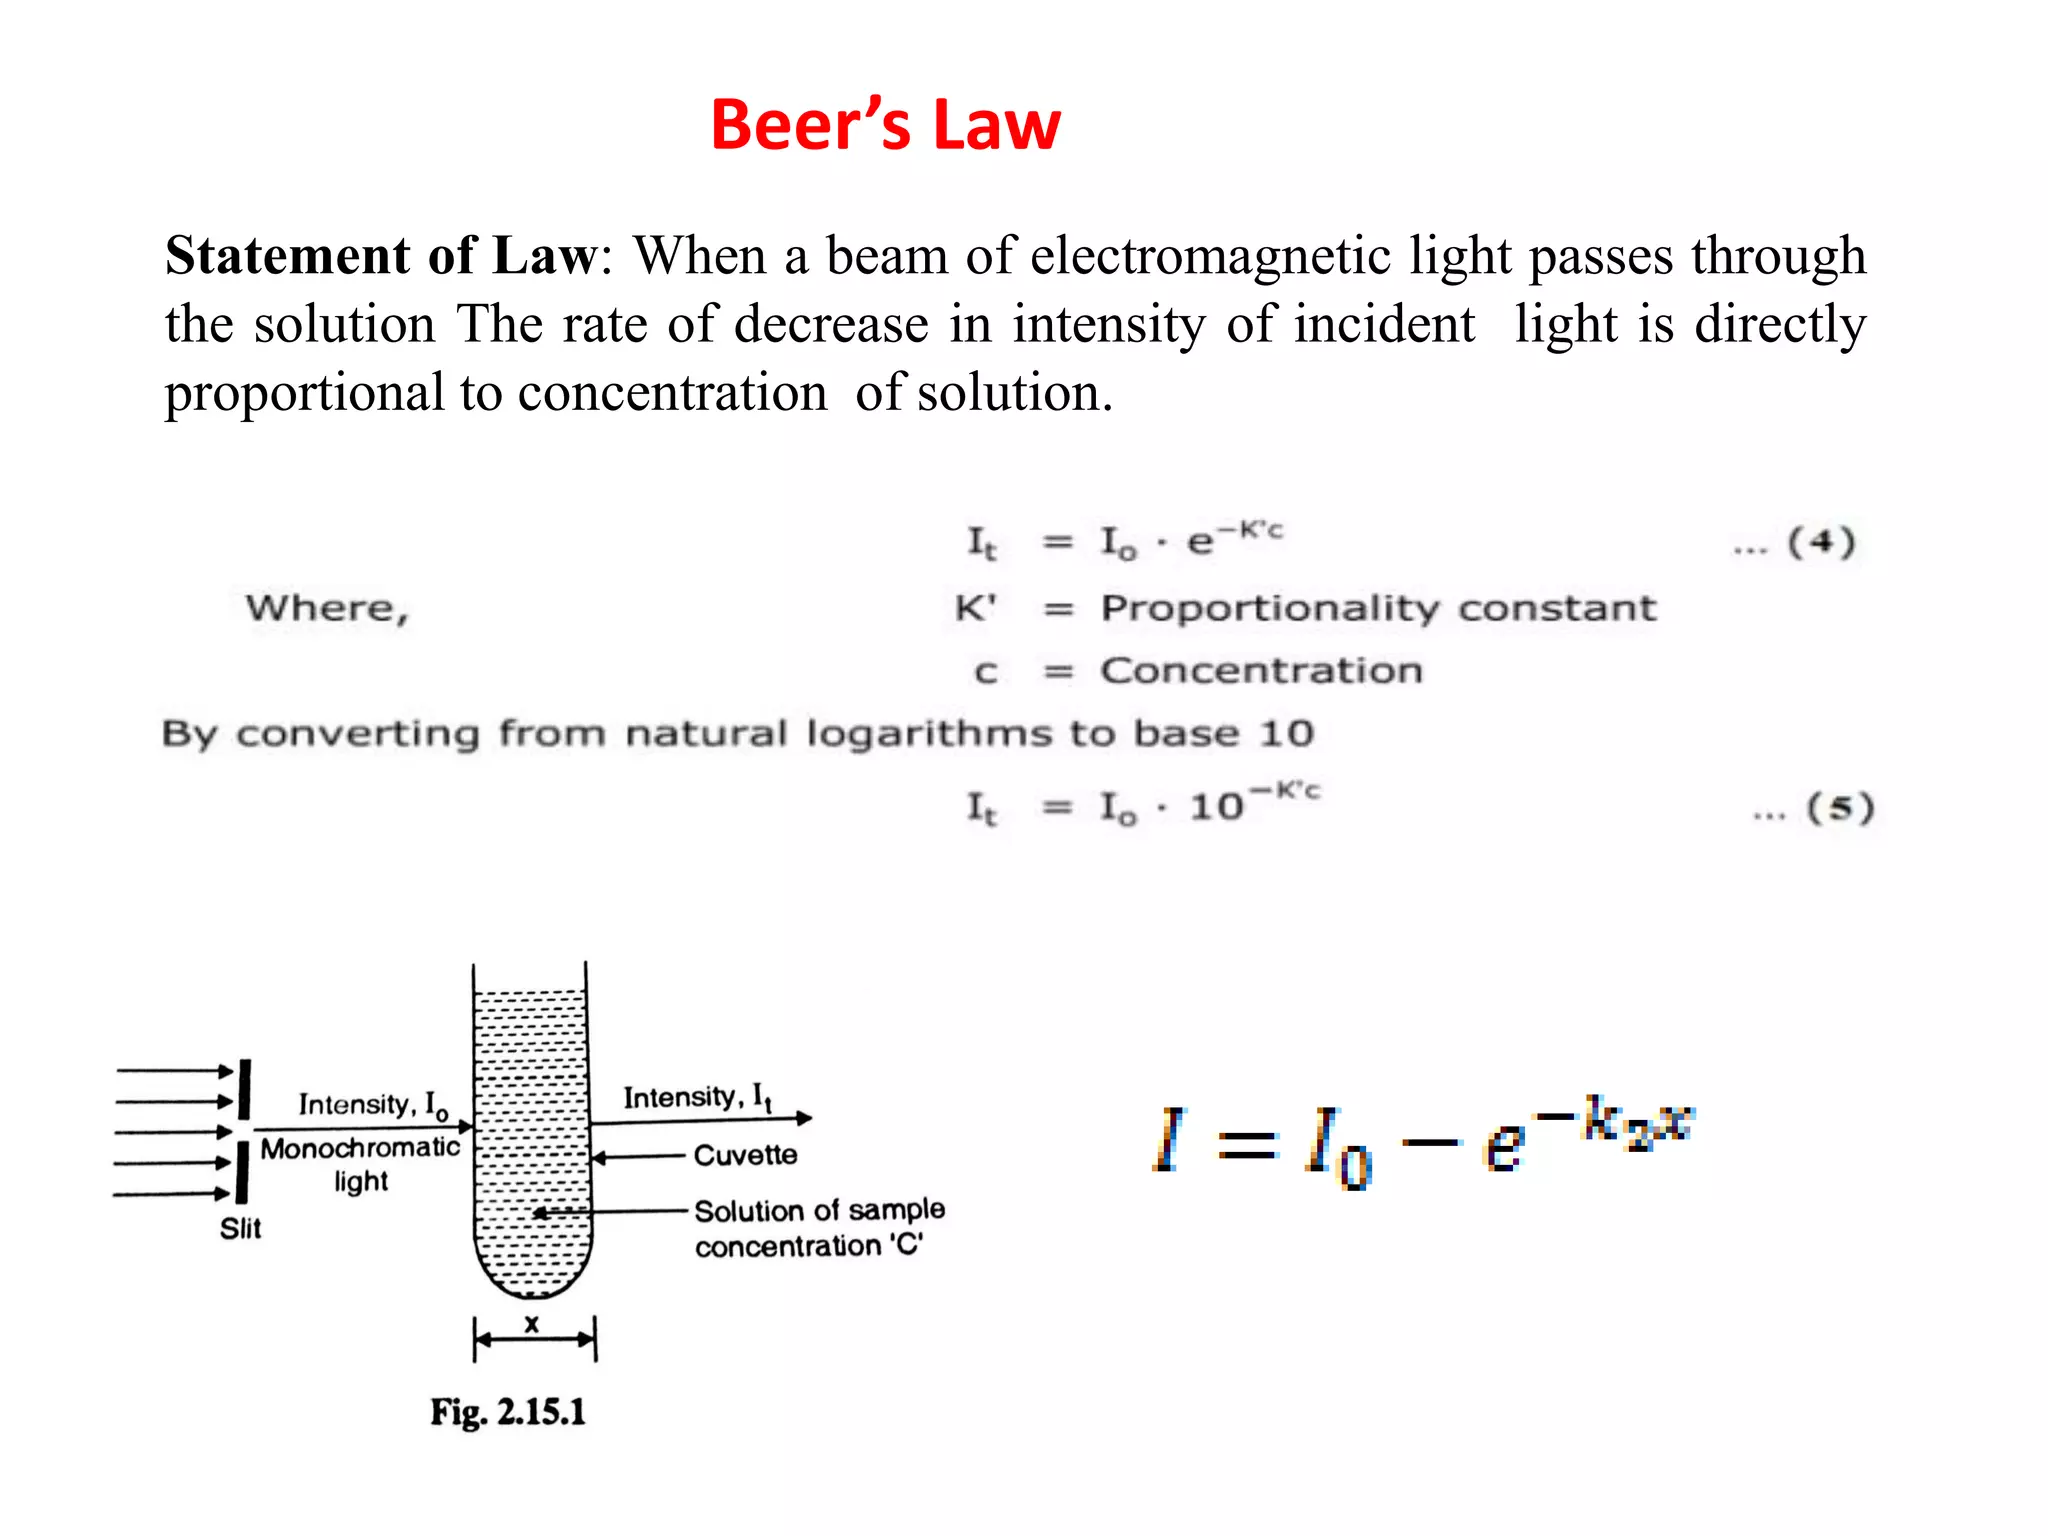
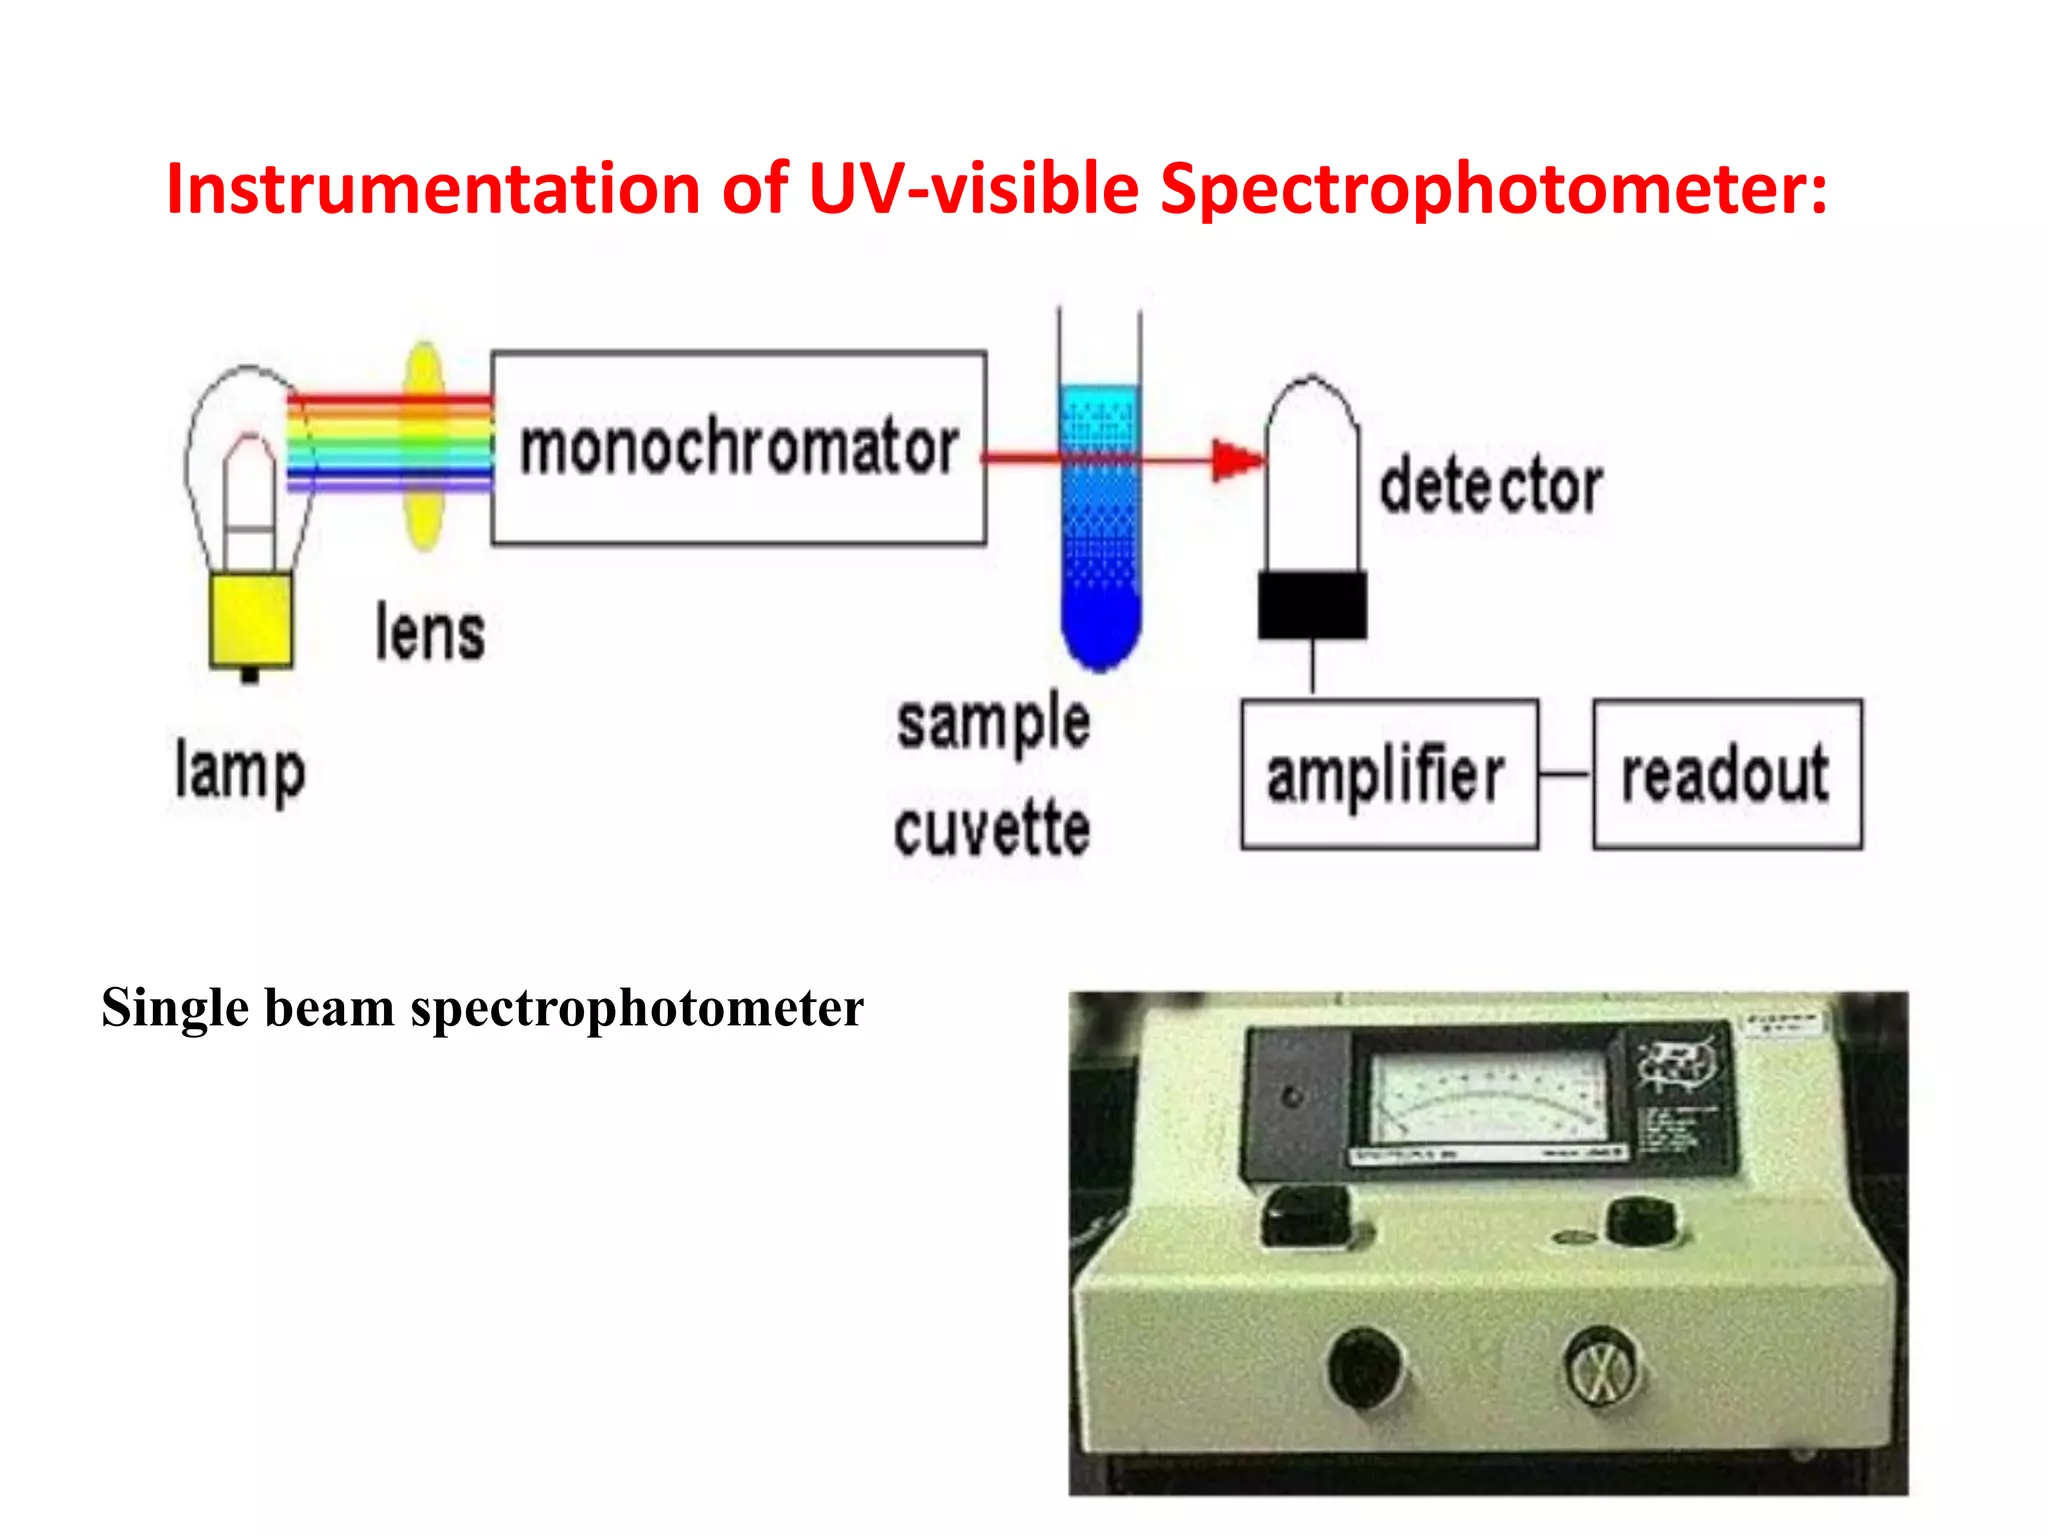
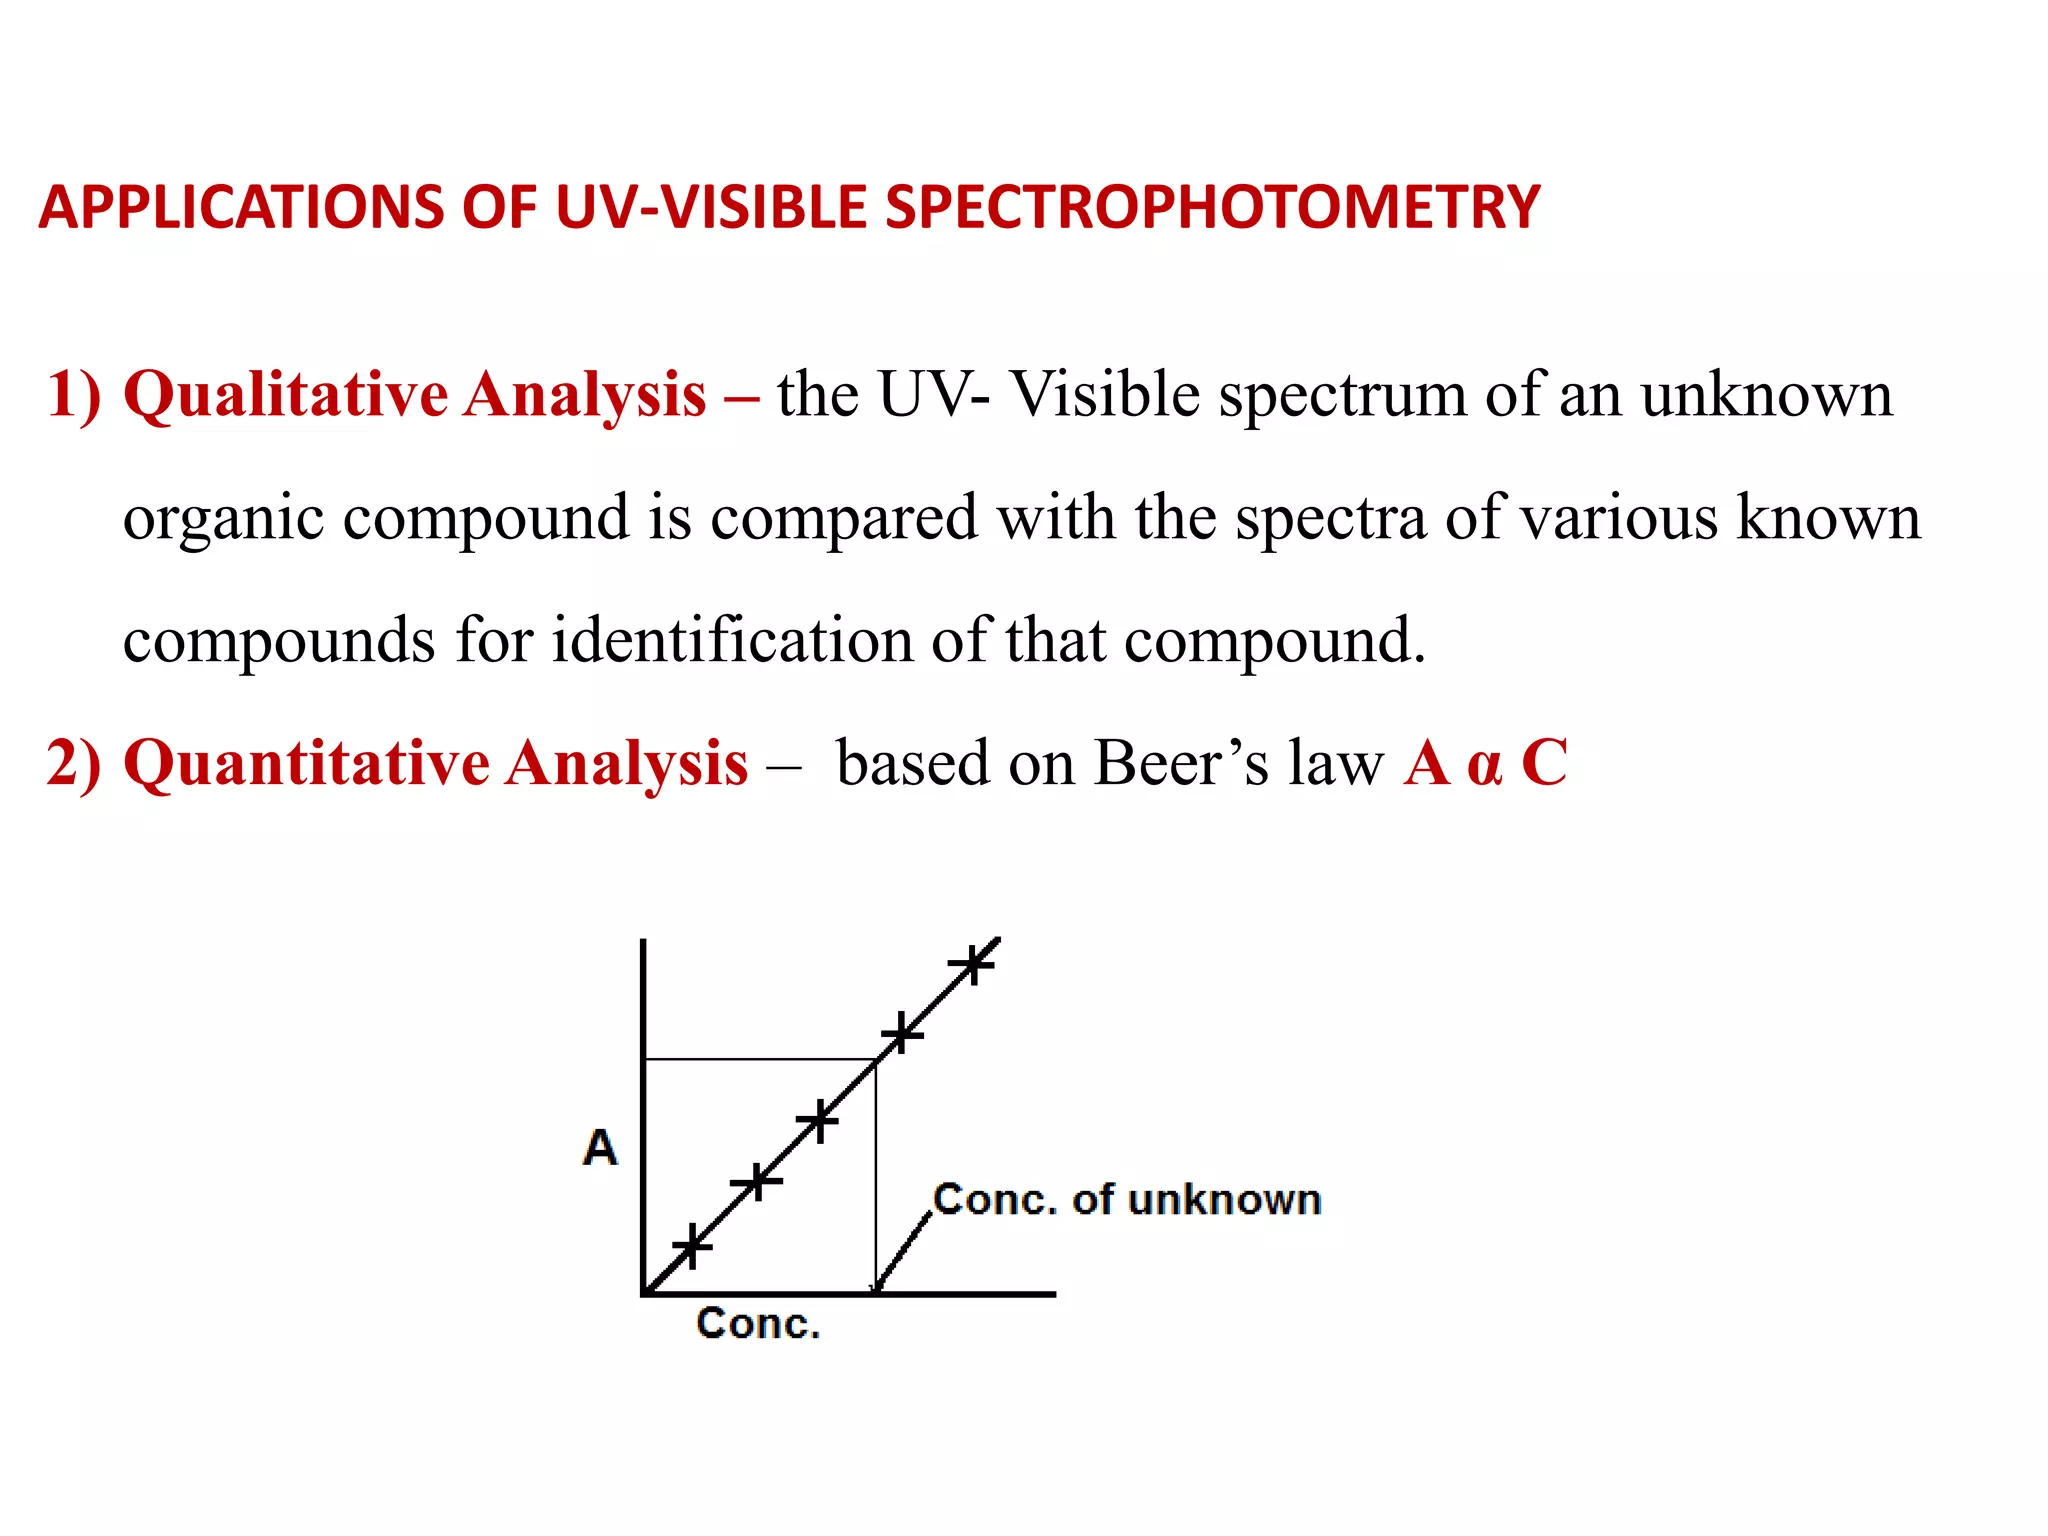
Unit 5
Spectroscopic Techniques
Spectroscopy:
➢ Spectroscopy is the branch of science that deals with the study of
interaction of electromagnetic radiation with matter.
➢Spectroscopic methods of analysis are based on measurement of the
electromagnetic radiation emitted or absorbed by the sample.
Therefore the physical and chemical properties of the substance directly
related with their structure.
➢Electromagnetic radiation consists of discrete packets of energy which
is called Photon.
➢Energy of photon of the EMR is given by E = hc/λ
Emr travel at 3 x 10 8 m/sec. the speed of the wave is given by velocity =
wavelength x frequency.
➢Characterized by wavelength and frequency.
Electrical and magnetic components oscillating at right angles to each other
and at right angle to the direction of propagation of waves.
They posses both property of wave and particle.
Spectroscopic Techniques
Uv-Visible Spectroscopy
➢UV visible region 200 780 nm can bring excitation of electrons in the bond to higher
energy ant bonding orbital.
➢Absorption in the IR range 2.5 to 50 microns can cause vibration in certain covalent
bond.
➢Microwave cause rotation.
➢Radio waves cause NMR.
∆ E rotational < ∆ E vibrational < ∆ E electronic
Interaction of radiation with matter
Lambert’s law
Statement of Law: When a beam of electromagnetic light passes through the solution
The rate of decrease in intensity of incident light is directly proportional to thickness
of solution through light passes.
Statement of Law: When a beam of electromagnetic light passes through
the solution The rate of decrease in intensity of incident light is directly
proportional to concentration of solution.
Beer’s Law
Combination of Lambert’s- Beer’s Law
Varification of Beer-Lambert’s law
Absorbance vs concentration ( thickness of medium is fixed )
Types of Spectroscopic methods of analysis
▪Spectroscopic methods of analysis are based on measurement of
the electromagnetic radiations emitted or absorbed by the solute or
sample.
▪Most common photometric methods are-
▪1. Colorimetry (400 to 800 nm)
▪2. Spectrophotometry UV (185-400 nm)
▪3. Visible (400 to 800 nm)
▪4. IR ( 0.76 to 15 µm)
Instrumentation of UV-visible Spectrophotometer:
Single beam spectrophotometer
It provides sufficient intensity over the wavelength region.
Two sources are required to scan the entire UV-VIS band:
a) Deuterium lamp – covers the UV – 190-350
b) Tungsten lamp – covers 330-780 (Visible range)
1. Sources of Radiations
2.Monochromator
The role of monochromator is to provide monochromatic light.
Quartz prism is used for UV region.
Glass prism are used for visible region.
3.Sample holder
•Virtually all UV spectra are recorded solution-phase
•Cells can be made of plastic, glass or quartz
•Only quartz is transparent in the full 200-700 nm range;
•plastic and glass are only suitable for visible spectra
•Concentration is empirically determined
A typical sample cell
(commonly called a
cuvet)
4. Detector:
•Detector converts electromagnetic radiation into electron flow and current or
voltage. The photocurrent is amplified if necessary . And then there is recorder to
or digital display device.
•E.g. phototube
•Photomultiplier tube
•Photovolatic tube
5. Amplifiers and recorder:
•Signal recevied from detector is amplified and read on recorder.
•Recorder can record output either in the graphical manner as absorption spectra
Or in the form of digital values as absorbance or transmittance.
λmax – It is the wavelength which
shows maximum absorbance
1.Chromophore:
A covalently unsaturated group responsible for electronic absorption
in UV-visible region is called chromophore .
E.g. C=C, C=O, N=O etc
Terms Used in UV-visible Spectroscopy
2.
Absorption and Intensity Shift:
3. Bathochromic shift (Red Shift):
When absorption maxima (λmax ) of a compound shifts to longer
wavelength it is known as bathochromic shift or red shift.
This is due to the presence of auxochrome or change of solvent.
E.g. auxochrome group like –OH, -OCH3
In alkaline medium, p-nitrophenol shows red shift. Because negatively
charged oxygen delocalizes more effectively than the unshared pair of
electron.
4.Hypsochromic Shift (Blue Shift):
When absorption maxima (λmax ) of a compound shifts to shorter wavelength
it is known as hypsochromic shift or blue shift.
It is caused due to removal of conjugation or changing in polarity of solvent.
Eg. Aniline shows blue shift in acidic medium, it loses conjugation.
5.Hyperchromic Shift:
When absorption intensity (ε) of a compound is increased, it
is known as hyperchromic shift.
If auxochrome introduces to the compound, the intensity of
absorption increases.
6.Hypochromic Shift:
When absorption intensity (ε) of a compound is decreased, it
is known as hypochromic shift.
It occurs due to introduction of group that distorts the
original geometry of molecule.
σ to σ* transition in vacuum UV
n to σ* saturated compounds with non-bonding electrons λ ~ 150-250 nm
n to π*, π to π* requires unsaturated functional groups (eq. double bonds)
most commonly used, energy good range for UV/Vis λ ~ 200 - 700 nm
The valence electrons are the only ones whose energies permit them to be
excited by near UV/visible radiation.
σ (bonding)
π (bonding)
n (non-bonding)
σ* (anti-bonding)
π* (anti-bonding)
Four types of transitions
π→π*
n→σ*
n→π*
σ→σ*
Electronic Transitions on absorption of UV Visible radiation
σ σ* Transition:
1.
2. n σ* transition:
3,4. n π * and π π* Transitions:
• The order of energy required for electronic transition is
σ σ * > σ → π* > π →σ* > σ → π* > π → π* > n → π*
• σ → π* and π →σ* transitions are forbidden
• σ σ * shows absorption at near UV
APPLICATIONS OF UV-VISIBLE SPECTROPHOTOMETRY
1) Qualitative Analysis – the UV- Visible spectrum of an unknown
organic compound is compared with the spectra of various known
compounds for identification of that compound.
2) Quantitative Analysis – based on Beer’s law A α C
⚫3) Chemical kinetics – as Absorbance is directly
proportional to concentration of reactant or product,
with the progress of reaction the change in extent of
absorption per minute can help to study the kinetics
of the chemical reactions.
⚫4) Structural Information – As λmax is the
characteristic value for different chromophores and
chromophore-auxochrome the structural parts in
organic molecules, spectrum gives the structural
information of the unknown compound.
⚫5) Dissociation constant of Weak Acid or Weak base
–
⚫6) Detection of impurities -
Infra Red (IR) Spectroscopy
❖ UV-visible spectroscopy gives information about presence of double and triple
bond in molecule while IR spectrum provide information about functional group in
molecule.
❖The electromagnetic radiations having wavelength range 0.78 to 200 µ or wave
number range 12800 to 50 cm-1 are called as infrared radiation.
Principal:
❖Molecule is not rigid atoms . The atoms in the molecule vibrate in different ways
each vibration requires different energy i. e. molecules has number of vibrational
energy levels. These energy levels are quantized.
❖If molecules absorb IR radiation, it gets excited to higher vibrational energy
level (Vo V1). The type of IR wavelength absorbed by the molecule depends on
the Type of atoms and chemical bonds in molecule.
❖ In IR spectrum, position of peak is specified in terms of frequency or
wavelength or wave number of IR radiation.
Vibrations in diatomic and polyatomic molecules:
❖ Number of fundamental vibrations in molecule can be calculated from its degree of freedom.
❖ In polyatomic molecule, each atom is having three degree of freedom in three Directions,
thus molecule of N atoms has 3N degree of freedom which is equal to sum of translational,
vibrational, rotational degree of freedom.
❖ For non linear molecule, out of 3N degree of freedom ,three describe rotational and
Three describe translation and remaining (3N-6) degrees are vibration degree of freedom.
❖ In linear molecule, only two degrees of freedom are require to describe rotation and
three describe translation. Thus remaining (3N-5) degrees are vibration degree of freedom.
Molecules Number of
atoms(N)
Geometry of
molecule
Fundamental
modes of
vibration
H2O 3 Non-linear 3
NH3 4 Non-linear 6
CH4 5 Non-linear 9
C2H6 8 Non-linear 18
C6H6 12 Non-linear 30
NO 2 Linear 1
CO2 3 Linear 4
Instrumentation of IR Spectrophotometer:
Schematic diagram of double beam IR spectrophotometer
1. Source:
a) Nerst Filament: It is mixture of rare earth oxide eg. Zirconium oxide, Yetrium
oxide and erbium oxide.
b) Globar: It is rod of silicon carbide.
c) Incandescent wire: It is spiral wire of nichrome.
d) Mercury Arc: High pressure mercury arc consist of quartz tube contain Hg vapors.
2. Monochromator:
Prism and gratings are used as monochromator. Prism made of metal halide like
NaCl, KBr.
3. Sample Cells and sampling of substance:
Material containing sample must be transperant to IR radiation so material made up of
NaCl and KBr, LiF. Sampling of solid can be done by
▪ Solid run in solution: solid dissolve in nonaquious solvent. Drop of solution place
On disc of alkali halide
▪ Solid film technique: used for amorphous solid. Sample deposit on KBr cell by
evaporation.
▪ Pressed pallet technique: sample finely ground with KBr and pressed in pallet.
▪ Mull Technque:sample mix with Nujol and mulled to make fine paste. Film apply
on KBr.
5. Amplifier and recorder:
Amplifier amplies signal from detector and send to recorder.
Recorder give graph of percentage of transmission versus wavelength or frequency.
Wavenumber(cm-1)
%
Transmission
4. Detectors:
a) Thermocouple: It uses two wires of different material welded together.
b) Bolometer: Platinum or Nickel used to form Bolometer, it is resistance
thermometer
which measure weak thermometer radiation.
c) Golay Detector: It is sensitive gas thermometer.
1.
2.
3.
4.
5.
6. Detection of Impurities:
IR spectra Of Impure Compound Show extra absorption bands.
By comparing IR spectra of pure compound and presence of impurity can be
detected.
Eg. Presences of cyclohexanone in cyclohexanol can be detected presence
by carbonyl absorption band.
7. Determination of size of ring ketones:
Ring strains in cyclic ketones shifts carbonyl group stretching frequency to higher
wavelength. Angle strain in ring causes carbonyl group to have more electron density
and shift bonds.
Eg. Cyclopropanone = 1818 cm-1
Cyclobutanone = 1775 cm-1
Cyclopentanone = 1740 cm-1
Cyclohexanone = 1710 cm-1

Unit 5 Spectroscopic Techniques-converted (1) (1).pdf

  • 1.
  • 2.
    Spectroscopy: ➢ Spectroscopy isthe branch of science that deals with the study of interaction of electromagnetic radiation with matter. ➢Spectroscopic methods of analysis are based on measurement of the electromagnetic radiation emitted or absorbed by the sample. Therefore the physical and chemical properties of the substance directly related with their structure. ➢Electromagnetic radiation consists of discrete packets of energy which is called Photon. ➢Energy of photon of the EMR is given by E = hc/λ Emr travel at 3 x 10 8 m/sec. the speed of the wave is given by velocity = wavelength x frequency. ➢Characterized by wavelength and frequency. Electrical and magnetic components oscillating at right angles to each other and at right angle to the direction of propagation of waves. They posses both property of wave and particle. Spectroscopic Techniques Uv-Visible Spectroscopy
  • 3.
    ➢UV visible region200 780 nm can bring excitation of electrons in the bond to higher energy ant bonding orbital. ➢Absorption in the IR range 2.5 to 50 microns can cause vibration in certain covalent bond. ➢Microwave cause rotation. ➢Radio waves cause NMR. ∆ E rotational < ∆ E vibrational < ∆ E electronic Interaction of radiation with matter
  • 4.
    Lambert’s law Statement ofLaw: When a beam of electromagnetic light passes through the solution The rate of decrease in intensity of incident light is directly proportional to thickness of solution through light passes.
  • 5.
    Statement of Law:When a beam of electromagnetic light passes through the solution The rate of decrease in intensity of incident light is directly proportional to concentration of solution. Beer’s Law
  • 6.
  • 7.
    Varification of Beer-Lambert’slaw Absorbance vs concentration ( thickness of medium is fixed )
  • 8.
    Types of Spectroscopicmethods of analysis ▪Spectroscopic methods of analysis are based on measurement of the electromagnetic radiations emitted or absorbed by the solute or sample. ▪Most common photometric methods are- ▪1. Colorimetry (400 to 800 nm) ▪2. Spectrophotometry UV (185-400 nm) ▪3. Visible (400 to 800 nm) ▪4. IR ( 0.76 to 15 µm)
  • 9.
    Instrumentation of UV-visibleSpectrophotometer: Single beam spectrophotometer
  • 10.
    It provides sufficientintensity over the wavelength region. Two sources are required to scan the entire UV-VIS band: a) Deuterium lamp – covers the UV – 190-350 b) Tungsten lamp – covers 330-780 (Visible range) 1. Sources of Radiations 2.Monochromator The role of monochromator is to provide monochromatic light. Quartz prism is used for UV region. Glass prism are used for visible region. 3.Sample holder •Virtually all UV spectra are recorded solution-phase •Cells can be made of plastic, glass or quartz •Only quartz is transparent in the full 200-700 nm range; •plastic and glass are only suitable for visible spectra •Concentration is empirically determined A typical sample cell (commonly called a cuvet)
  • 11.
    4. Detector: •Detector convertselectromagnetic radiation into electron flow and current or voltage. The photocurrent is amplified if necessary . And then there is recorder to or digital display device. •E.g. phototube •Photomultiplier tube •Photovolatic tube 5. Amplifiers and recorder: •Signal recevied from detector is amplified and read on recorder. •Recorder can record output either in the graphical manner as absorption spectra Or in the form of digital values as absorbance or transmittance. λmax – It is the wavelength which shows maximum absorbance
  • 12.
    1.Chromophore: A covalently unsaturatedgroup responsible for electronic absorption in UV-visible region is called chromophore . E.g. C=C, C=O, N=O etc Terms Used in UV-visible Spectroscopy 2.
  • 13.
  • 14.
    3. Bathochromic shift(Red Shift): When absorption maxima (λmax ) of a compound shifts to longer wavelength it is known as bathochromic shift or red shift. This is due to the presence of auxochrome or change of solvent. E.g. auxochrome group like –OH, -OCH3 In alkaline medium, p-nitrophenol shows red shift. Because negatively charged oxygen delocalizes more effectively than the unshared pair of electron.
  • 15.
    4.Hypsochromic Shift (BlueShift): When absorption maxima (λmax ) of a compound shifts to shorter wavelength it is known as hypsochromic shift or blue shift. It is caused due to removal of conjugation or changing in polarity of solvent. Eg. Aniline shows blue shift in acidic medium, it loses conjugation.
  • 16.
    5.Hyperchromic Shift: When absorptionintensity (ε) of a compound is increased, it is known as hyperchromic shift. If auxochrome introduces to the compound, the intensity of absorption increases.
  • 17.
    6.Hypochromic Shift: When absorptionintensity (ε) of a compound is decreased, it is known as hypochromic shift. It occurs due to introduction of group that distorts the original geometry of molecule.
  • 18.
    σ to σ*transition in vacuum UV n to σ* saturated compounds with non-bonding electrons λ ~ 150-250 nm n to π*, π to π* requires unsaturated functional groups (eq. double bonds) most commonly used, energy good range for UV/Vis λ ~ 200 - 700 nm The valence electrons are the only ones whose energies permit them to be excited by near UV/visible radiation. σ (bonding) π (bonding) n (non-bonding) σ* (anti-bonding) π* (anti-bonding) Four types of transitions π→π* n→σ* n→π* σ→σ* Electronic Transitions on absorption of UV Visible radiation
  • 20.
  • 21.
    2. n σ*transition:
  • 22.
    3,4. n π* and π π* Transitions:
  • 23.
    • The orderof energy required for electronic transition is σ σ * > σ → π* > π →σ* > σ → π* > π → π* > n → π* • σ → π* and π →σ* transitions are forbidden • σ σ * shows absorption at near UV
  • 24.
    APPLICATIONS OF UV-VISIBLESPECTROPHOTOMETRY 1) Qualitative Analysis – the UV- Visible spectrum of an unknown organic compound is compared with the spectra of various known compounds for identification of that compound. 2) Quantitative Analysis – based on Beer’s law A α C
  • 25.
    ⚫3) Chemical kinetics– as Absorbance is directly proportional to concentration of reactant or product, with the progress of reaction the change in extent of absorption per minute can help to study the kinetics of the chemical reactions. ⚫4) Structural Information – As λmax is the characteristic value for different chromophores and chromophore-auxochrome the structural parts in organic molecules, spectrum gives the structural information of the unknown compound. ⚫5) Dissociation constant of Weak Acid or Weak base – ⚫6) Detection of impurities -
  • 26.
    Infra Red (IR)Spectroscopy ❖ UV-visible spectroscopy gives information about presence of double and triple bond in molecule while IR spectrum provide information about functional group in molecule. ❖The electromagnetic radiations having wavelength range 0.78 to 200 µ or wave number range 12800 to 50 cm-1 are called as infrared radiation. Principal: ❖Molecule is not rigid atoms . The atoms in the molecule vibrate in different ways each vibration requires different energy i. e. molecules has number of vibrational energy levels. These energy levels are quantized. ❖If molecules absorb IR radiation, it gets excited to higher vibrational energy level (Vo V1). The type of IR wavelength absorbed by the molecule depends on the Type of atoms and chemical bonds in molecule. ❖ In IR spectrum, position of peak is specified in terms of frequency or wavelength or wave number of IR radiation.
  • 38.
    Vibrations in diatomicand polyatomic molecules: ❖ Number of fundamental vibrations in molecule can be calculated from its degree of freedom. ❖ In polyatomic molecule, each atom is having three degree of freedom in three Directions, thus molecule of N atoms has 3N degree of freedom which is equal to sum of translational, vibrational, rotational degree of freedom. ❖ For non linear molecule, out of 3N degree of freedom ,three describe rotational and Three describe translation and remaining (3N-6) degrees are vibration degree of freedom. ❖ In linear molecule, only two degrees of freedom are require to describe rotation and three describe translation. Thus remaining (3N-5) degrees are vibration degree of freedom. Molecules Number of atoms(N) Geometry of molecule Fundamental modes of vibration H2O 3 Non-linear 3 NH3 4 Non-linear 6 CH4 5 Non-linear 9 C2H6 8 Non-linear 18 C6H6 12 Non-linear 30 NO 2 Linear 1 CO2 3 Linear 4
  • 42.
    Instrumentation of IRSpectrophotometer: Schematic diagram of double beam IR spectrophotometer
  • 43.
    1. Source: a) NerstFilament: It is mixture of rare earth oxide eg. Zirconium oxide, Yetrium oxide and erbium oxide. b) Globar: It is rod of silicon carbide. c) Incandescent wire: It is spiral wire of nichrome. d) Mercury Arc: High pressure mercury arc consist of quartz tube contain Hg vapors. 2. Monochromator: Prism and gratings are used as monochromator. Prism made of metal halide like NaCl, KBr. 3. Sample Cells and sampling of substance: Material containing sample must be transperant to IR radiation so material made up of NaCl and KBr, LiF. Sampling of solid can be done by ▪ Solid run in solution: solid dissolve in nonaquious solvent. Drop of solution place On disc of alkali halide ▪ Solid film technique: used for amorphous solid. Sample deposit on KBr cell by evaporation. ▪ Pressed pallet technique: sample finely ground with KBr and pressed in pallet. ▪ Mull Technque:sample mix with Nujol and mulled to make fine paste. Film apply on KBr.
  • 44.
    5. Amplifier andrecorder: Amplifier amplies signal from detector and send to recorder. Recorder give graph of percentage of transmission versus wavelength or frequency. Wavenumber(cm-1) % Transmission 4. Detectors: a) Thermocouple: It uses two wires of different material welded together. b) Bolometer: Platinum or Nickel used to form Bolometer, it is resistance thermometer which measure weak thermometer radiation. c) Golay Detector: It is sensitive gas thermometer.
  • 45.
  • 46.
  • 47.
  • 48.
  • 49.
  • 50.
    6. Detection ofImpurities: IR spectra Of Impure Compound Show extra absorption bands. By comparing IR spectra of pure compound and presence of impurity can be detected. Eg. Presences of cyclohexanone in cyclohexanol can be detected presence by carbonyl absorption band. 7. Determination of size of ring ketones: Ring strains in cyclic ketones shifts carbonyl group stretching frequency to higher wavelength. Angle strain in ring causes carbonyl group to have more electron density and shift bonds. Eg. Cyclopropanone = 1818 cm-1 Cyclobutanone = 1775 cm-1 Cyclopentanone = 1740 cm-1 Cyclohexanone = 1710 cm-1