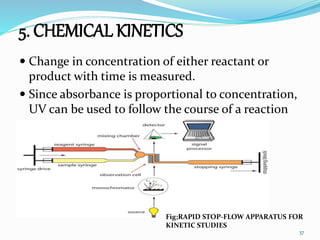
This document discusses various topics related to UV-visible spectroscopy including:
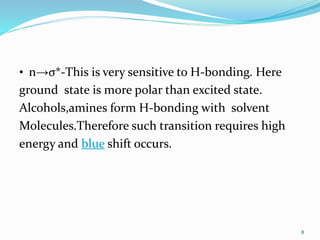
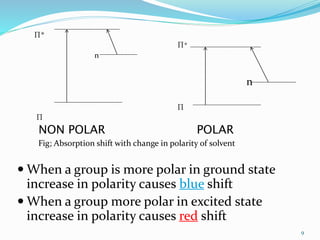
1. Choice of solvents and their effects on UV-visible spectra. Polar solvents can cause red or blue shifts in absorption maxima depending on the solute.
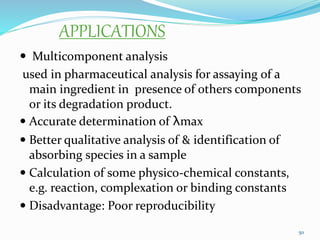
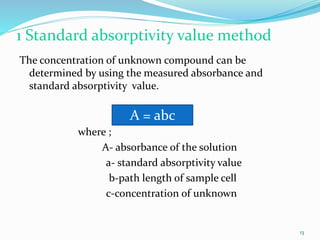
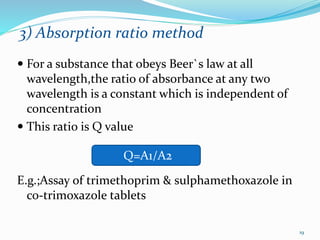
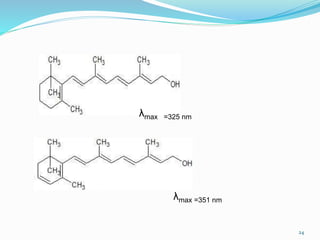
2. Applications of UV-visible spectroscopy like quantitative analysis of single and multiple component samples and qualitative analysis through structural elucidation, detection of functional groups, and identification of compounds.
3. Difference spectroscopy, where the difference in absorbance between two samples is measured to improve selectivity in the presence of interfering absorbers.


![4.DETERMINATIONOF DISSOCIATION COSTANT of
indicators
RH R- + H+ RH=Indicator
Concentration vs. absorbance at different pH is
plotted and pKa can be calculated from the
equation.
pKa = pH – (log [R-]/[RH])
36](https://image.slidesharecdn.com/uvvisible-190926141832/85/UV-Visible-spectroscopy-36-320.jpg)