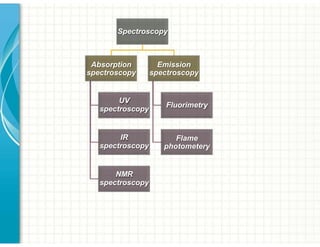
UV/Visible spectroscopy involves the interaction of electromagnetic radiation in the ultraviolet-visible spectral region with matter. Key points:
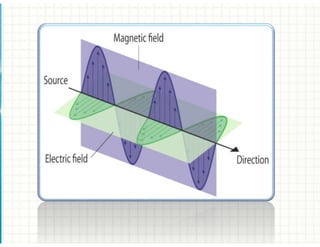
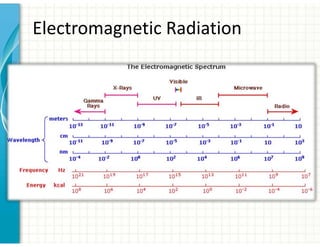
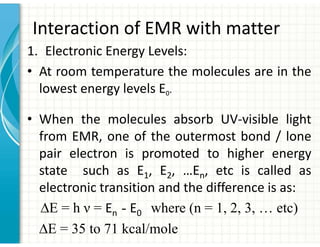
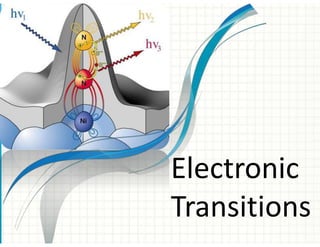
1. Electromagnetic radiation consists of photons that interact with molecules through electronic, vibrational, and rotational energy transitions.
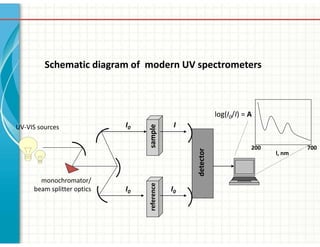
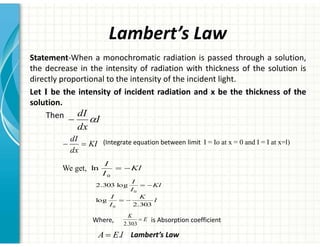
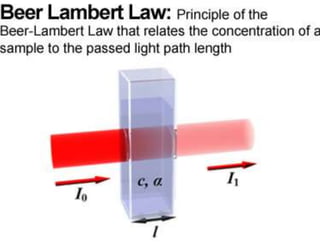
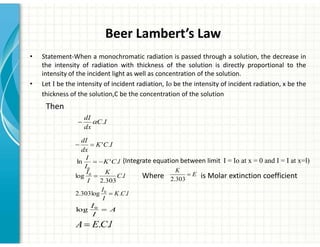
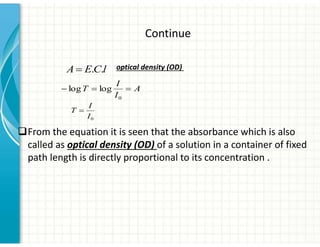
2. UV/Vis spectroscopy follows Beer's law - absorbance is directly proportional to concentration and path length. It can be used to determine concentrations.
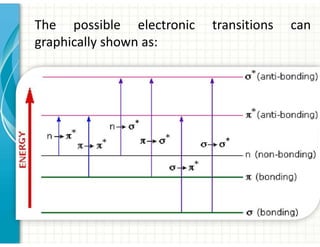
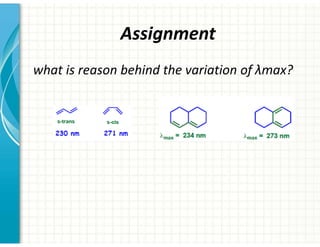
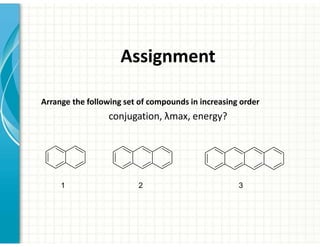
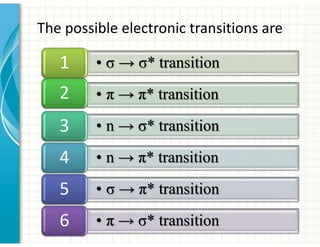
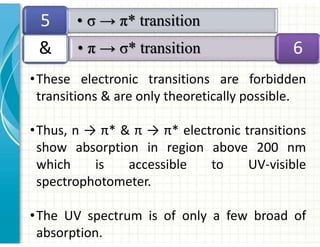
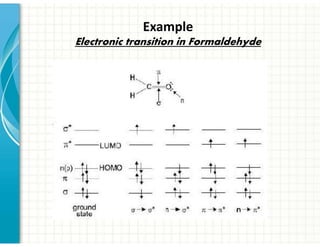
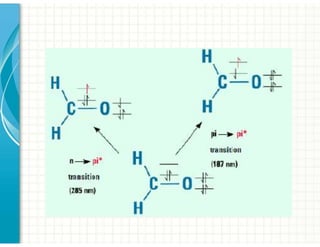
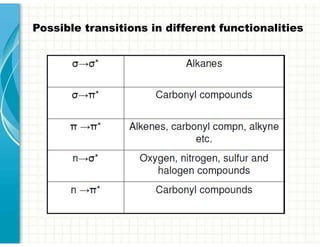
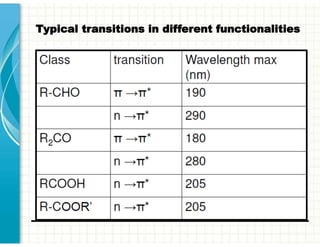
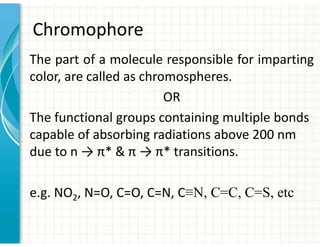
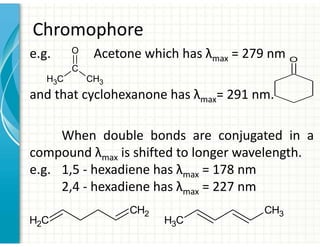
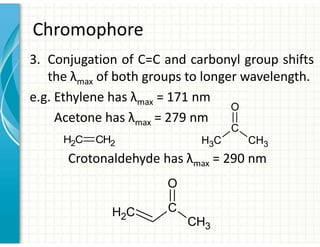
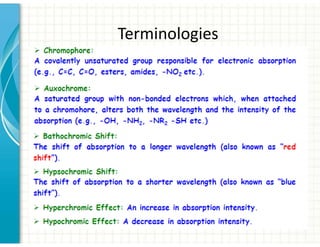
3. Chromophores are functional groups that absorb UV-Vis radiation through n→π* and π→π* transitions. Common chromophores include C=O, C=C, C≡N.
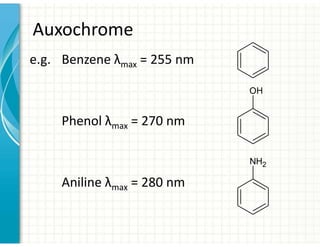
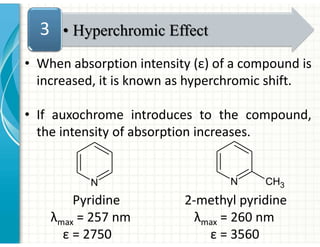
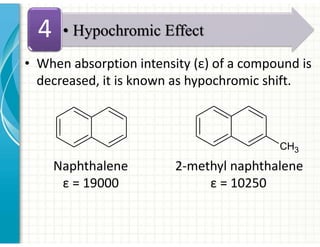
4. Auxochromes are functional groups that modify the absorption properties of chromoph