Introduction,Instrumentation, Classification of electronic transitions, Substituent and solvent effects, Classification of electronic transitions
Substituent and solvent effects
Applications of UV Spectroscopy
UV spectral study of alkenes
UV spectral study of poylenes
UV spectral study of α, β-unsaturated carbonyl
UV spectral study of Aromatic compounds
Empirical rules for calculating λmax.
Applications of UV Spectroscopy, Empirical rules for calculating λmax.
Ultraviolet–visible spectroscopy or ultraviolet-visible spectrophotometry (UV-Vis or UV/Vis) refers to absorption spectroscopy or reflectance spectroscopy in the ultraviolet-visible spectral region. This means it uses light in the visible and adjacent ranges.
IR SPECTROSCOPY, INTRODUCTION, PRINCIPLE, THEORY, FATE OF ABSORBED RADIATION, FERMI RESONANCE, FINGERPRINT REGION, VIBRATIONS, FACTORS AFFECTING ABSORPTION OF IR RADIATION, SAMPLING TECHNIQUES, APPLICATIONS OF IR SPECTROSCOPY.
principle, application and instrumentation of UV- visible Spectrophotometer Ayetenew Abita Desa
This Presentation powerpoint includes the principle, application, and instrumentation of UV- Visible Spectrophotometer. It covers beer-lambert low and its quantitative applications. It also includes the qualitative applications in different fields of study. Presented at Addis Ababa University, School of medicine, department of medical biochemistry.
Ultraviolet-visible spectroscopy or ultraviolet-visible spectrophotometry (UV-Vis or UV/Vis) refers to absorption spectroscopy or reflectance spectroscopy in the ultraviolet-visible spectral region. Ultraviolet-Visible (UV-VIS) Spectroscopy is an analytical method that can measure the analyte quantity depending on the amount of light received by the analyte.
The detailed information of UV Visible Spectroscopy, it includes the information regarding electronic transitions, Electromagnetic radiations, Various shifts.
UV - Visible Spectroscopy detailed information is included .The Spectroscopy study provide the information and the absorbance as well the concentration of the drugs is studied.
Communication in Insects.
Classification of Semiochemicals.
Introduction to Insect Pheromones.
Uses of Insect Pheromones.
Synthesis of Insect Pheromones.
Use of pheromones in insect pest management.
DRUG DISCOVERY
Drug Discovery without a lead
LEAD DISCOVERY/IDENTIFICATION
LEAD MODIFICATION
CONCEPT OF PRODRUGS AND SOFT DRUGS
DRUG RECEPTOR INTERACTIONS
TLC-Introduction, Principle, Procedure, and Applications.
Paper Chromatography-Introduction, Principle, Procedure, and Applications.
Column Chromatography-Introduction, Principle, Procedure, and Applications.
Introduction, Basic Principles, Terminology, Instrumentation, Ionization techniques (EI, CI, FAB, MALDI, and ESI), Mass Analyzer (Magnetic sector instruments, Quadrupole, TOF, and ICR ), and Applications of Mass Spectrometry.
Introduction to Spectroscopy,
Introduction to UV, electronic transitions, terminology, chromophore, Auxochrome, Examples and Applications.
Introduction to IR, Fundamental vibrations, Types of Vibrations, Factors affecting the vibrational freaquencies, Group frequencies, examples and applications.
Applications of Infrared spectroscopy
Identification of organic compounds,
Structure determination
Qualitative analysis of functional group
Quantitative analysis
Distinction between two types of hydrogen bonding
Study of chemical reaction
Study of Keto-Enol tautomerism
Conformational analysis
Geometrical isomerism
Study of complex molecules
Detection of impurity in a compound
Identification of the organic compounds by IR
Hydrocarbons, Aromatic compounds, Alcohol, Phenols, Ethers, Aldehydes, Ketones, Esters, Acid chlorides, Anhydrides, Amides, Amines, Nitriles, Isocynates, Isothiocynates, Imines and Nitro compounds.
Introduction
Instrumentation
Sampling techniques
Group frequencies
Factors affecting group frequencies
Complementarity of IR and Raman spectroscopy
Applications of Infrared spectroscopy
This pdf is about the Schizophrenia.
For more details visit on YouTube; @SELF-EXPLANATORY;
https://www.youtube.com/channel/UCAiarMZDNhe1A3Rnpr_WkzA/videos
Thanks...!
Richard's aventures in two entangled wonderlandsRichard Gill
Since the loophole-free Bell experiments of 2020 and the Nobel prizes in physics of 2022, critics of Bell's work have retreated to the fortress of super-determinism. Now, super-determinism is a derogatory word - it just means "determinism". Palmer, Hance and Hossenfelder argue that quantum mechanics and determinism are not incompatible, using a sophisticated mathematical construction based on a subtle thinning of allowed states and measurements in quantum mechanics, such that what is left appears to make Bell's argument fail, without altering the empirical predictions of quantum mechanics. I think however that it is a smoke screen, and the slogan "lost in math" comes to my mind. I will discuss some other recent disproofs of Bell's theorem using the language of causality based on causal graphs. Causal thinking is also central to law and justice. I will mention surprising connections to my work on serial killer nurse cases, in particular the Dutch case of Lucia de Berk and the current UK case of Lucy Letby.
Nutraceutical market, scope and growth: Herbal drug technologyLokesh Patil
As consumer awareness of health and wellness rises, the nutraceutical market—which includes goods like functional meals, drinks, and dietary supplements that provide health advantages beyond basic nutrition—is growing significantly. As healthcare expenses rise, the population ages, and people want natural and preventative health solutions more and more, this industry is increasing quickly. Further driving market expansion are product formulation innovations and the use of cutting-edge technology for customized nutrition. With its worldwide reach, the nutraceutical industry is expected to keep growing and provide significant chances for research and investment in a number of categories, including vitamins, minerals, probiotics, and herbal supplements.
Slide 1: Title Slide
Extrachromosomal Inheritance
Slide 2: Introduction to Extrachromosomal Inheritance
Definition: Extrachromosomal inheritance refers to the transmission of genetic material that is not found within the nucleus.
Key Components: Involves genes located in mitochondria, chloroplasts, and plasmids.
Slide 3: Mitochondrial Inheritance
Mitochondria: Organelles responsible for energy production.
Mitochondrial DNA (mtDNA): Circular DNA molecule found in mitochondria.
Inheritance Pattern: Maternally inherited, meaning it is passed from mothers to all their offspring.
Diseases: Examples include Leber’s hereditary optic neuropathy (LHON) and mitochondrial myopathy.
Slide 4: Chloroplast Inheritance
Chloroplasts: Organelles responsible for photosynthesis in plants.
Chloroplast DNA (cpDNA): Circular DNA molecule found in chloroplasts.
Inheritance Pattern: Often maternally inherited in most plants, but can vary in some species.
Examples: Variegation in plants, where leaf color patterns are determined by chloroplast DNA.
Slide 5: Plasmid Inheritance
Plasmids: Small, circular DNA molecules found in bacteria and some eukaryotes.
Features: Can carry antibiotic resistance genes and can be transferred between cells through processes like conjugation.
Significance: Important in biotechnology for gene cloning and genetic engineering.
Slide 6: Mechanisms of Extrachromosomal Inheritance
Non-Mendelian Patterns: Do not follow Mendel’s laws of inheritance.
Cytoplasmic Segregation: During cell division, organelles like mitochondria and chloroplasts are randomly distributed to daughter cells.
Heteroplasmy: Presence of more than one type of organellar genome within a cell, leading to variation in expression.
Slide 7: Examples of Extrachromosomal Inheritance
Four O’clock Plant (Mirabilis jalapa): Shows variegated leaves due to different cpDNA in leaf cells.
Petite Mutants in Yeast: Result from mutations in mitochondrial DNA affecting respiration.
Slide 8: Importance of Extrachromosomal Inheritance
Evolution: Provides insight into the evolution of eukaryotic cells.
Medicine: Understanding mitochondrial inheritance helps in diagnosing and treating mitochondrial diseases.
Agriculture: Chloroplast inheritance can be used in plant breeding and genetic modification.
Slide 9: Recent Research and Advances
Gene Editing: Techniques like CRISPR-Cas9 are being used to edit mitochondrial and chloroplast DNA.
Therapies: Development of mitochondrial replacement therapy (MRT) for preventing mitochondrial diseases.
Slide 10: Conclusion
Summary: Extrachromosomal inheritance involves the transmission of genetic material outside the nucleus and plays a crucial role in genetics, medicine, and biotechnology.
Future Directions: Continued research and technological advancements hold promise for new treatments and applications.
Slide 11: Questions and Discussion
Invite Audience: Open the floor for any questions or further discussion on the topic.
A brief information about the SCOP protein database used in bioinformatics.
The Structural Classification of Proteins (SCOP) database is a comprehensive and authoritative resource for the structural and evolutionary relationships of proteins. It provides a detailed and curated classification of protein structures, grouping them into families, superfamilies, and folds based on their structural and sequence similarities.
(May 29th, 2024) Advancements in Intravital Microscopy- Insights for Preclini...Scintica Instrumentation
Intravital microscopy (IVM) is a powerful tool utilized to study cellular behavior over time and space in vivo. Much of our understanding of cell biology has been accomplished using various in vitro and ex vivo methods; however, these studies do not necessarily reflect the natural dynamics of biological processes. Unlike traditional cell culture or fixed tissue imaging, IVM allows for the ultra-fast high-resolution imaging of cellular processes over time and space and were studied in its natural environment. Real-time visualization of biological processes in the context of an intact organism helps maintain physiological relevance and provide insights into the progression of disease, response to treatments or developmental processes.
In this webinar we give an overview of advanced applications of the IVM system in preclinical research. IVIM technology is a provider of all-in-one intravital microscopy systems and solutions optimized for in vivo imaging of live animal models at sub-micron resolution. The system’s unique features and user-friendly software enables researchers to probe fast dynamic biological processes such as immune cell tracking, cell-cell interaction as well as vascularization and tumor metastasis with exceptional detail. This webinar will also give an overview of IVM being utilized in drug development, offering a view into the intricate interaction between drugs/nanoparticles and tissues in vivo and allows for the evaluation of therapeutic intervention in a variety of tissues and organs. This interdisciplinary collaboration continues to drive the advancements of novel therapeutic strategies.
Richard's entangled aventures in wonderlandRichard Gill
Since the loophole-free Bell experiments of 2020 and the Nobel prizes in physics of 2022, critics of Bell's work have retreated to the fortress of super-determinism. Now, super-determinism is a derogatory word - it just means "determinism". Palmer, Hance and Hossenfelder argue that quantum mechanics and determinism are not incompatible, using a sophisticated mathematical construction based on a subtle thinning of allowed states and measurements in quantum mechanics, such that what is left appears to make Bell's argument fail, without altering the empirical predictions of quantum mechanics. I think however that it is a smoke screen, and the slogan "lost in math" comes to my mind. I will discuss some other recent disproofs of Bell's theorem using the language of causality based on causal graphs. Causal thinking is also central to law and justice. I will mention surprising connections to my work on serial killer nurse cases, in particular the Dutch case of Lucia de Berk and the current UK case of Lucy Letby.
2. Contents:
1. Introduction
2. Instrumentation
3. Classification of electronic transitions
4. Substituent and solvent effects
5. Applications of UV Spectroscopy
6. UV spectral study of alkenes
7. UV spectral study of poylenes
8. UV spectral study of α, β-unsaturated carbonyl
9. UV spectral study of Aromatic compounds
10. Empirical rules for calculating λmax.
3. •The term "spectroscopy" defines a large number of techniques
that use radiation to obtain information on the structure and
properties of matter.
•The basic principle shared by all spectroscopic techniques is to
shine a beam of electromagnetic radiation onto a sample, and
observe how it responds to such stimulus.
•The response is usually recorded as a function of radiation
wavelength.
•A plot of the response as a function of wavelength is referred to
as a spectrum.
INTRODUCTION
5. 1. Electromagnetic radiation displays the properties of
both particles and waves
2. The particle component is called a photon
3. The energy (E) component of a photon is proportional
to the frequency . Where h is Planck’s constant and υ is
the frequency in Hertz (cycles per second)
E = hν
4. The term “photon” is implied to mean a small, massless
particle that contains a small wave-packet of EM
radiation/light.
6. Ultraviolet radiation stimulates molecular vibrations and
electronic transitions.
Absorption spectroscopy from 160 nm to 780 nm.
Measurement absorption or transmittance.
Identification of inorganic and organic species.
UV-Vis Spectroscopy
7. UV/VIS SPECTROSCOPY
Visible (380-780 nanometers).
Ultraviolet (UV) (10 – 380 nanometers).
Below 200 nm, air absorbs the UV light and instruments must be
operated under a vacuum
8. Principle of UV-Visible Spectroscopy
•UV spectroscopy is type of absorption spectroscopy in which light
of ultra-violet region (200-400 nm) is absorbed by the molecule
which results in the excitation of the electrons from the ground
state to higher energy state.
•Molecules containing π-electrons or non-bonding electrons (n-
electrons) can absorb energy in the form of ultraviolet light to
excite these electrons to higher anti-bonding molecular orbital's.
•The absorption of ultraviolet light by a chemical compound will
produce a distinct spectrum which aids in the identification of the
compound.
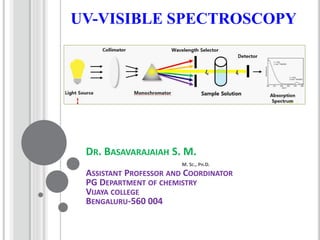
9. INSTRUMENTATION
Light Source:
•Tungsten filament lamps and Hydrogen-Deuterium lamps are
most widely used and suitable light source as they cover the
whole UV region.
•Tungsten filament lamps are rich in red radiations; more
specifically they emit the radiations of 375 nm, while the intensity
of Hydrogen-Deuterium lamps falls below 375 nm.
Note: Most of the spectrophotometers are double beam spectrophotometers.
10. Monochromator:
•Monochromators generally is composed of prisms and slits.
•The radiation emitted from the primary source is dispersed with the
help of rotating prisms.
•The various wavelengths of the light source which are separated by
the prism are then selected by the slits such the rotation of the prism
results in a series of continuously increasing wavelength to pass
through the slits for recording purpose.
•The beam selected by the slit is monochromatic and further divided
into two beams with the help of another prism.
11. Sample and reference cells:
•One of the two divided beams is passed through the sample solution and
second beam is passed through the reference solution.
•Both sample and reference solution are contained in the cells.
•These cells are made of either silica or quartz. Glass can’t be used for the
cells as it also absorbs light in the UV region.
Detector:
•Generally two photocells serve the purpose of detector in UV spectroscopy.
•One of the photocell receives the beam from sample cell and second
detector receives the beam from the reference.
•The intensity of the radiation from the reference cell is stronger than the
beam of sample cell. This results in the generation of pulsating or alternating
currents in the photocells.
12. Amplifier:
•The alternating current generated in the photocells is transferred to
the amplifier.
•The amplifier is coupled to a small servometer.
•Generally current generated in the photocells is of very low
intensity, the main purpose of amplifier is to amplify the signals
many times so we can get clear and recordable signals.
Recording devices:
•Most of the time amplifier is coupled to a pen recorder which is
connected to the computer.
•Computer stores all the data generated and produces the spectrum
of the desired compound.
13. Electronic transitions
The absorption of UV or visible radiation corresponds to the
excitation of outer electrons. There are three types of electronic
transition which can be considered;
•Transitions involving π, σ, and n electrons
•Transitions involving charge-transfer electrons
•Transitions involving d and f electrons (not covered in this Unit)
CLASSIFICATION OF ELECTRONIC TRANSITIONS
14. •When an atom or molecule absorbs energy, electrons are promoted
from their ground state to an excited state.
•In a molecule, the atoms can rotate and vibrate with respect to each
other.
•These vibrations and rotations also have discrete energy levels, which
can be considered as being packed on top of each electronic level.
16. σ σ* Transitions:
An electron in a bonding s orbital is excited to the corresponding
antibonding orbital. The energy required is large. For example, methane
(which has only C-H bonds, and can only undergo σσ* transitions)
shows an absorbance maximum at 125 nm. Absorption maxima due
to σσ* transitions are not seen in typical UV-Vis. spectra (200 - 700 nm).
nσ* Transitions:
Saturated compounds containing atoms with lone pairs (non-bonding
electrons) are capable of nσ* transitions. These transitions usually need
less energy than nσ* transitions. They can be initiated by light whose
wavelength is in the range 150 - 250 nm. The number of organic functional
groups with nσ* peaks in the UV region is small.
17. n π* and ππ* Transitions:
Most absorption spectroscopy of organic compounds is based on
transitions of n or π electrons to the π* excited state. This is
because the absorption peaks for these transitions fall in an
experimentally convenient region of the spectrum (200 - 700 nm).
These transitions need an unsaturated group in the molecule to
provide the p electrons.
Note: Molar absorbtivities from n π* transitions are relatively
low, and range from 10 to100 L mol-1 cm-1. ππ* transitions
normally give molar absorbtivities between 1000 and 10,000 L
mol-1 cm-1 .
18. SUBSTITUENT AND SOLVENT EFFECTS
•The solvent in which the absorbing species is dissolved also has an effect on the
spectrum of the species.
•Peaks resulting from nπ* transitions are shifted to shorter wavelengths (blue shift)
with increasing solvent polarity.
•This arises from increased solvation of the lone pair, which lowers the energy of
the n orbital. Often (but not always), the reverse (i.e. red shift) is seen for π
π* transitions.
•This is caused by attractive polarisation forces between the solvent and the
absorber, which lowers the energy levels of both the excited and unexcited states.
•This effect is greater for the excited state, and so the energy difference between the
excited and unexcited states is slightly reduced-resulting in a small red shift. This
effect also influences n π* transitions but is overshadowed by the blue shift
resulting from solvation of lone pairs.
22. 1.Bathochromic Shift or Red shift: A shift of an
absorption maximum towards longer wavelength (λ) or
lower energy (E).
2. Hypsochromic Shift or Blue Shift: A shift of an
absorption maximum towards shorter wavelength (λ)
or higher energy (E).
3.Hyperchromic Effect: An effect that results in
increased absorption intensity (ε).
4.Hypochromic Effect: An effect that results in
decreased absorption intensity (ε).
23.
24. Applications of UV Spectroscopy
Detection of Impurities
•It is one of the best methods for determination of impurities in organic
molecules.
•Additional peaks can be observed due to impurities in the sample and
it can be compared with that of standard raw material.
•By also measuring the absorbance at specific wavelength, the
impurities can be detected.
Structure elucidation of organic compounds
It is useful in the structure elucidation of organic molecules, such as in
detecting the presence or absence of unsaturation, the presence of
hetero atoms.
25. UV absorption spectroscopy can be used for the quantitative
determination of compounds that absorb UV radiation.
UV absorption spectroscopy can characterize those types of
compounds which absorbs UV radiation thus used in qualitative
determination of compounds. Identification is done by comparing the
absorption spectrum with the spectra of known compounds.
This technique is used to detect the presence or absence of
functional group in the compound. Absence of a band at particular
wavelength regarded as an evidence for absence of particular group.
Kinetics of reaction can also be studied using UV spectroscopy. The
UV radiation is passed through the reaction cell and the absorbance
changes can be observed.
26. Many drugs are either in the form of raw material or in the form of
formulation. They can be assayed by making a suitable solution of
the drug in a solvent and measuring the absorbance at specific
wavelength.
Molecular weights of compounds can be measured
spectrophotometrically by preparing the suitable derivatives of these
compounds.
UV spectrophotometer may be used as a detector for HPLC.
27. Again, demonstrates the moieties contributing to absorbance
from 200-800 nm, because π electron functions and atoms
having no bonding valence shell electron pairs.
UV SPECTRAL STUDY OF ALKENES
37. Empirical Rules for Calculating λmax
Woodward-Fieser Rules for Calculating λmax in Conjugated
Dienes and Trienes
Woodward (1941) formulated a set of empirical rules for
calculating or predicting λmax in conjugated acyclic and six-
membered ring dienes. These rules, modified by Fieser and Scott
on the basis of wide experience with dienes and trienes, are called
Woodward-Fieser rules and are summarized in next Table. First,
we discuss the following terms used in Woodward-Fieser rules.
38.
39. Homoannular Dienes
•In homoannular dienes, conjugated double bonds are present in the
same ring and having s-cis (cisoid) configuration (s = single bond
joining the two doubly bonded carbon atoms).
•The s-cis configuration causes strain which raises the ground state
energy Ievel of the molecule leaving the high energy excited state
relatively unchanged. Thus, the transition energy is lowered resulting
in the shift of absorption position to a longer wavelength.
In compounds containing both homoanular and heteroannular diene systems, the
calculations are based on the longer wavelength (253 nm), i.e. the homoannular
diene system.
40. Heteroannular Dienes:
In heteroannular dienes, conjugated double bonds are not present in
the same ring and these have s-trans (transoid) configurations:
Exocyclic Conjugated Double Bonds:
The carbon-carbon double bonds projecting outside a ring are
called exocyclic double bonds. For example
Note that the same double bond may be exocyclic to one ring, while
endocyclic to the other and sometimes the same double bond may be
exocyclic to two rings simultaneously.
41. Alkyl Substituents and Ring Residues:
Only the alkyl substituents and ring residues attached to the carbon
atoms constituting the conjugated system of the compound are taken
into account. Following examples indicate such carbon atoms by
numbers and the alkyl substituents and ring residues by dotted lines:
44. Base value=253 (homoannular)
4 ring residues =4X5=20
2 exoyclic bond=2X5=10
Thus λmax = 283 nm
Base value=214
(heteroannular)
4 ring residues =4X5=20
1 exoyclic bond=1X5=5
Thus λmax = 239 nm
1. Which of the following alkenes would have the largest λmax?
45. Fieser-Kuhn rule is used to calculate λmax for Polyenes
According to the Fieser-Kuhn rule the following equation can be
used to solve for the wavelength of maximum absorption λmax and
also maximum absorptivity εmax:
λmax = 114 + 5M + n (48.0 – 1.7 n) – 16.5 Rendo – 10 Rexo
where,
λmax is the wavelength of maximum absorption
M is the number of alkyl substituents / ring residues in the conjugated system
n is the number of conjugated double bonds
Rendo is the number of rings with endocyclic double bonds in the conjugated system
Rexo is the number of rings with exocyclic double bonds in the conjugated system.
εmax = (1.74 x 10⁴) n
where,
εmax is the maximum absorptivity
n is the number of conjugated double bonds
46. Name of Compound β-Carotene
Base Value 114 nm
M (number of alkyl substituents) 10
n (number of conjugated double bonds) 11
Rendo (number of endocyclic double bonds) 2
Rexo (number of exocyclic double bonds) 0
Substituting in equation
λmax = 114 + 5M + n (48.0 – 1.7 n) – 16.5 Rendo –
10 Rexo
= 114 + 5(10) + 11 (48.0-1.7(11)) – 16.5 (2) – 10
(0)= 114 + 50 + 11 (29.3) – 33 – 0= 114 + 50 +
322.3 – 33
Calc. λmax = 453.30 nm
λmax observed practically 452nm
Calculate εmax using equation:
εmax = (1.74 x 10⁴) n
= (1.74 x 10⁴) 11Calc. εmax= 19.14 x 10⁴
Practically observed εmax 15.2 x 10⁴
47. Name of Compound all-trans-lycophene
Base Value 114 nm
M (number of alkyl substituents) 8
n (number of conjugated double bonds) 11
Rendo (number of endocyclic double bonds) 0
Rexo (number of exocyclic double bonds) 0
Substituting in equation
λmax = 114 + 5M + n (48.0 – 1.7 n) – 16.5 Rendo – 10
Rexo
= 114 + 5(8) + 11 (48.0-1.7(11)) – 16.5 (0) – 10 (0)=
114 + 40 + 11 (29.3) – 0 – 0= 114 + 40 + 322.3 – 0
Calc. λmax = 476.30 nm
λmax observed practically 474nm
Calculate εmax using equation:
εmax = (1.74 x 10⁴) n
= (1.74 x 10⁴) 11Calc. εmax= 19.14 x 10⁴
Practically observed εmax 18.6 x 10⁴
48. Name of Compound Retinol
Base Value 114 nm
M (number of alkyl substituents) 5
n (number of conjugated double bonds) 5
Rendo (number of endocyclic double bonds) 1
Rexo (number of exocyclic double bonds) 0
Substituting in equation
λmax = 114 + 5M + n (48.0 – 1.7 n) – 16.5
Rendo – 10 Rexo
= 114 + 5(5) + 5 (48.0-1.7(5)) – 16.5 (1) – 10
(0)
= 114 + 25 + 5 (39.5) – 16.5 – 0
= 114 + 25 + 197.5 – 16.5 – 0
Calc. λmax = 320 nm
λmax observed practically 325 nm
Calculate εmax using equation:
εmax = (1.74 x 10⁴) n
= (1.74 x 10⁴) 5Calc. εmax= 8.7 x 10⁴
Practically observed εmax N/A
49. Woodward-Fieser Rules for Calculating λmax in
α, β Unsaturated Carbonyl Compounds
•Compounds containing a carbonyl group (C=O) in conjugation with
an ethylenic groups (C=C) are called enones.
•UV spectra of enones are characterized by an intense absorption
band (K-band) due to ππ* transition in the range 215-250 nm (εmax
usually 10,000-20,000) and a weak R-band due to nπ * transition
in 310-330 nm region (εmax usually 10-100).
•Similar to dienes and trienes, there are set rules called Woodward-
Fieser rules for calculating or predicting λmax in α, β -unsaturated
carbonyl compounds (enones).
•These rules first framed by Woodward and modified by Fieser and
by Scott are given in Table.
54. Woodward-Fieser Rule for benzene and its derivatives
Like Woodward-Fieser rules, Scott formulated a set of rules for
calculating the absorption maximum of the primary absorption
band of aromatic aldehydes, ketones, carboxylic acids and esters.
In the absence of steric hindrance to co-planarity, the calculated
values are within + 5 nm of the observed value.
1. Base values for:
a) ArCOR = 246 nm
b) ArCHO = 250 nm
c) ArCO2H = 230 nm
d) ArCO2R = 230 nm
55. 2. Increment for substituents:
Substituents Ortho
In nm
Meta
In nm
Para
In nm
Alkyl group or ring residue 3 nm 3 nm 10 nm
–OH, –OCH3, –OAlkyl 7 7 25
–O (oxonium) 11 20 78
–Cl 0 0 10
–Br 2 2 15
–NH2 13 13 58
–NHCOCH3 20 20 45
-NHCH3 - - 73
-N(CH3 )2 20 20 85
56. Base value=246
2 m-OH=2 x 7=14
1 p-OH=1 x 25=25
Calc. λmax = 285 nm
Base value=246
Ring residue at ortho position =1 x 3=3
1 p-OCH3=1 x 25=25
Calc. λmax = 274 nm
Base value=246
2 o-O Alkyl=2 x 7=14
1 m-Cl=1 x 0=0
1 p-OCH3=1 25=25
Calc. λmax = 285 nm
57. 1. Calculate the λ max for the following molecules
O
O
CH3
CH3 O
Cl
CH3 CH3
O
1. 2. 3.
For Practice:
58. 2. Which molecule absorbs at the longest wavelength, 1,3-hexadiene
or 1,4-hexadiene?
3. Why the λmax for the diene (I) is observed at lower nm than (II).
(I) (II)
59. 4. What are the products of these reactions? Would you expect them
to have higher or lower λmax than the starting material?