Download to read offline

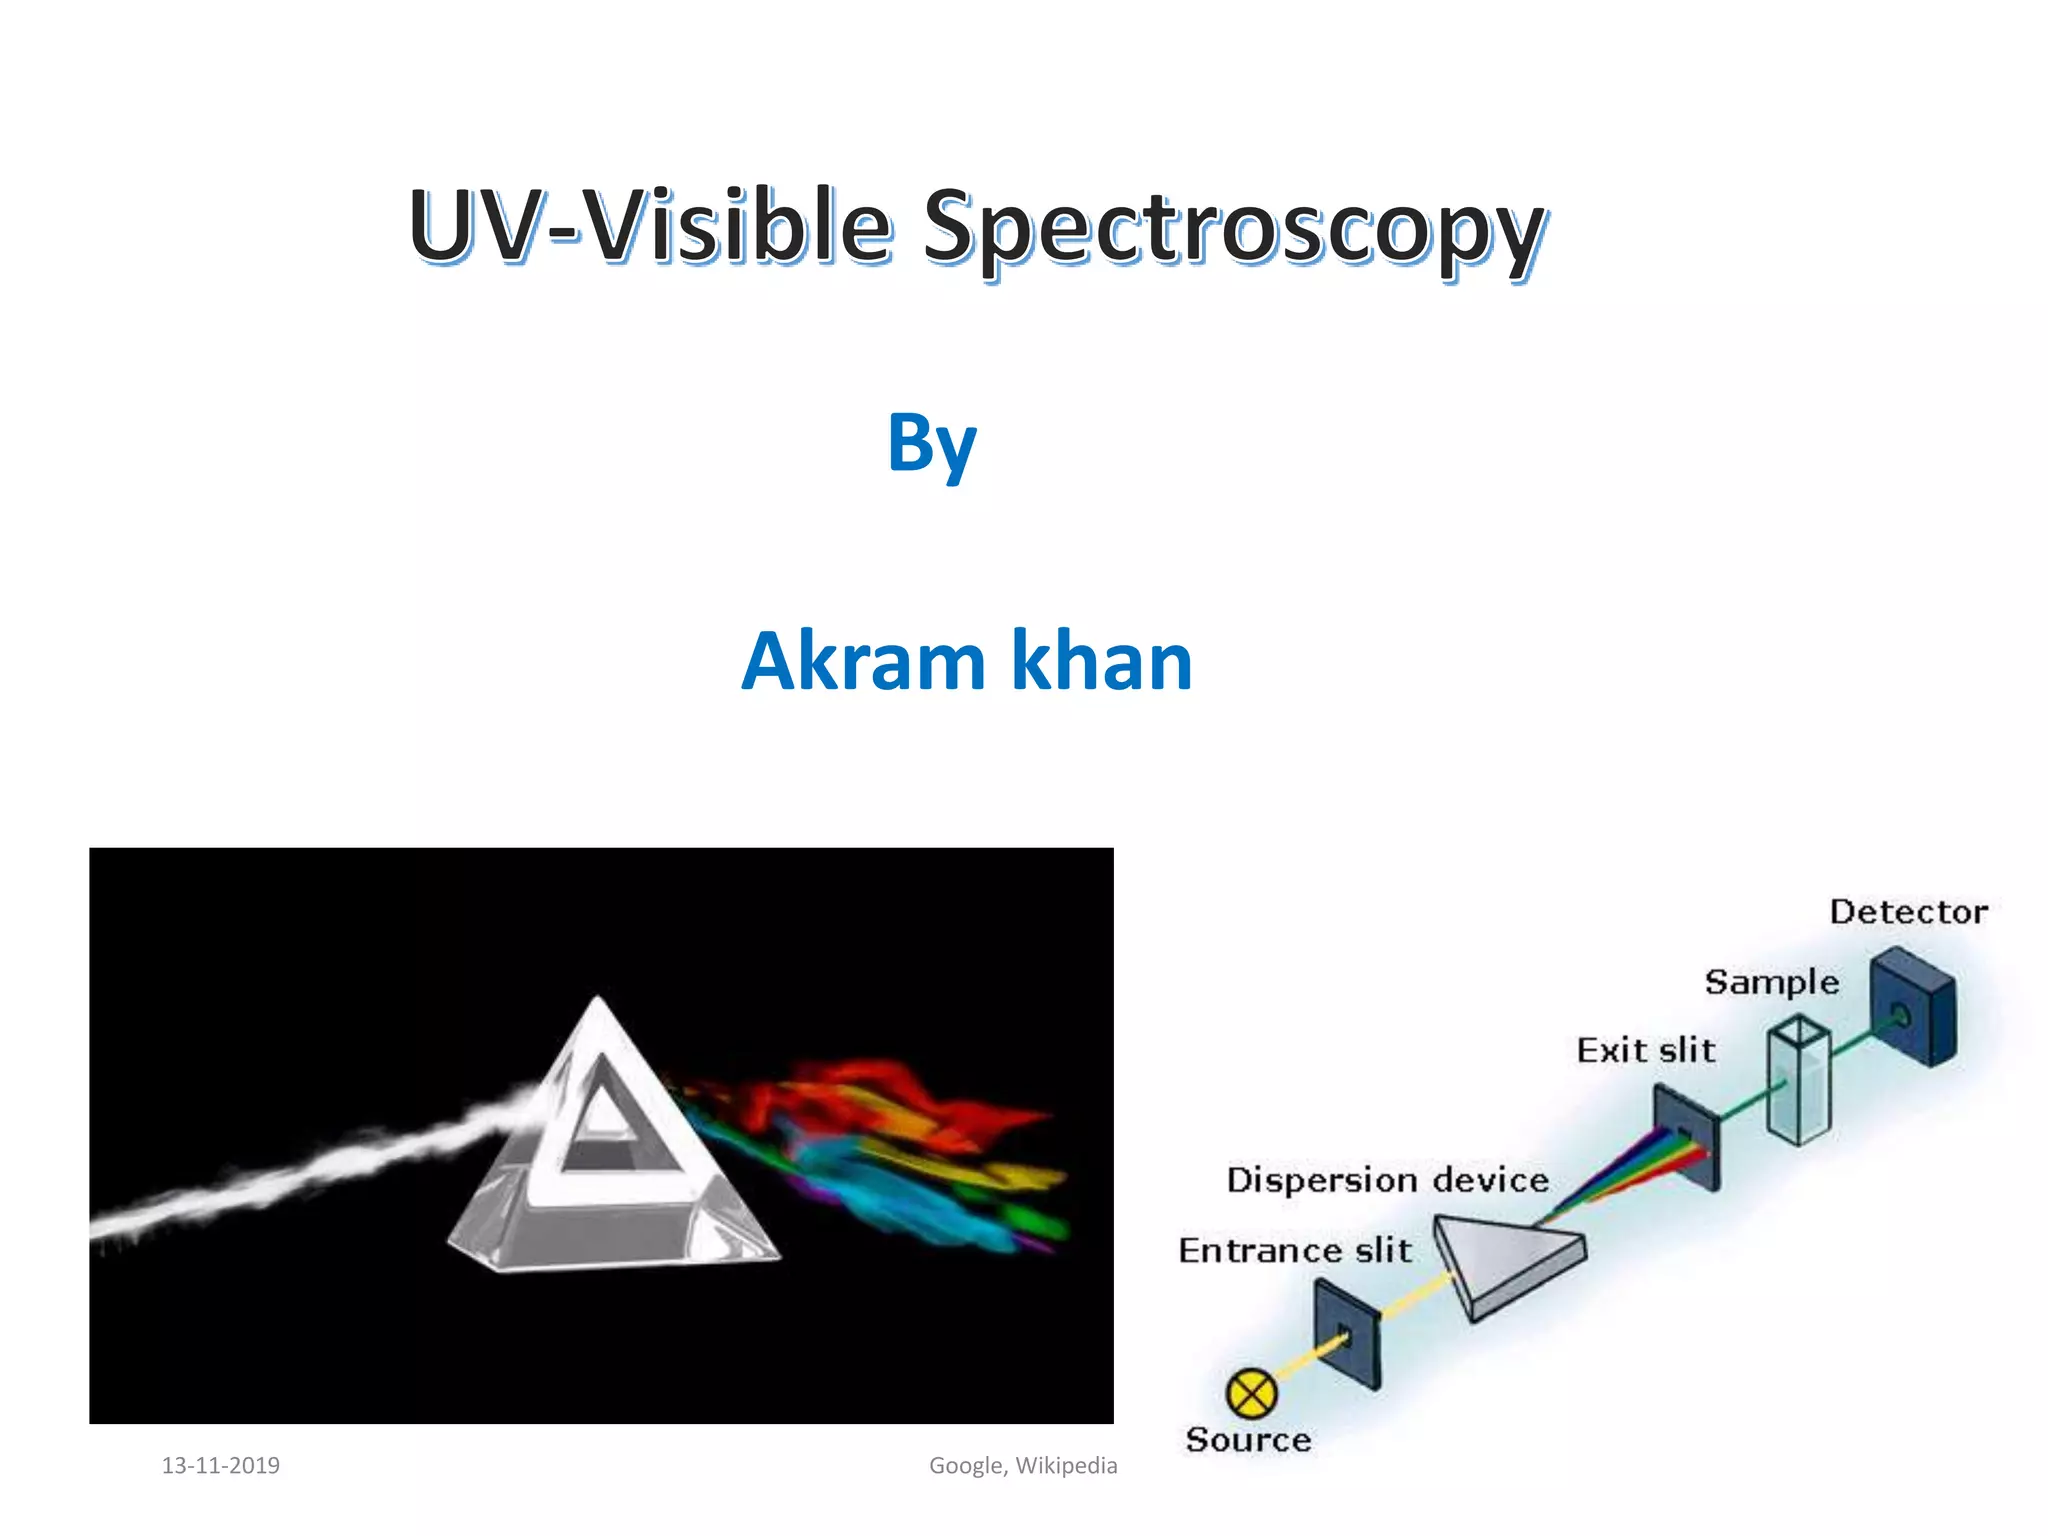
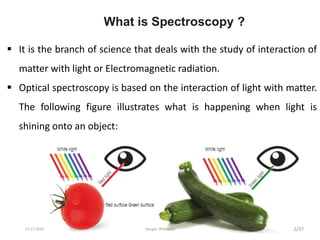
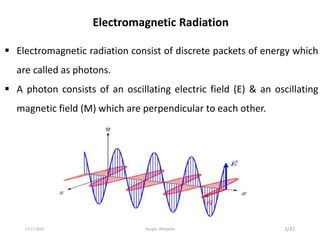
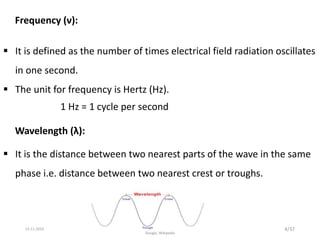
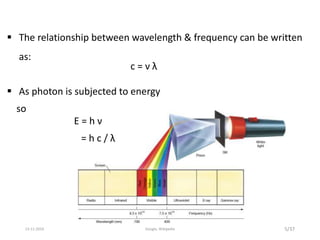
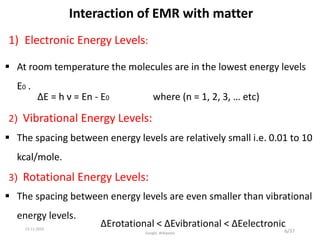

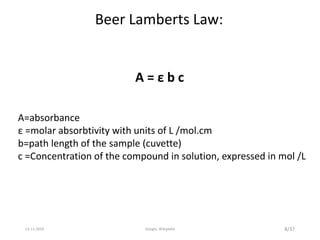
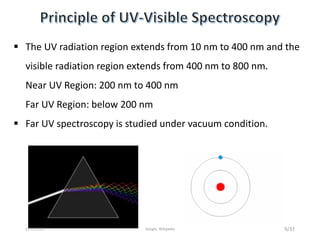
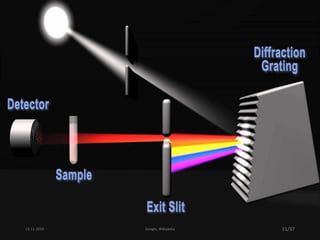
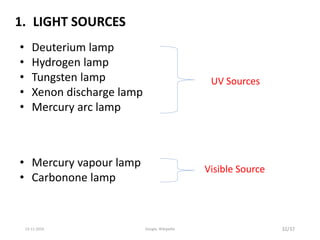
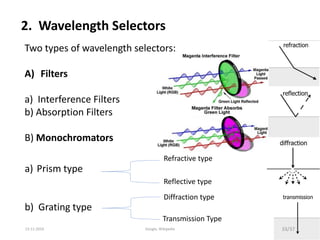


Spectroscopy is the study of interaction of matter with electromagnetic radiation. Optical spectroscopy uses light to study molecules. When light interacts with matter, photons may be absorbed, causing electronic transitions between energy levels. The frequency and wavelength of absorbed light are related to the energy levels. UV-visible spectroscopy analyzes absorption in the ultraviolet-visible range. It is used to identify compounds and study their structure based on characteristic absorption peaks. Factors like solvents, pH, and auxochromes can shift peaks. Instrumentation includes a light source, wavelength selector, sample compartment, and detector. Applications include detection of impurities, structure elucidation, and quantitative analysis.


