Downloaded 3,056 times


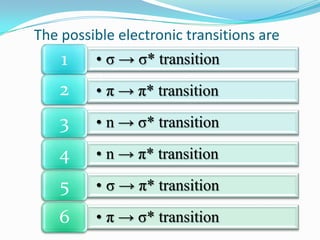

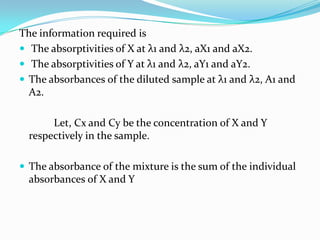
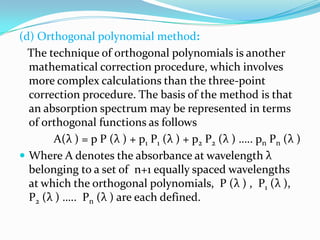
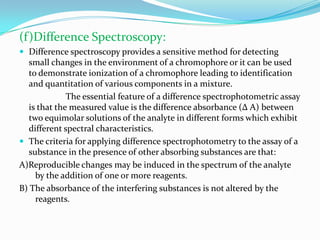
![ At λ1
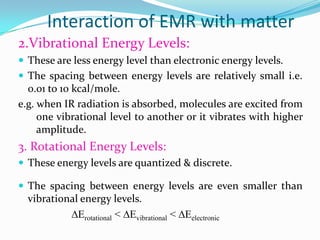
A1 = aX1* Cx + aY1* Cy …………… (1)
At λ2 A2 = aX2* Cx + aY2* Cy…………....(2)
Now divide (2) with (1)
A2/A1 = (aX2* Cx + aY2* Cy)/(aX1* Cx + aY1* Cy)
Divide each term with (Cx + Cy)
A2/A1 = (aX2* Cx + aY2* Cy) / (Cx + Cy) (aX1* Cx + aY1* Cy) / (Cx + Cy)
Put Fx = Cx / (Cx + Cy) and Fy = Cy / (Cx + Cy)
A2/A1 = [aX2 Fx + aY2 Fy] / [aX1 Fx + aY1Fy]
Where Fx is the fraction of X and Fy is the fraction of Y i.e. Fy = 1-Fx
Therefore,
A2/A1 = [aX2 Fx + aY2 (1-Fx)] / [aX1 Fx + aY1(1-Fx)]
= [aX2 Fx + aY2 – aY2Fx] / [aX1 Fx + aY1 – aY1Fx]](https://image.slidesharecdn.com/sudhareddyuv-visible1-140222105450-phpapp01/85/UV-Visible-Spectroscopy-58-320.jpg)
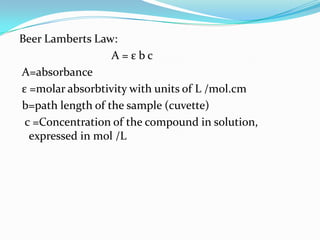
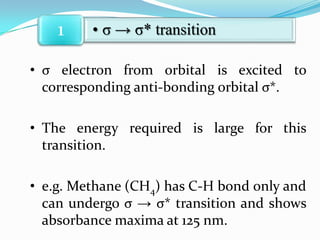
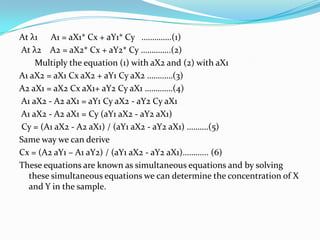
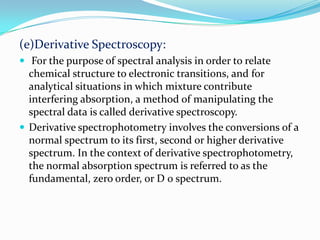
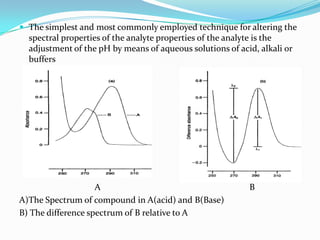
![At iso-absorptive point
aX1 = aY1 and Cx = Cy
There fore
A2/A1 = [aX2 Fx + aY2 – aY2Fx] / aX1
= (aX2 Fx/ aX1) + (aY2/ aX1) –( aY2Fx/ aX1)
Let Qx = aX2/aX1 , Qy = aY2/aY1 and absorption ratio Qm = A2/A1
Qm = Fx Qx + Qy - Fx Qy
= Fx (Qx-Qy) + Qy
Fx = (Qm – Qy) / (Qx – Qy) ………………………..(3)
From the equations (1) A1 = aX1 (Cx + Cy)
there fore Cx + Cy = A1 / aX1
There fore Cx = (A1/aX1) – Cy ……………………(4)
From the equation (3)
Cx / (Cx + Cy) = (Qm – Qy) / (Qx – Qy)
There fore
Cx / (A1 / aX1) = (Qm – Qy) / (Qx – Qy)
There fore
Cx = [(Qm – Qy) / (Qx – Qy)] X (A1 / aX1) …………(5)](https://image.slidesharecdn.com/sudhareddyuv-visible1-140222105450-phpapp01/85/UV-Visible-Spectroscopy-59-320.jpg)


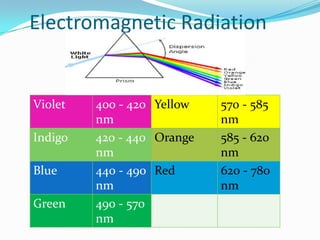
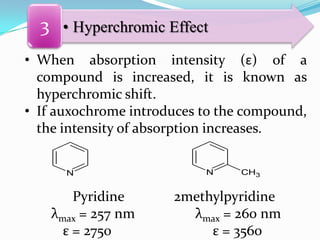
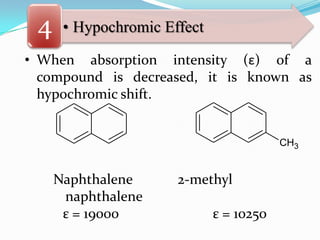
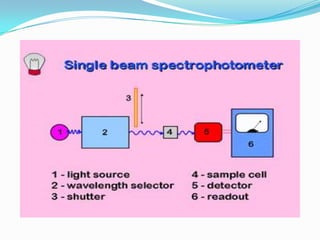
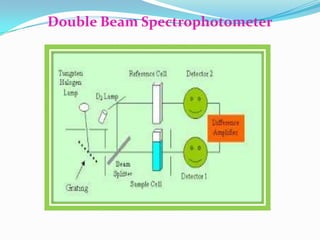
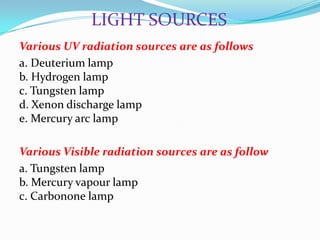
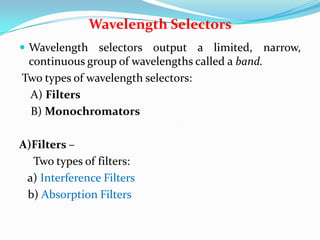
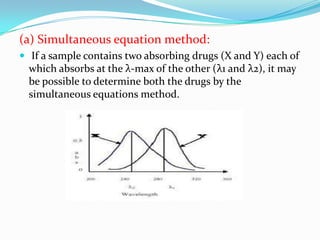
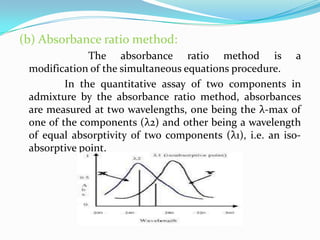
UV/visible spectroscopy involves measuring the absorption of ultraviolet or visible light by molecules. It utilizes light in the wavelength range of 200-800 nm. The key components of a UV-visible spectrophotometer are a light source, wavelength selector such as a monochromator, sample holder, detector, and associated electronics. Common light sources include deuterium lamps, tungsten lamps, and mercury lamps. Samples are typically held in quartz or glass cuvettes. Detectors include phototubes and photodiodes. UV-visible spectroscopy can be used to analyze samples containing multiple components. Methods for multicomponent analysis include simultaneous equations using absorption data at two wavelengths, absorbance ratio methods


