Downloaded 476 times

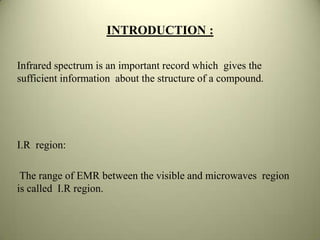
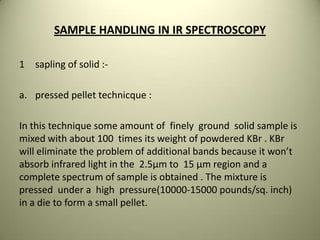
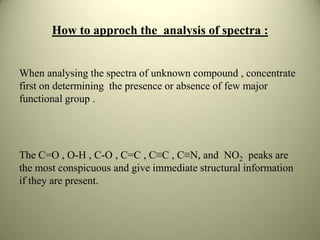
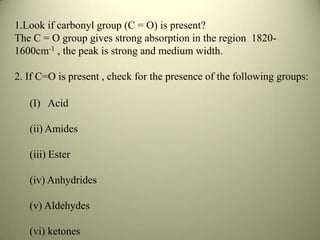
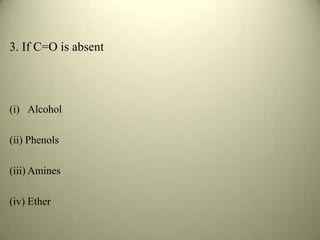
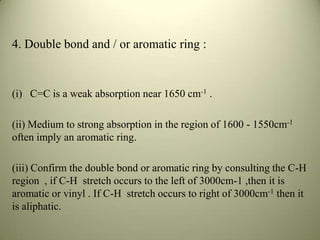
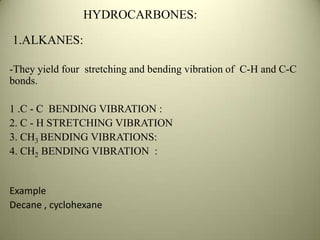
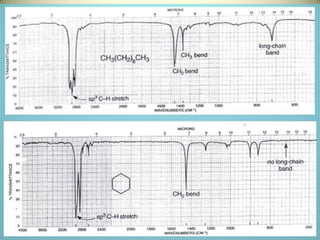
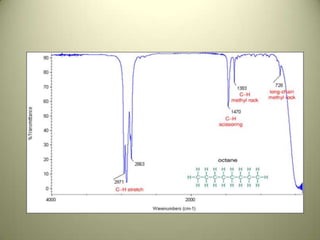
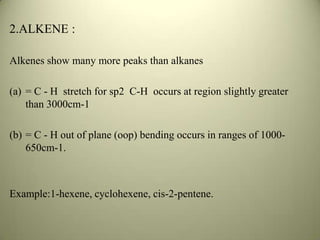
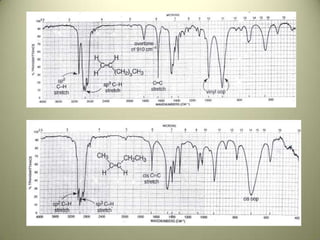
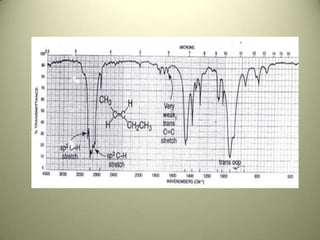
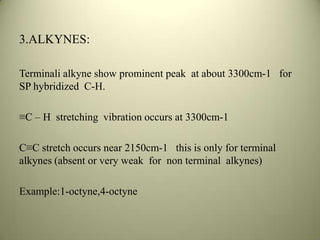
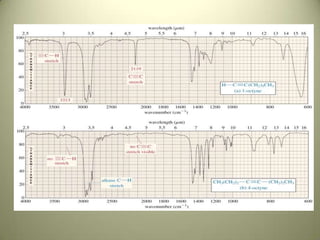
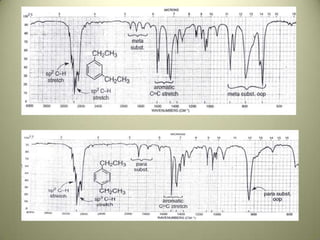
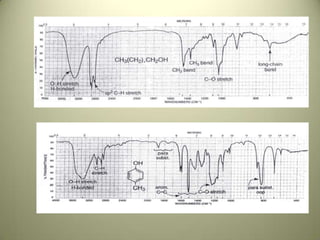
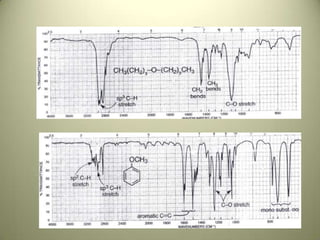
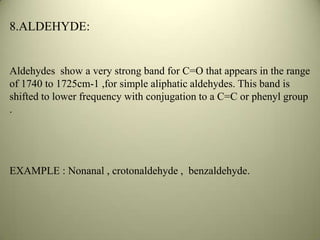
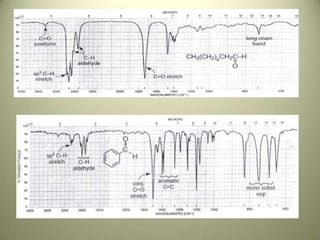
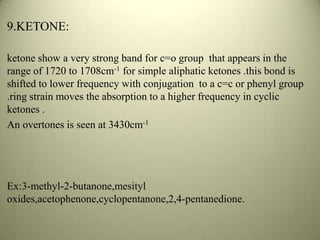
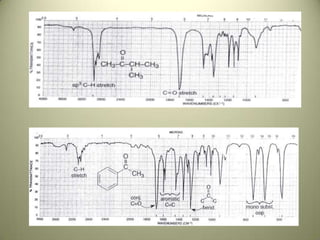
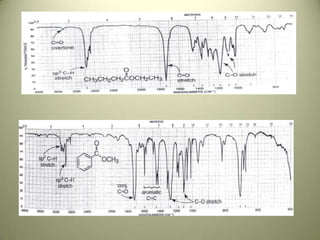
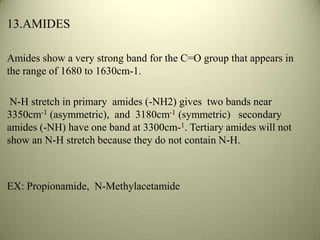
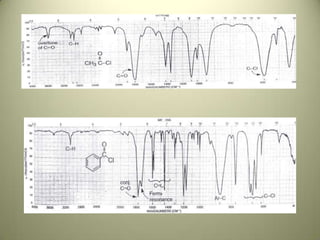
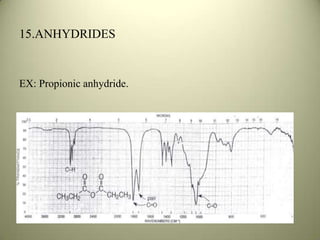
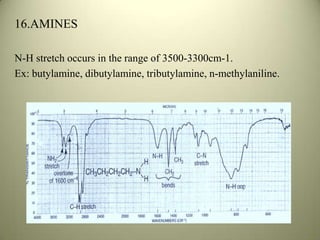
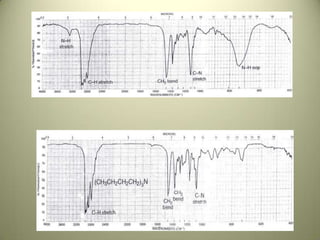


The document discusses sample handling and interpretation of infrared spectroscopy. It describes several methods for preparing solid, liquid, and gas samples for IR analysis. These include pressed KBr pellets for solids, liquid samples in thin films between windows, and gases in cells. The document then outlines how to interpret IR spectra by identifying key functional groups like carbonyl, hydroxyl, aromatic, and C=C bands. It provides examples of infrared absorptions for several classes of organic compounds including alkanes, alkenes, alcohols, ketones, and amides.


![[Day 2] Center Presentation: ESAMAP](https://cdn.slidesharecdn.com/ss_thumbnails/cgiar-csi-day2-1apr2009-center-esamap-090405003424-phpapp01-thumbnail.jpg?width=640&height=640&fit=bounds)

![[Day 2] Center Presentation: ICARDA](https://cdn.slidesharecdn.com/ss_thumbnails/cgiar-csi-day2-1apr2009-center-icarda-090405003350-phpapp01-thumbnail.jpg?width=640&height=640&fit=bounds)


