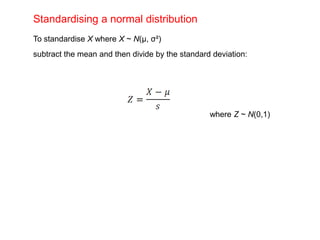
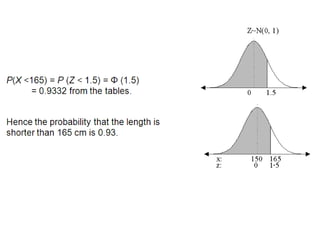
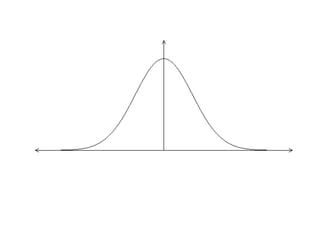
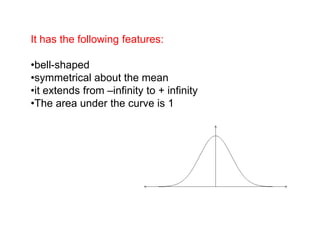
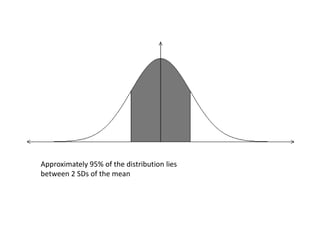
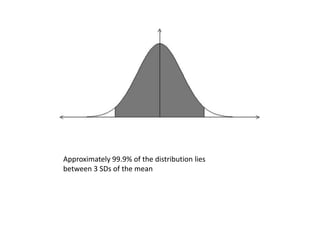
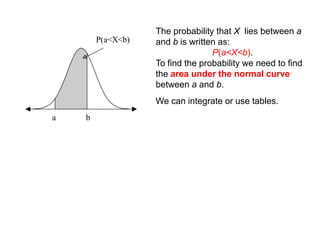
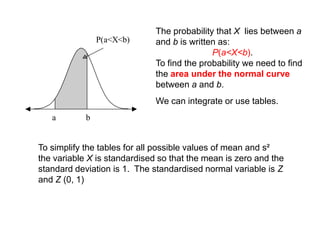
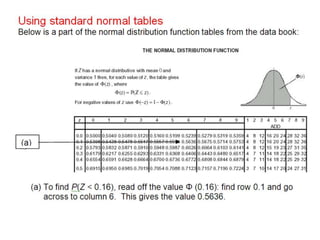
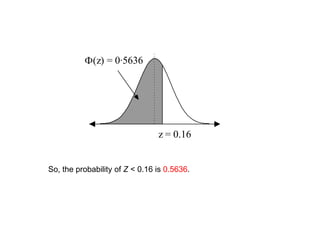
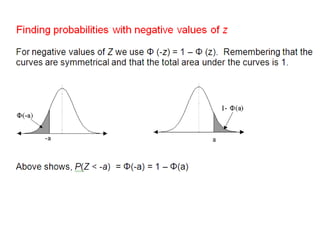
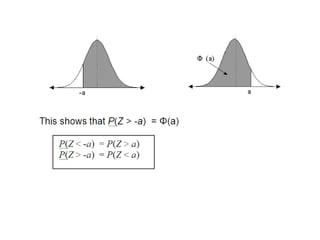
The document discusses the normal distribution and its key properties: bell-shaped and symmetrical around the mean, extending from negative to positive infinity with an area under the curve of 1. Approximately 95% and 99.9% of the distribution lies within 2 and 3 standard deviations of the mean, respectively. It also discusses how to calculate probabilities using the standard normal distribution where the mean is 0 and standard deviation is 1, and how to standardize other normal distributions.

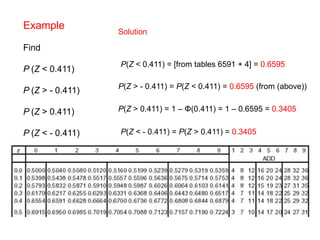
![ExampleFind P (Z < 0.411) P (Z > - 0.411) P (Z > 0.411) P (Z < - 0.411)SolutionP(Z < 0.411) = [from tables 6591 + 4] = 0.6595P(Z > - 0.411) = P(Z < 0.411) = 0.6595 (from (above))P(Z > 0.411) = 1 – Φ(0.411) = 1 – 0.6595 = 0.3405P(Z < - 0.411) = P(Z > 0.411) = 0.3405](https://image.slidesharecdn.com/normaldistribution-110307043247-phpapp01/85/Normal-distribution-16-320.jpg)