Downloaded 147 times
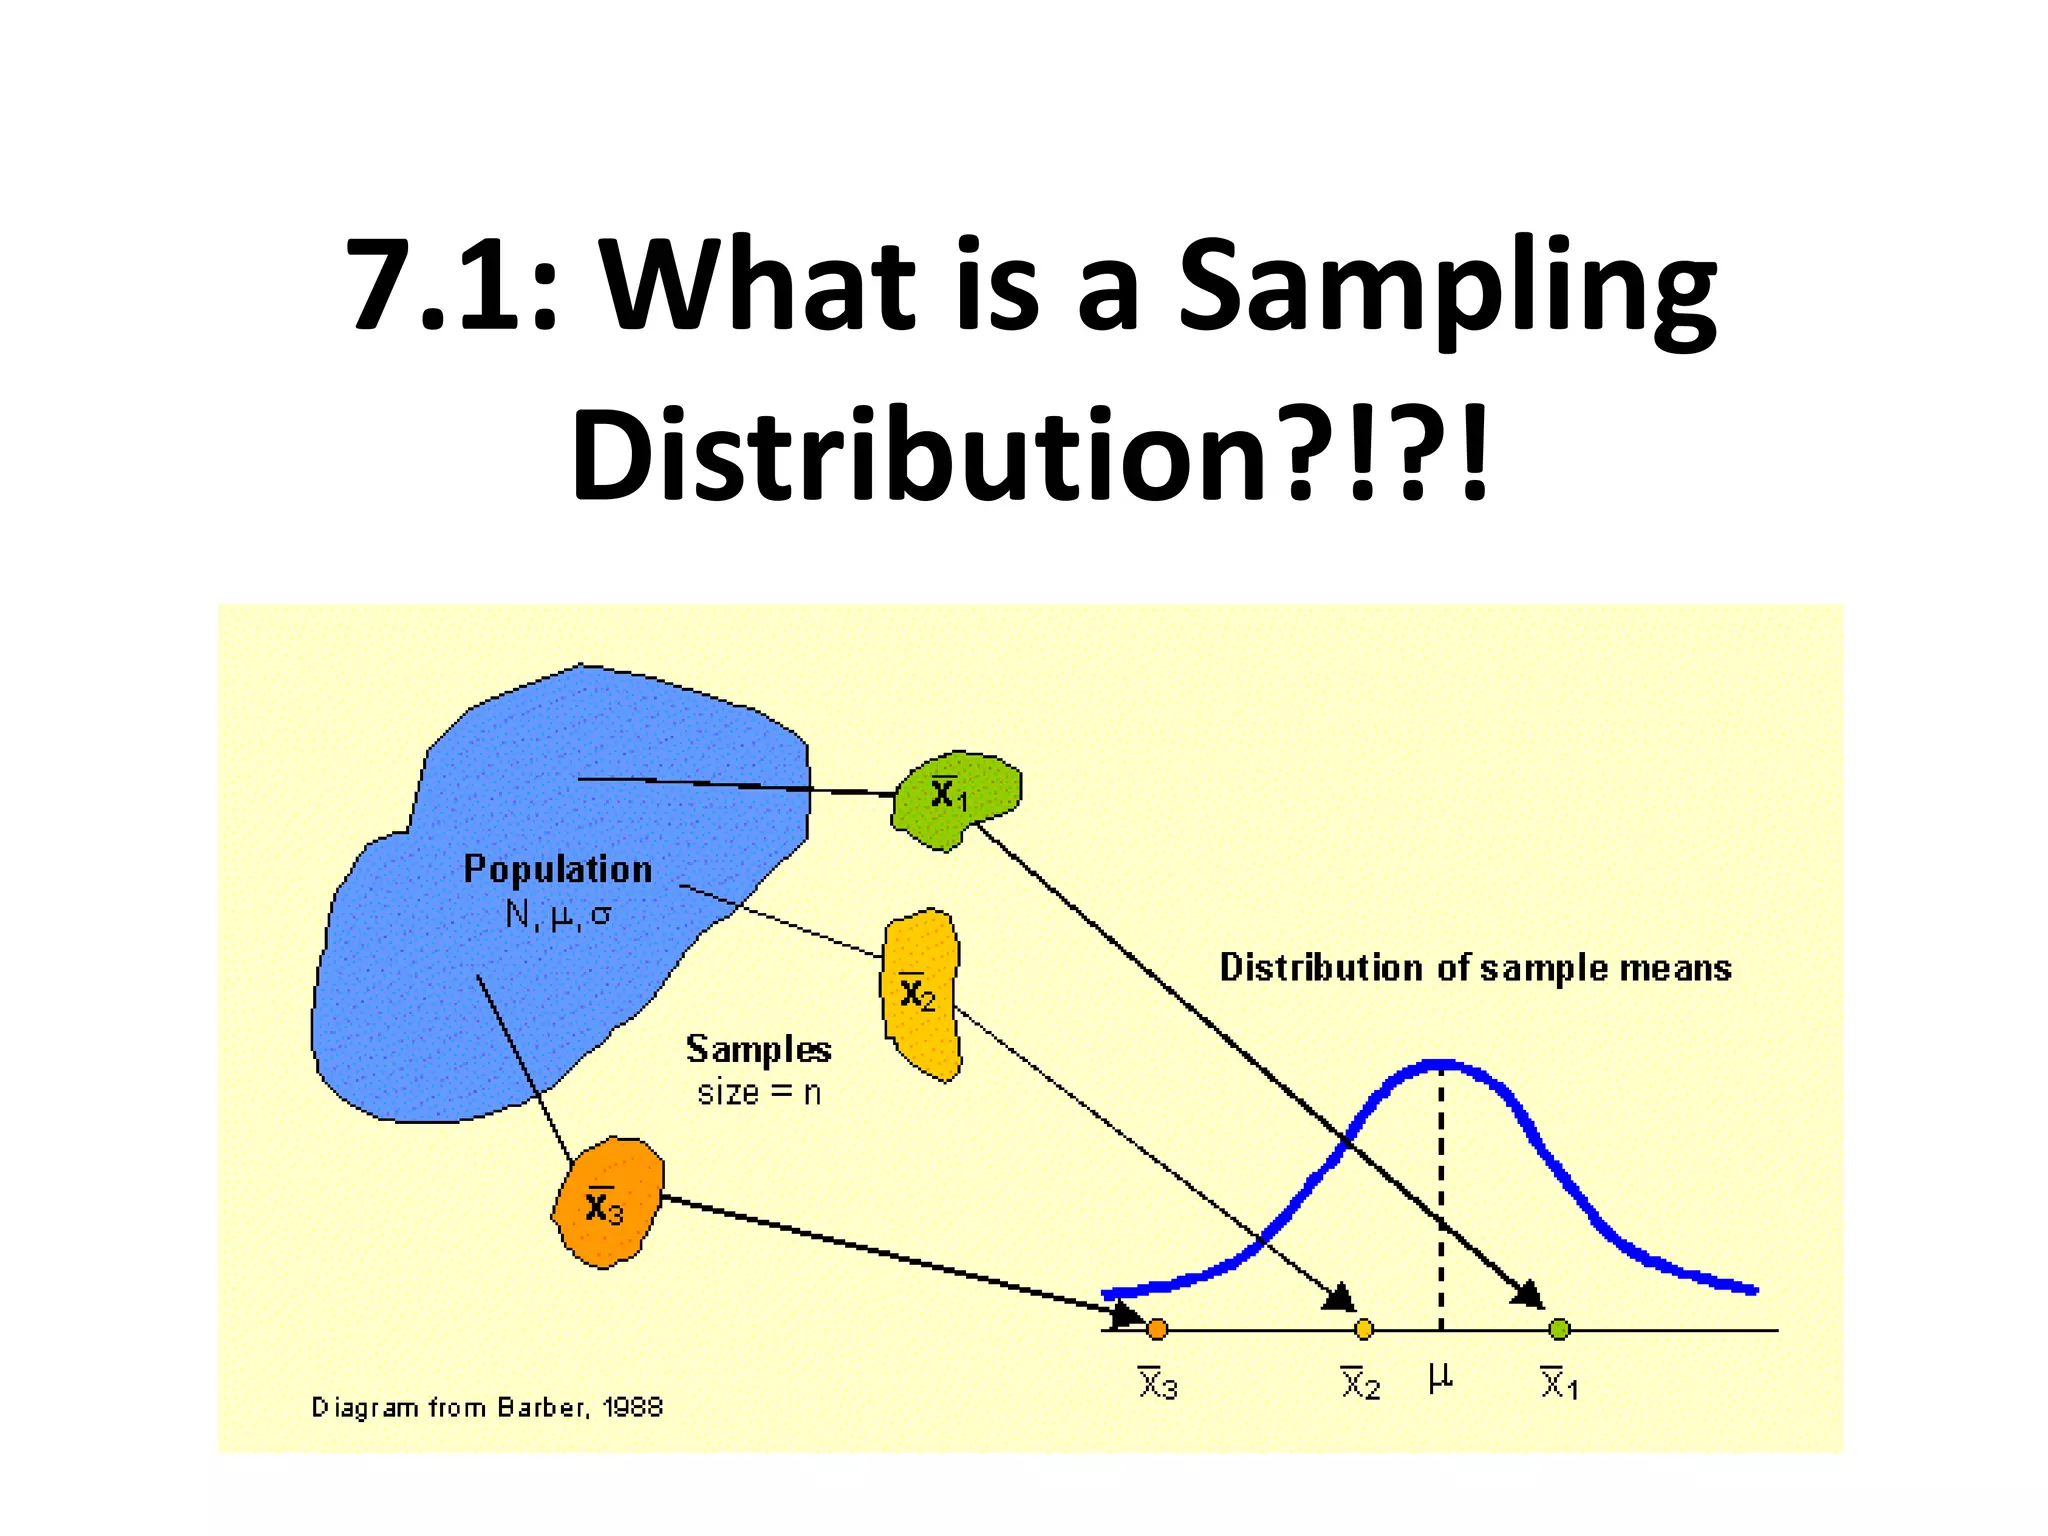
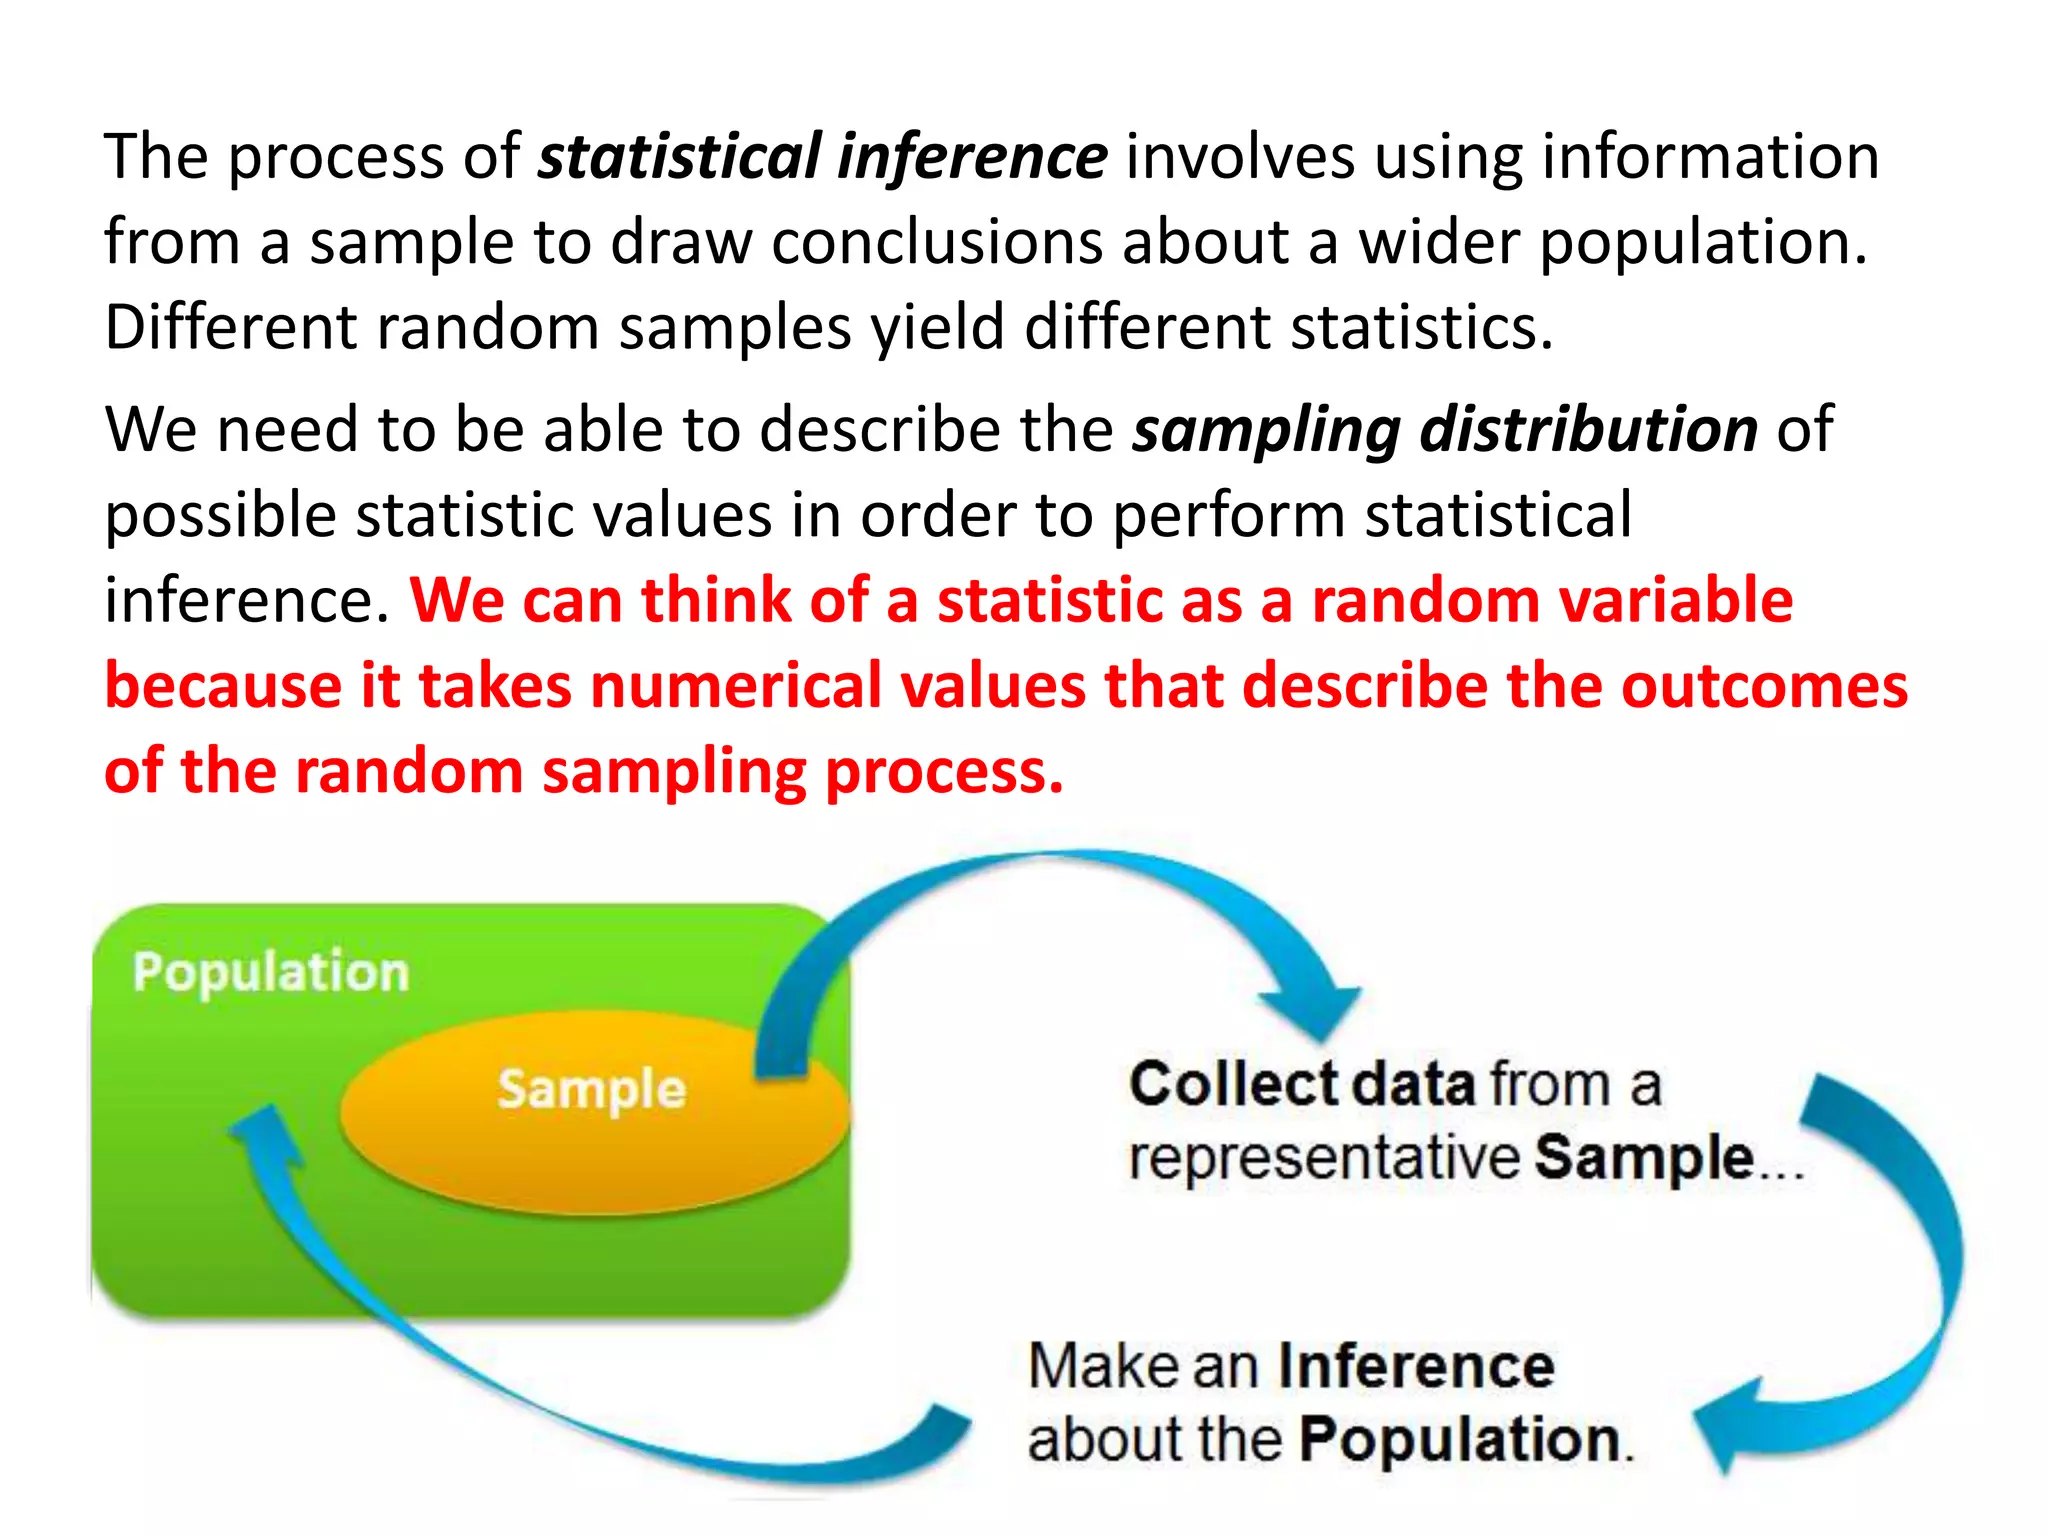
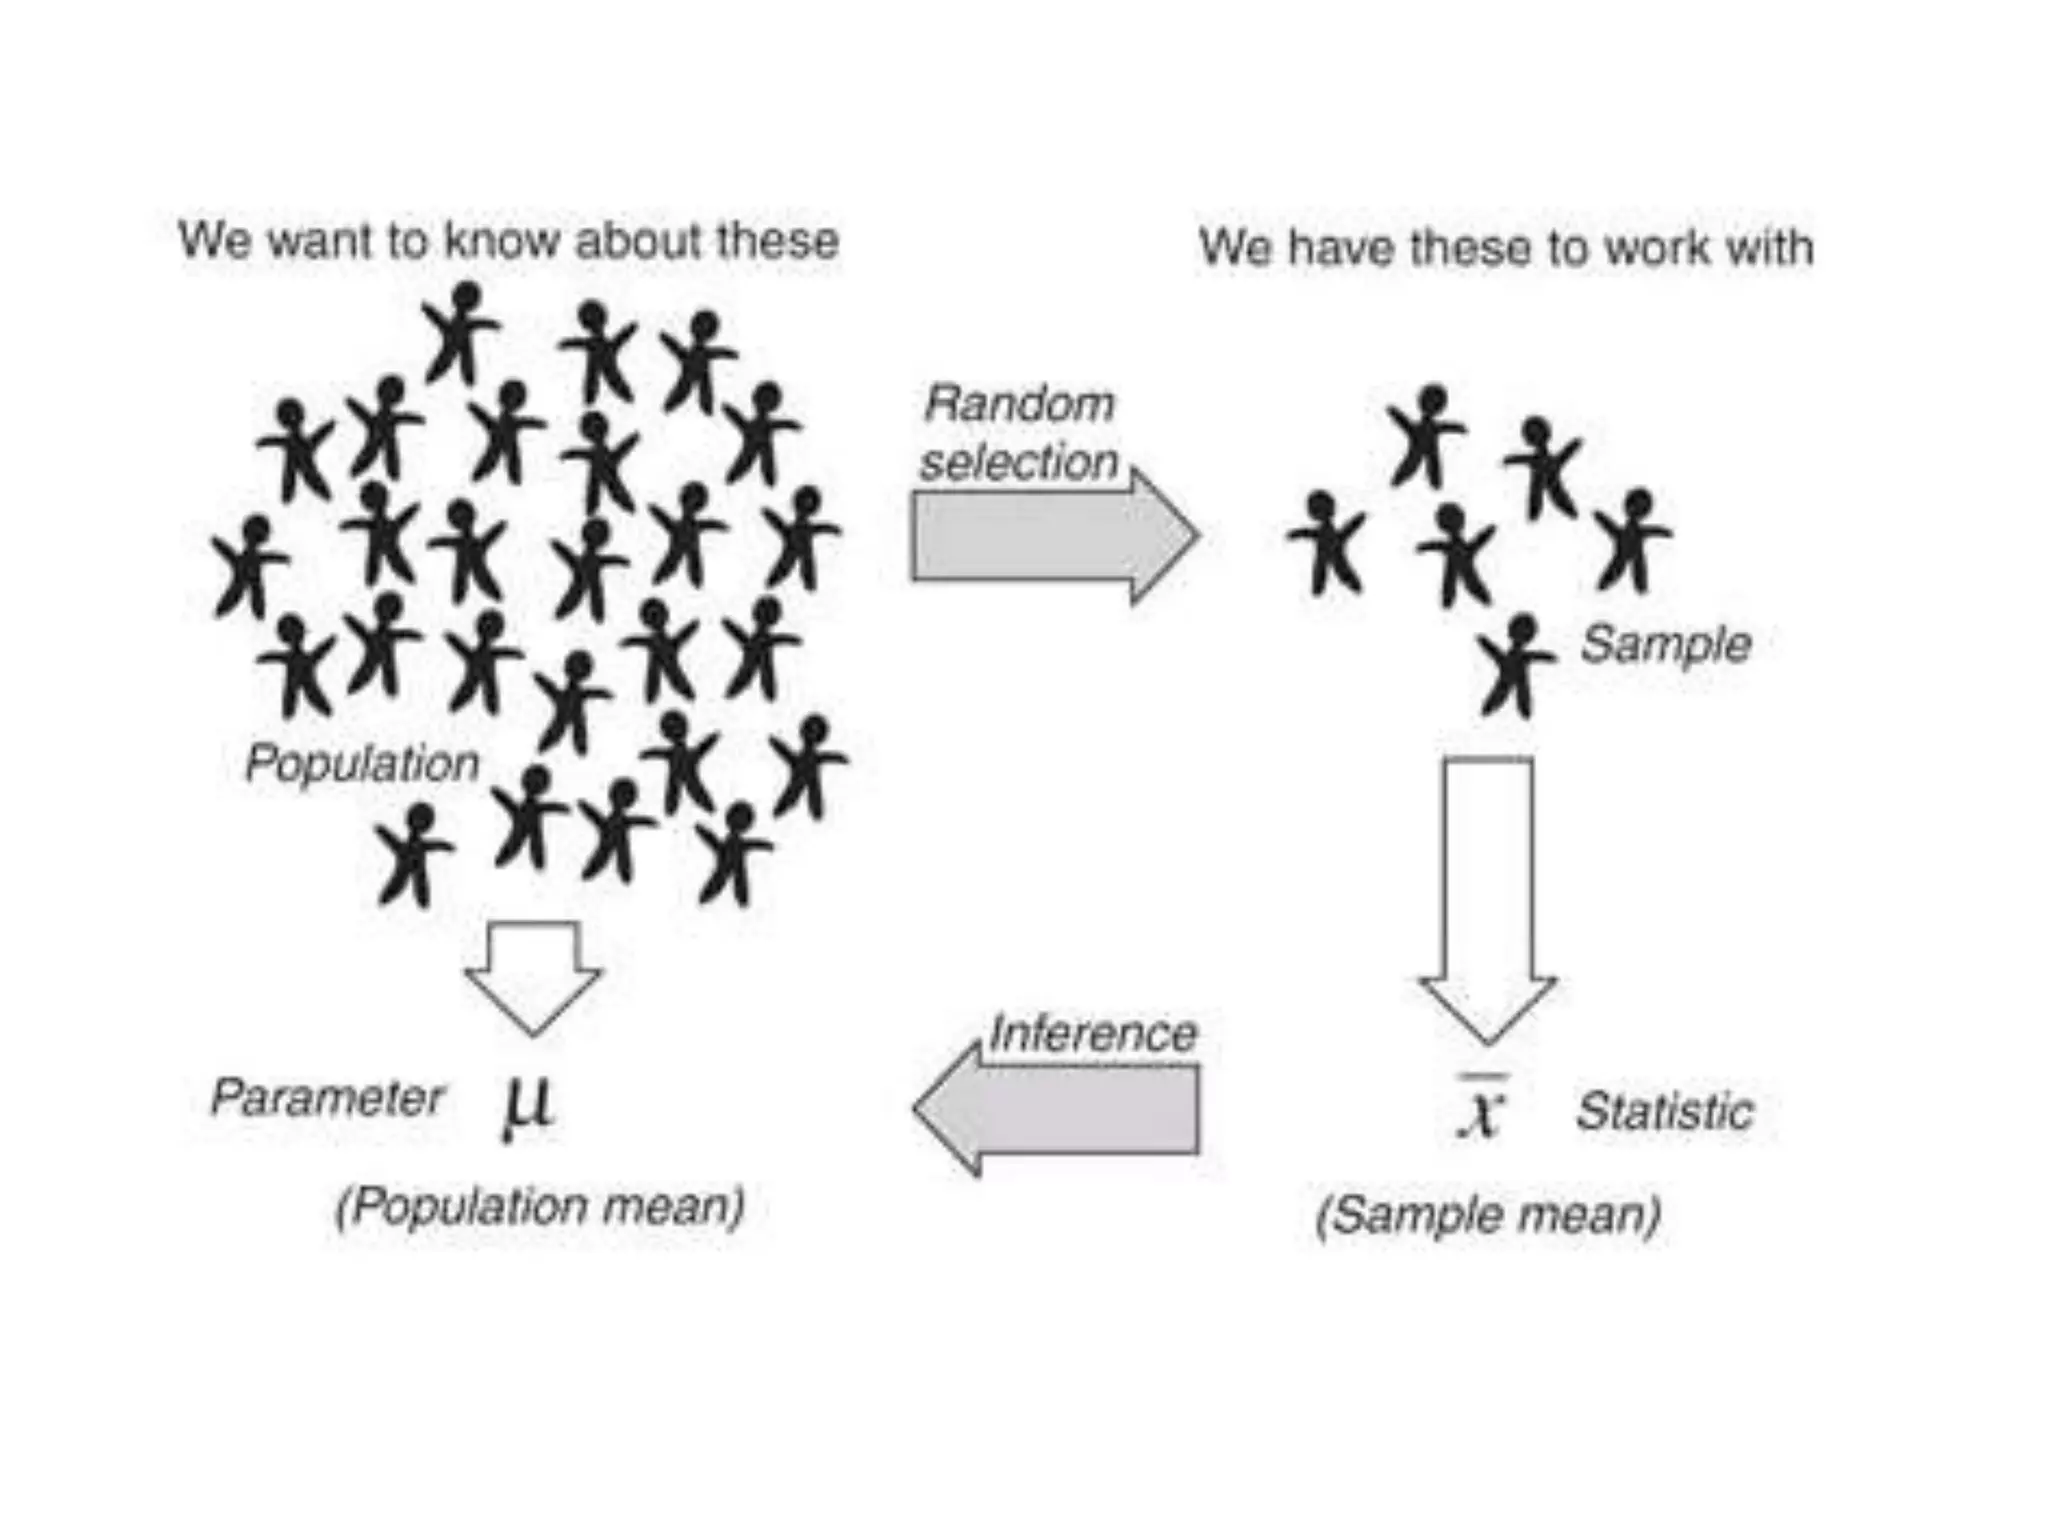
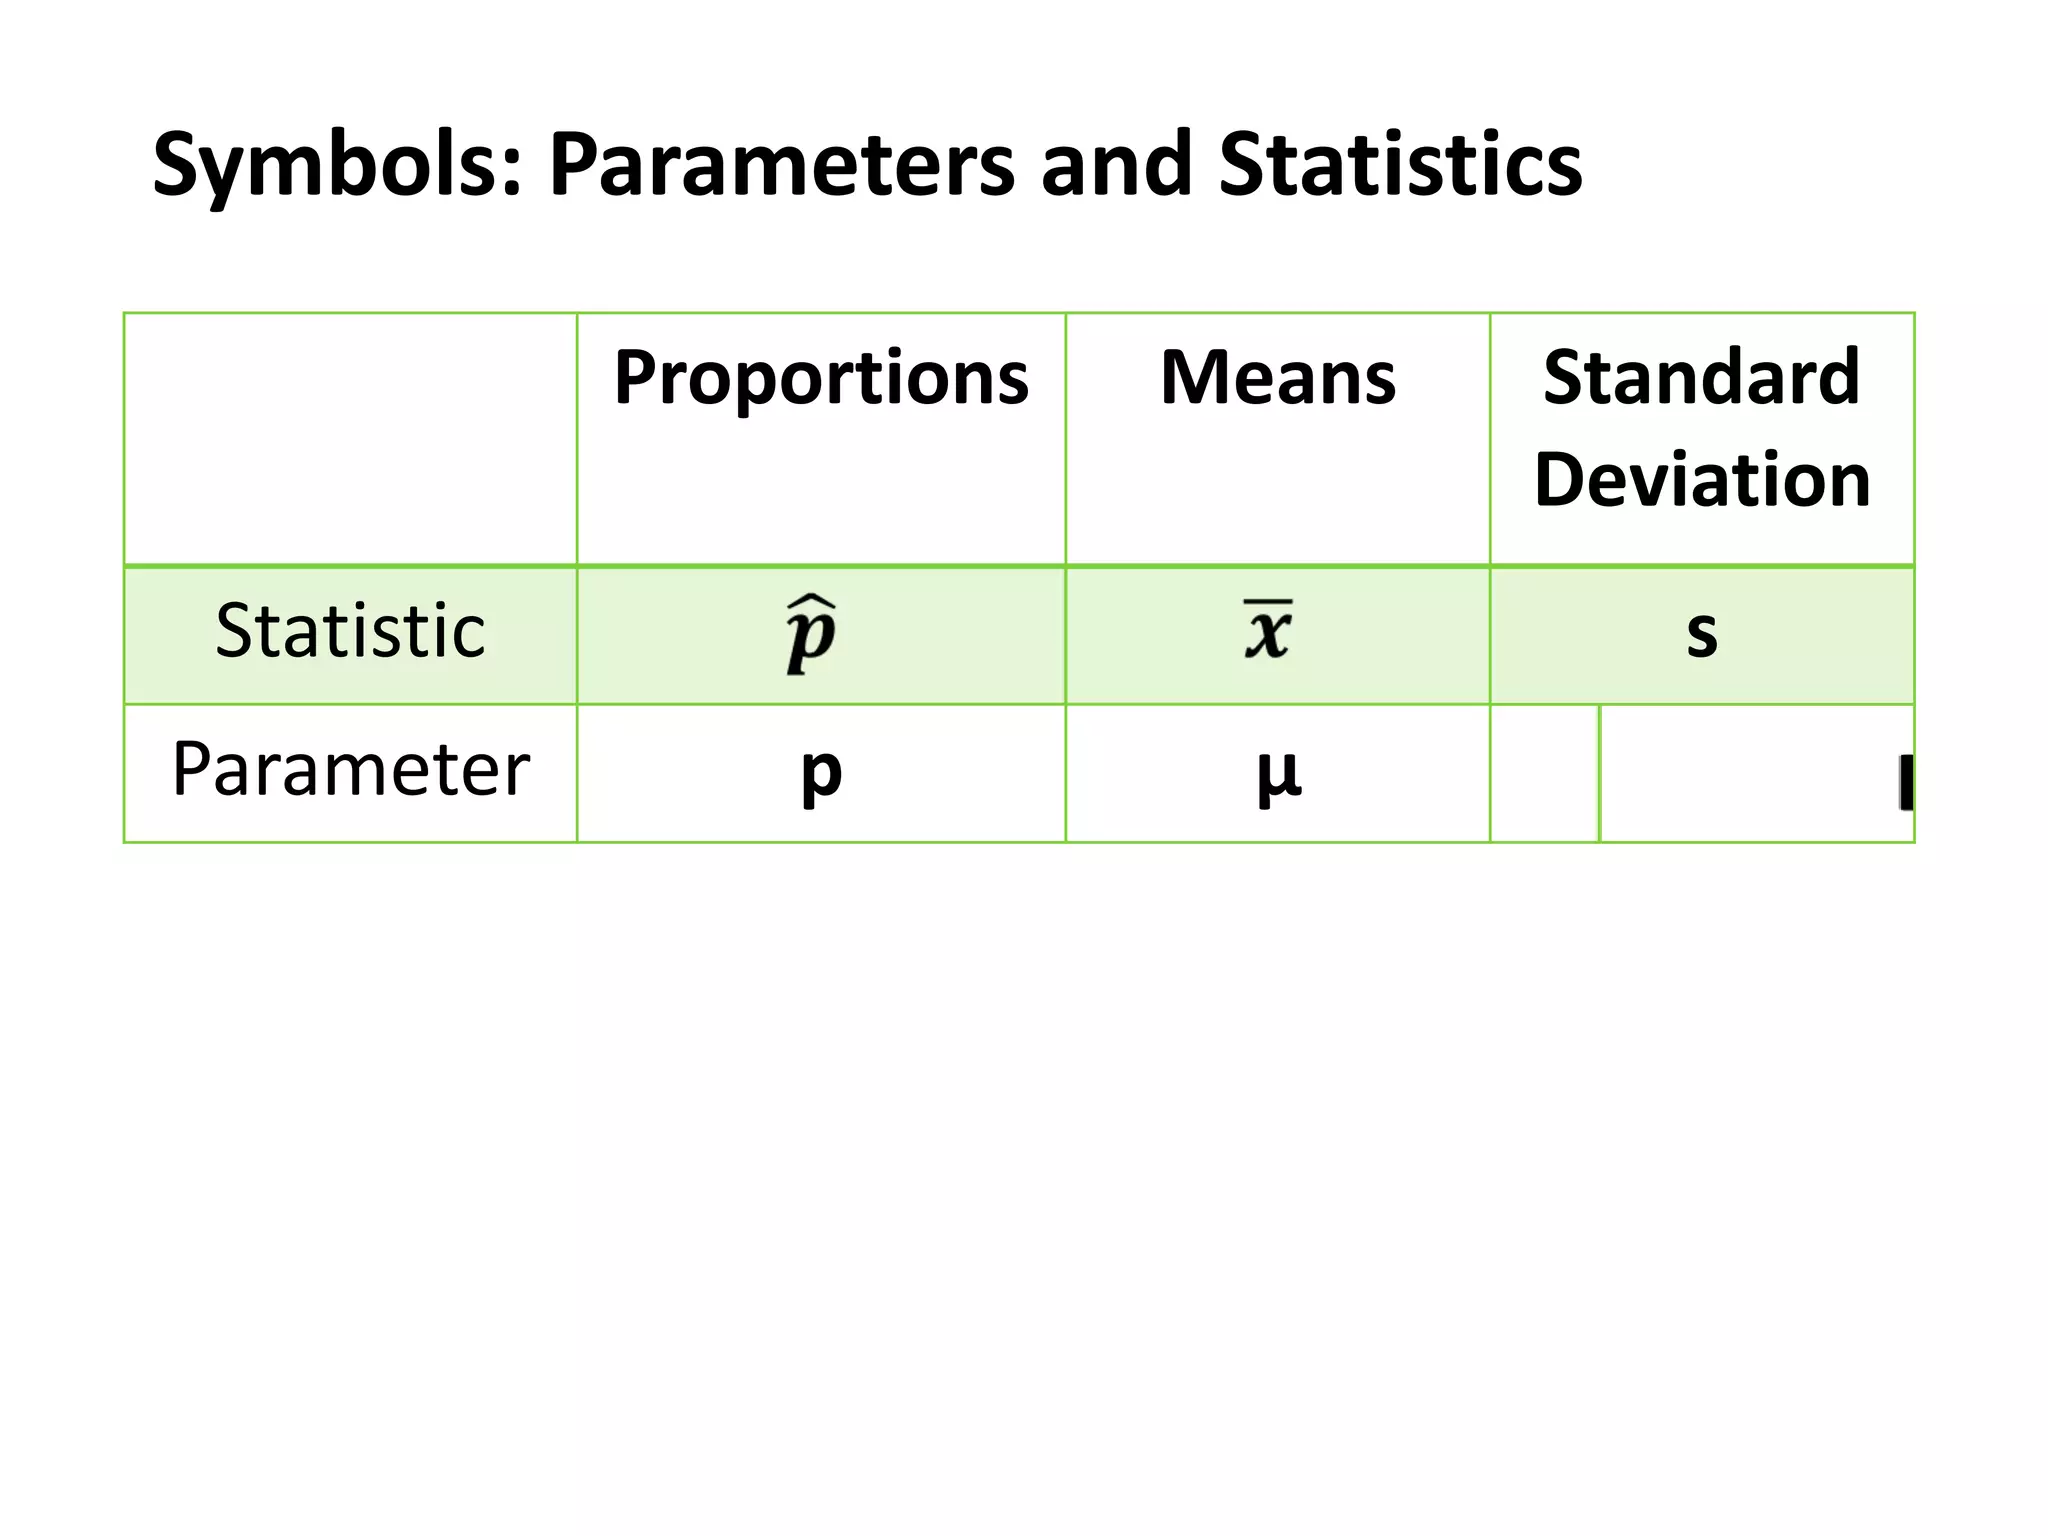
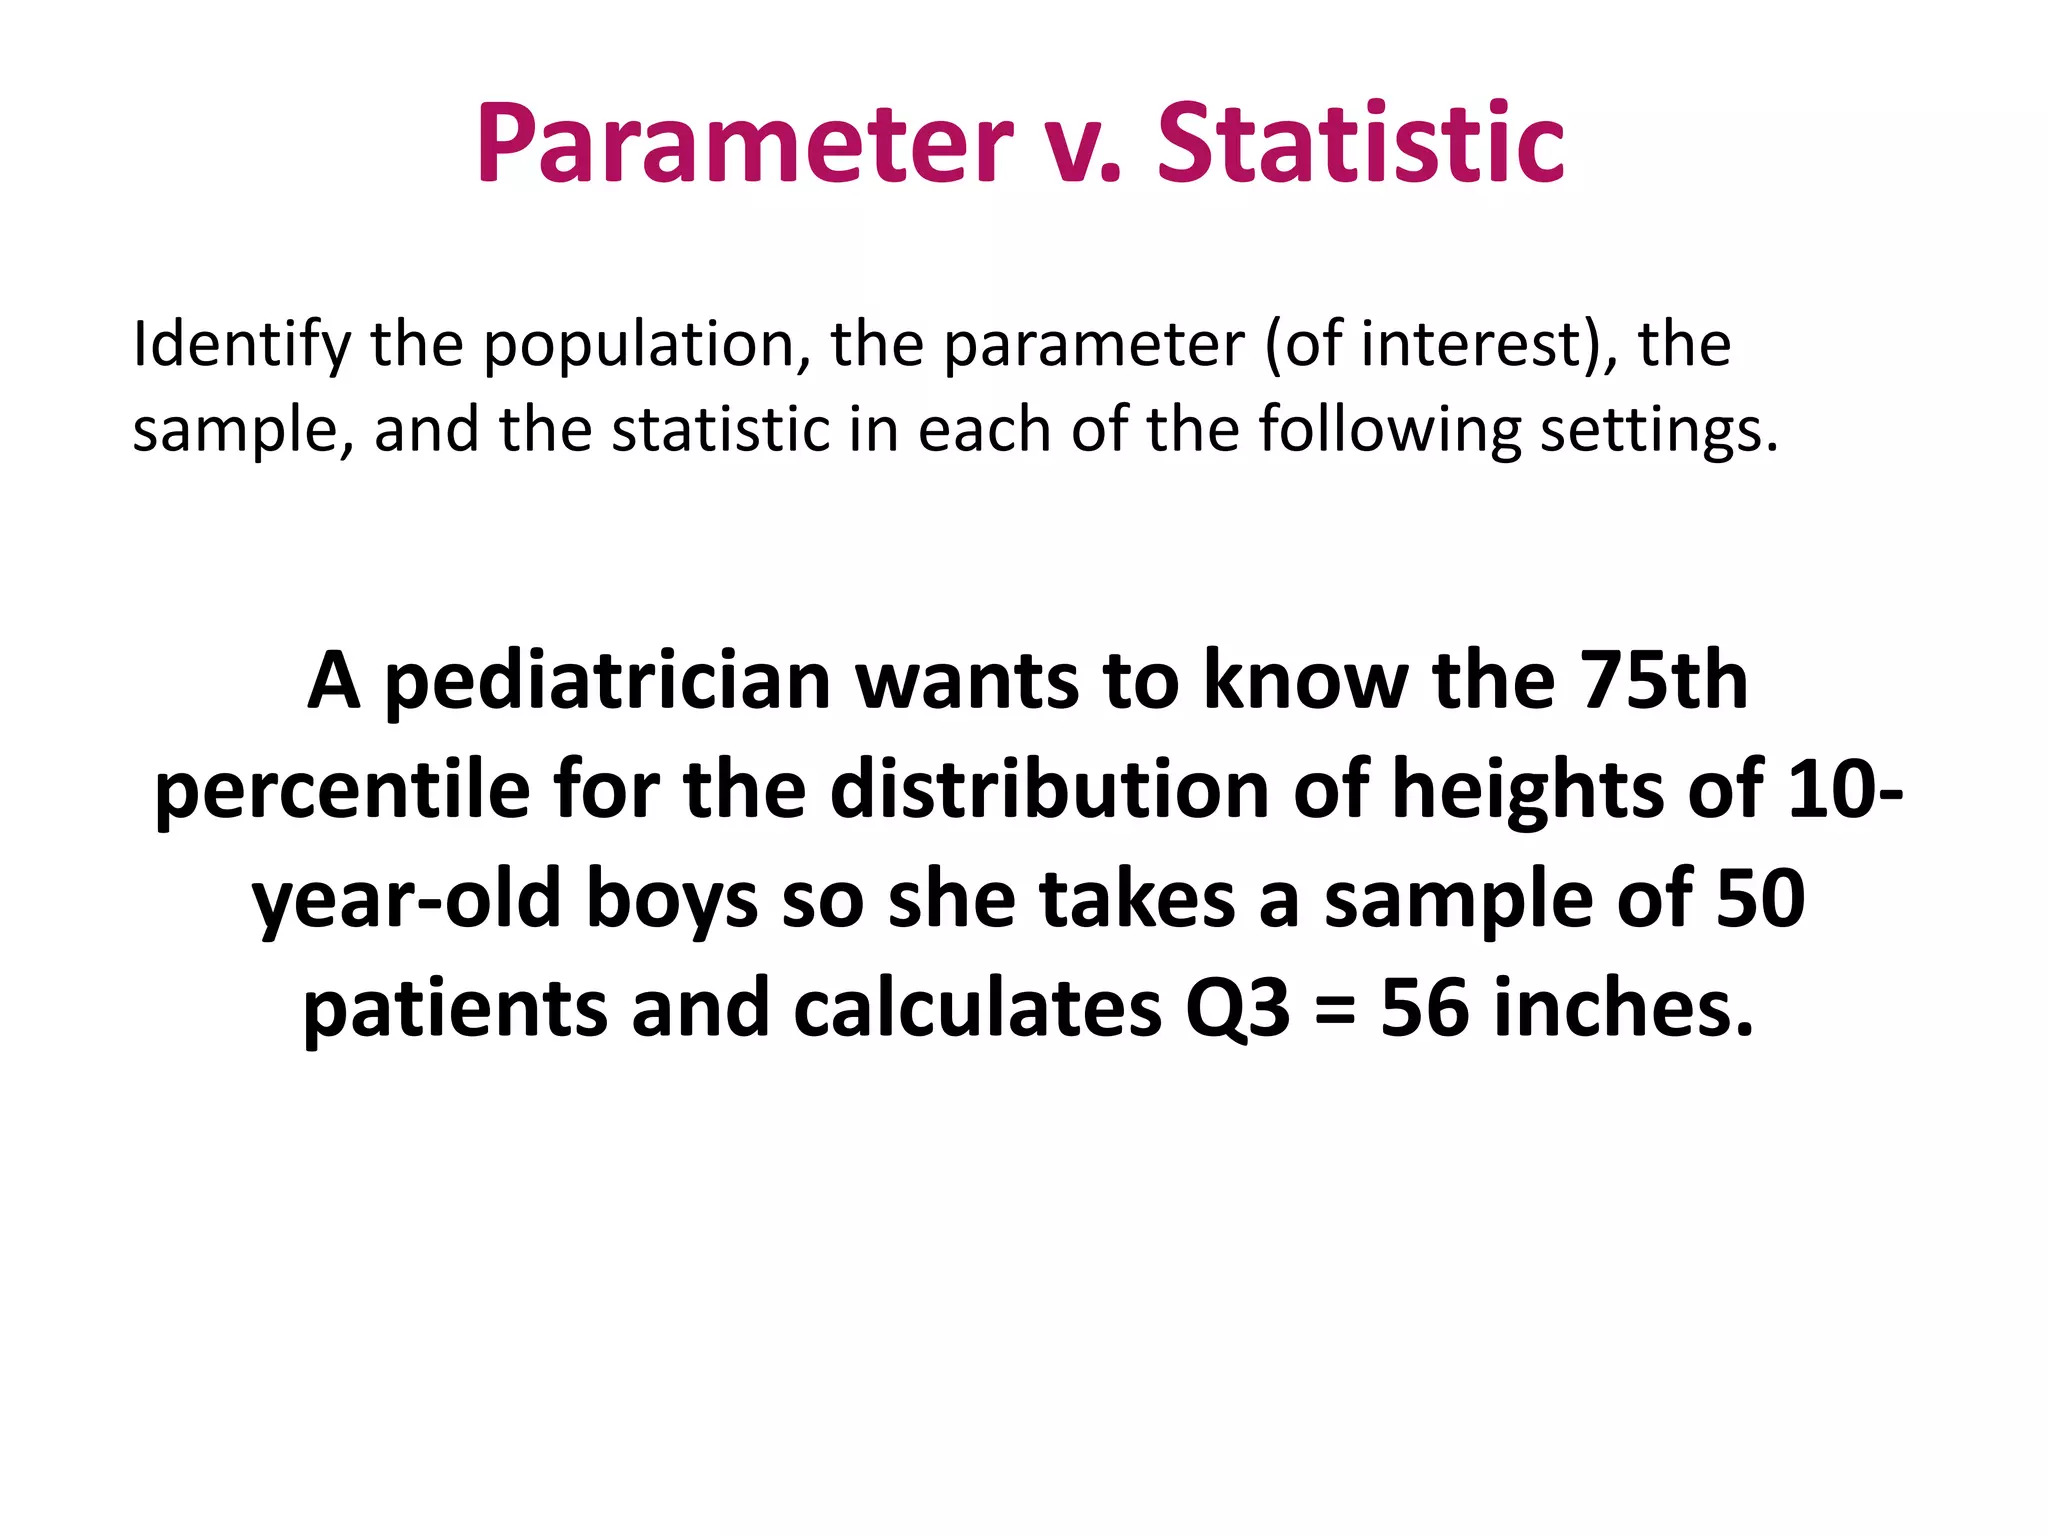
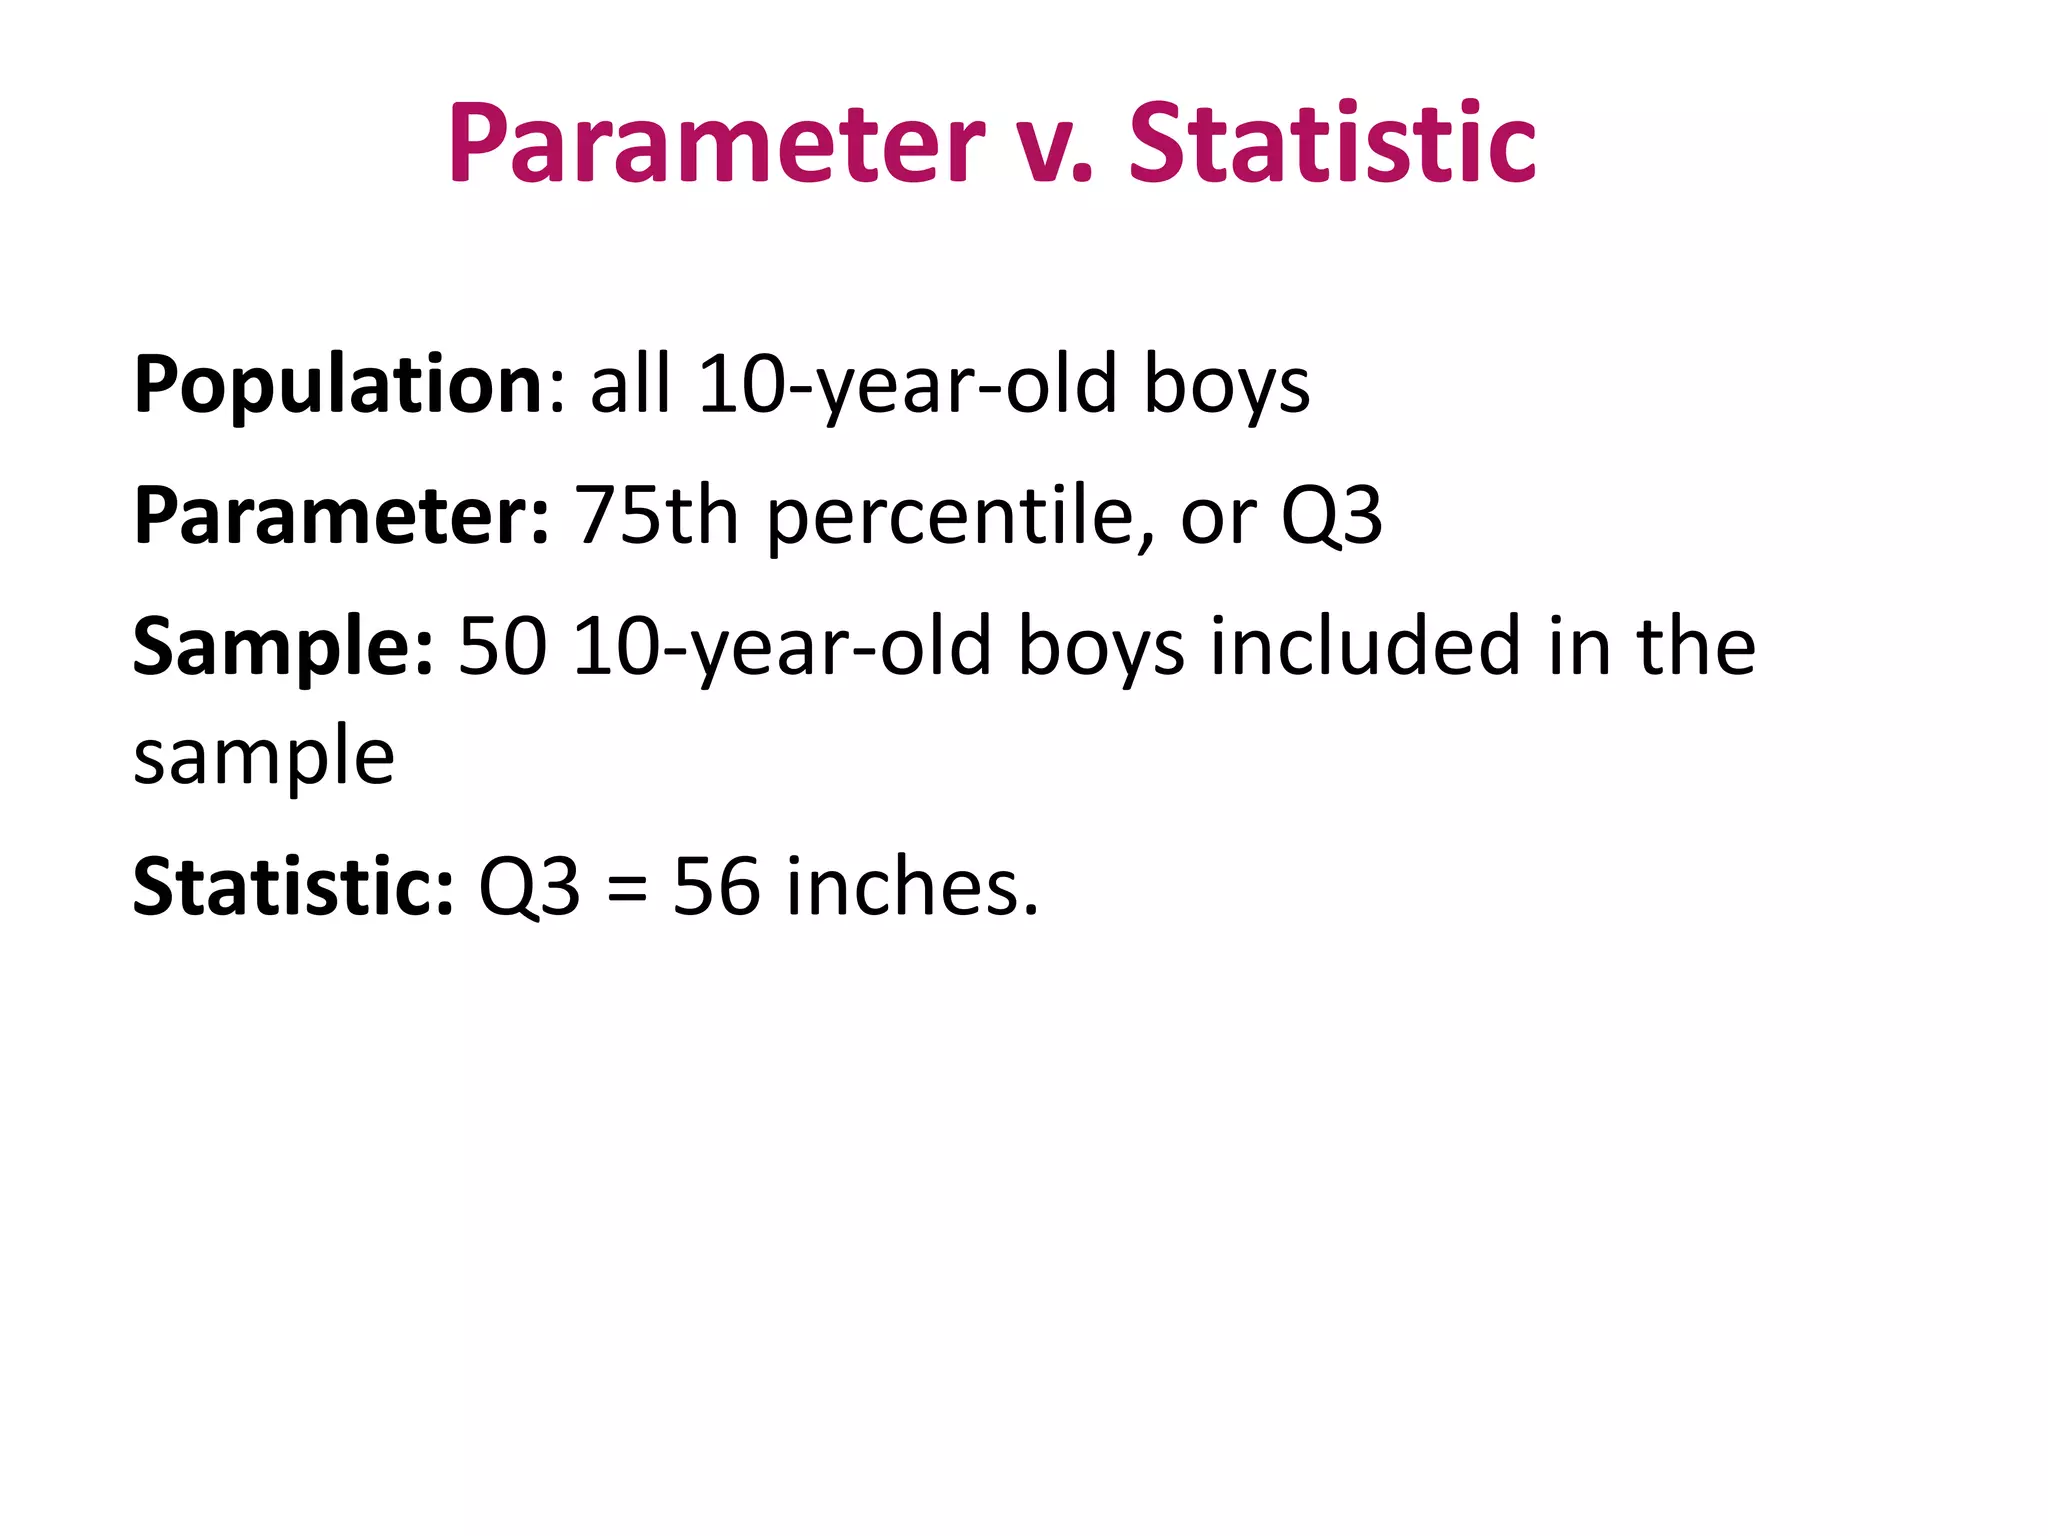
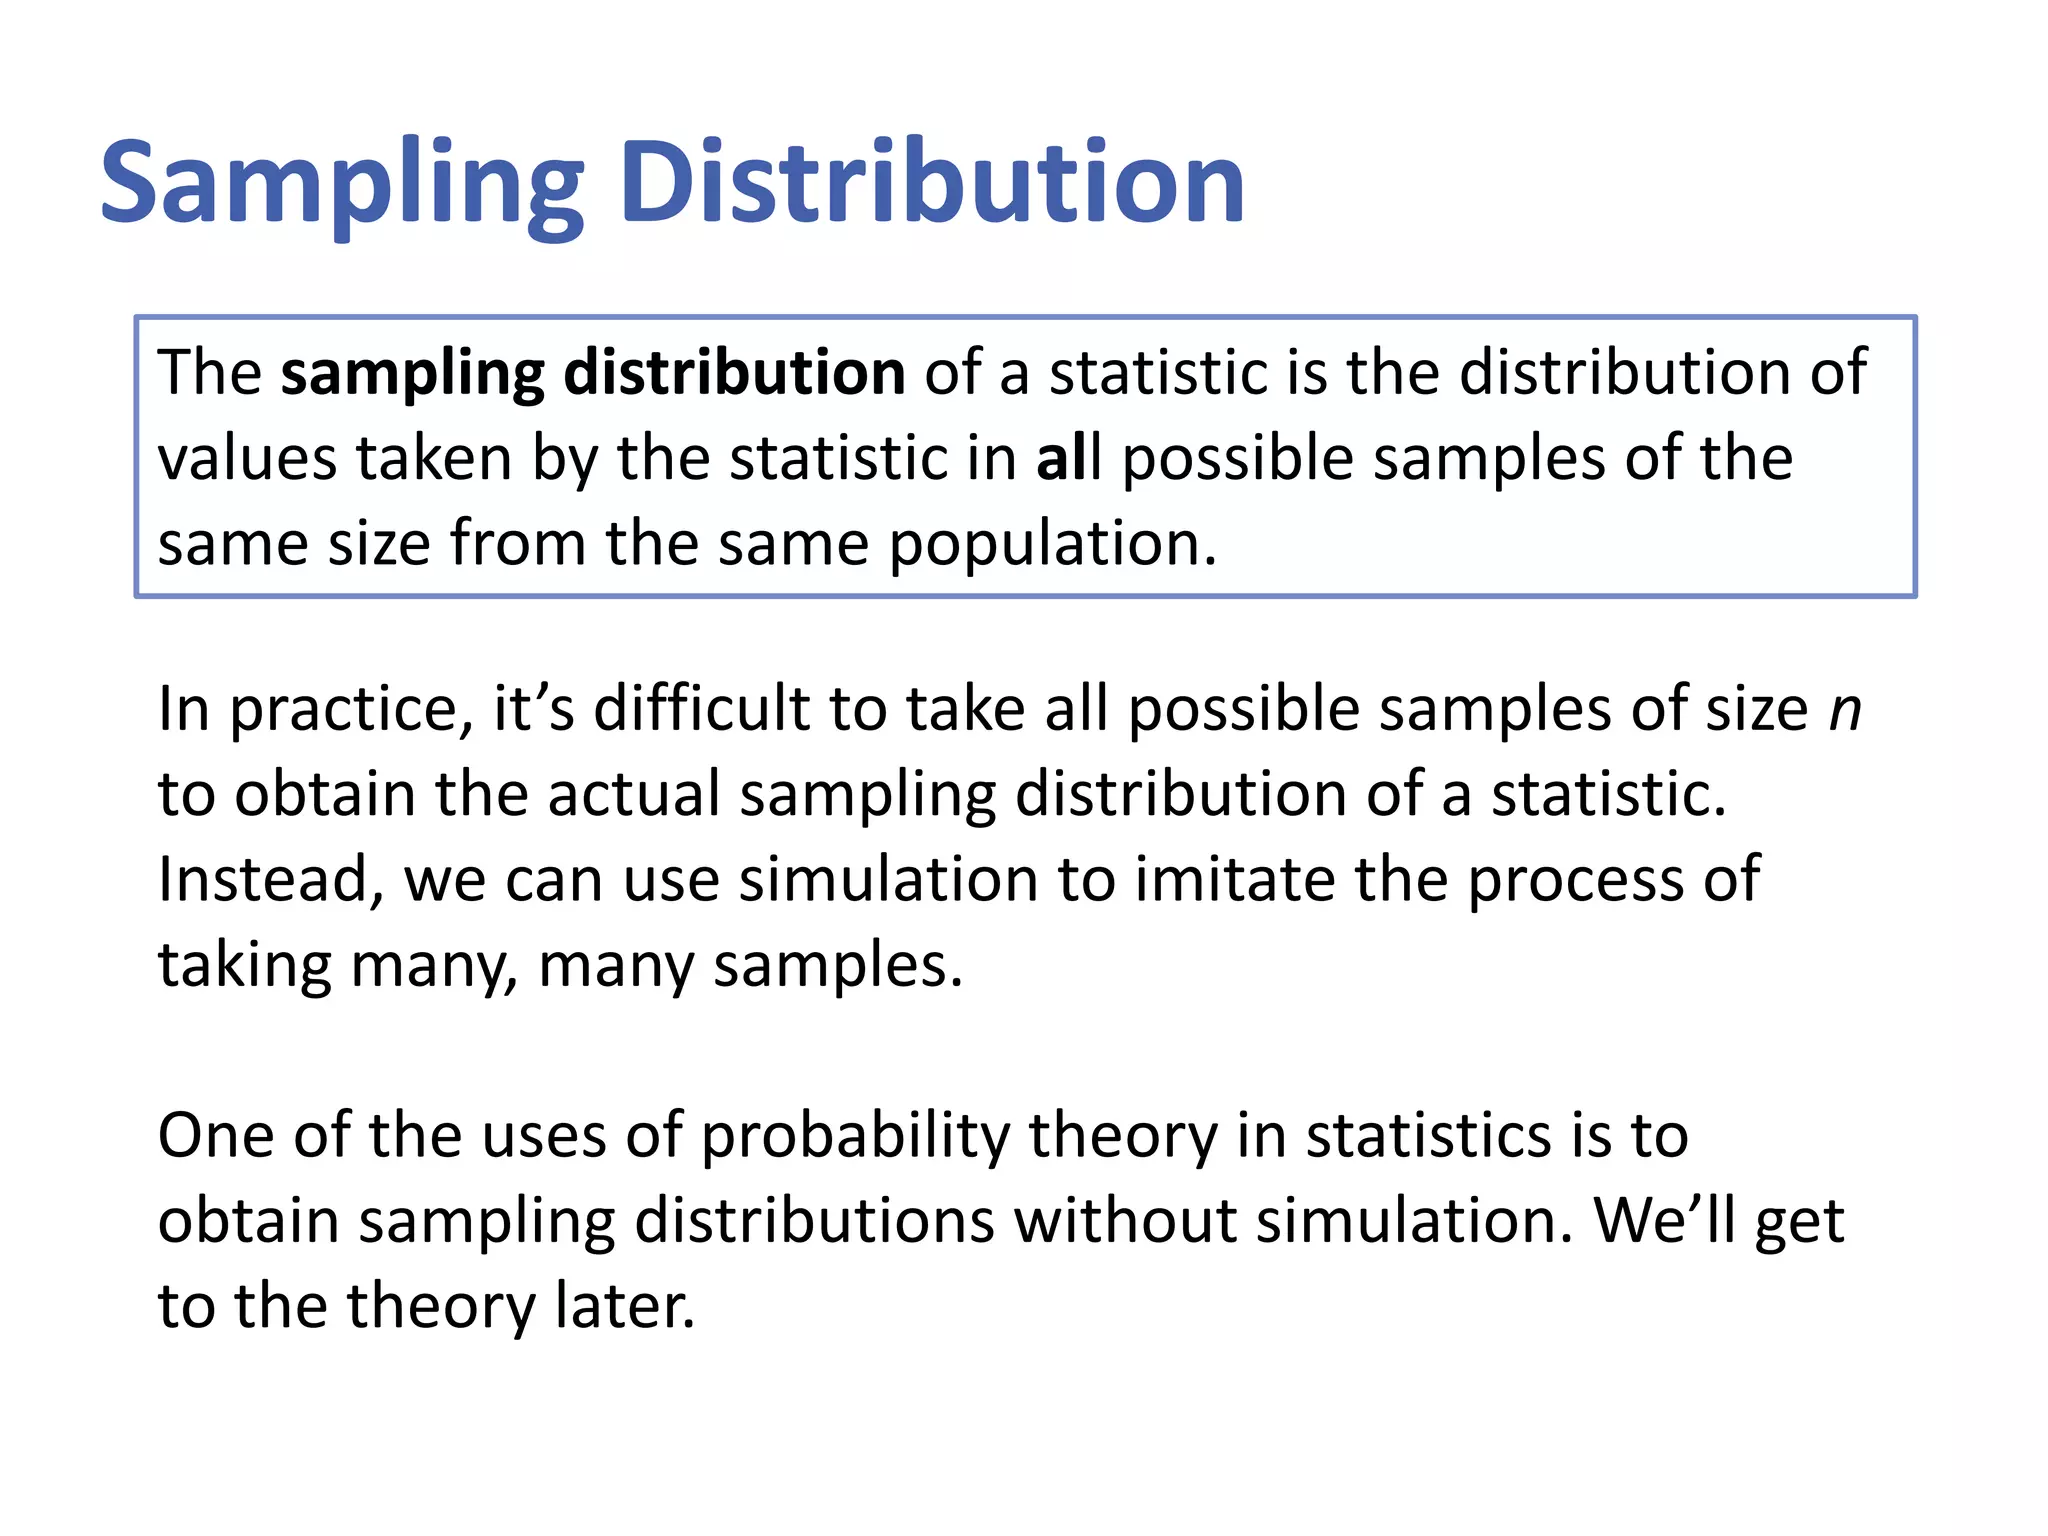
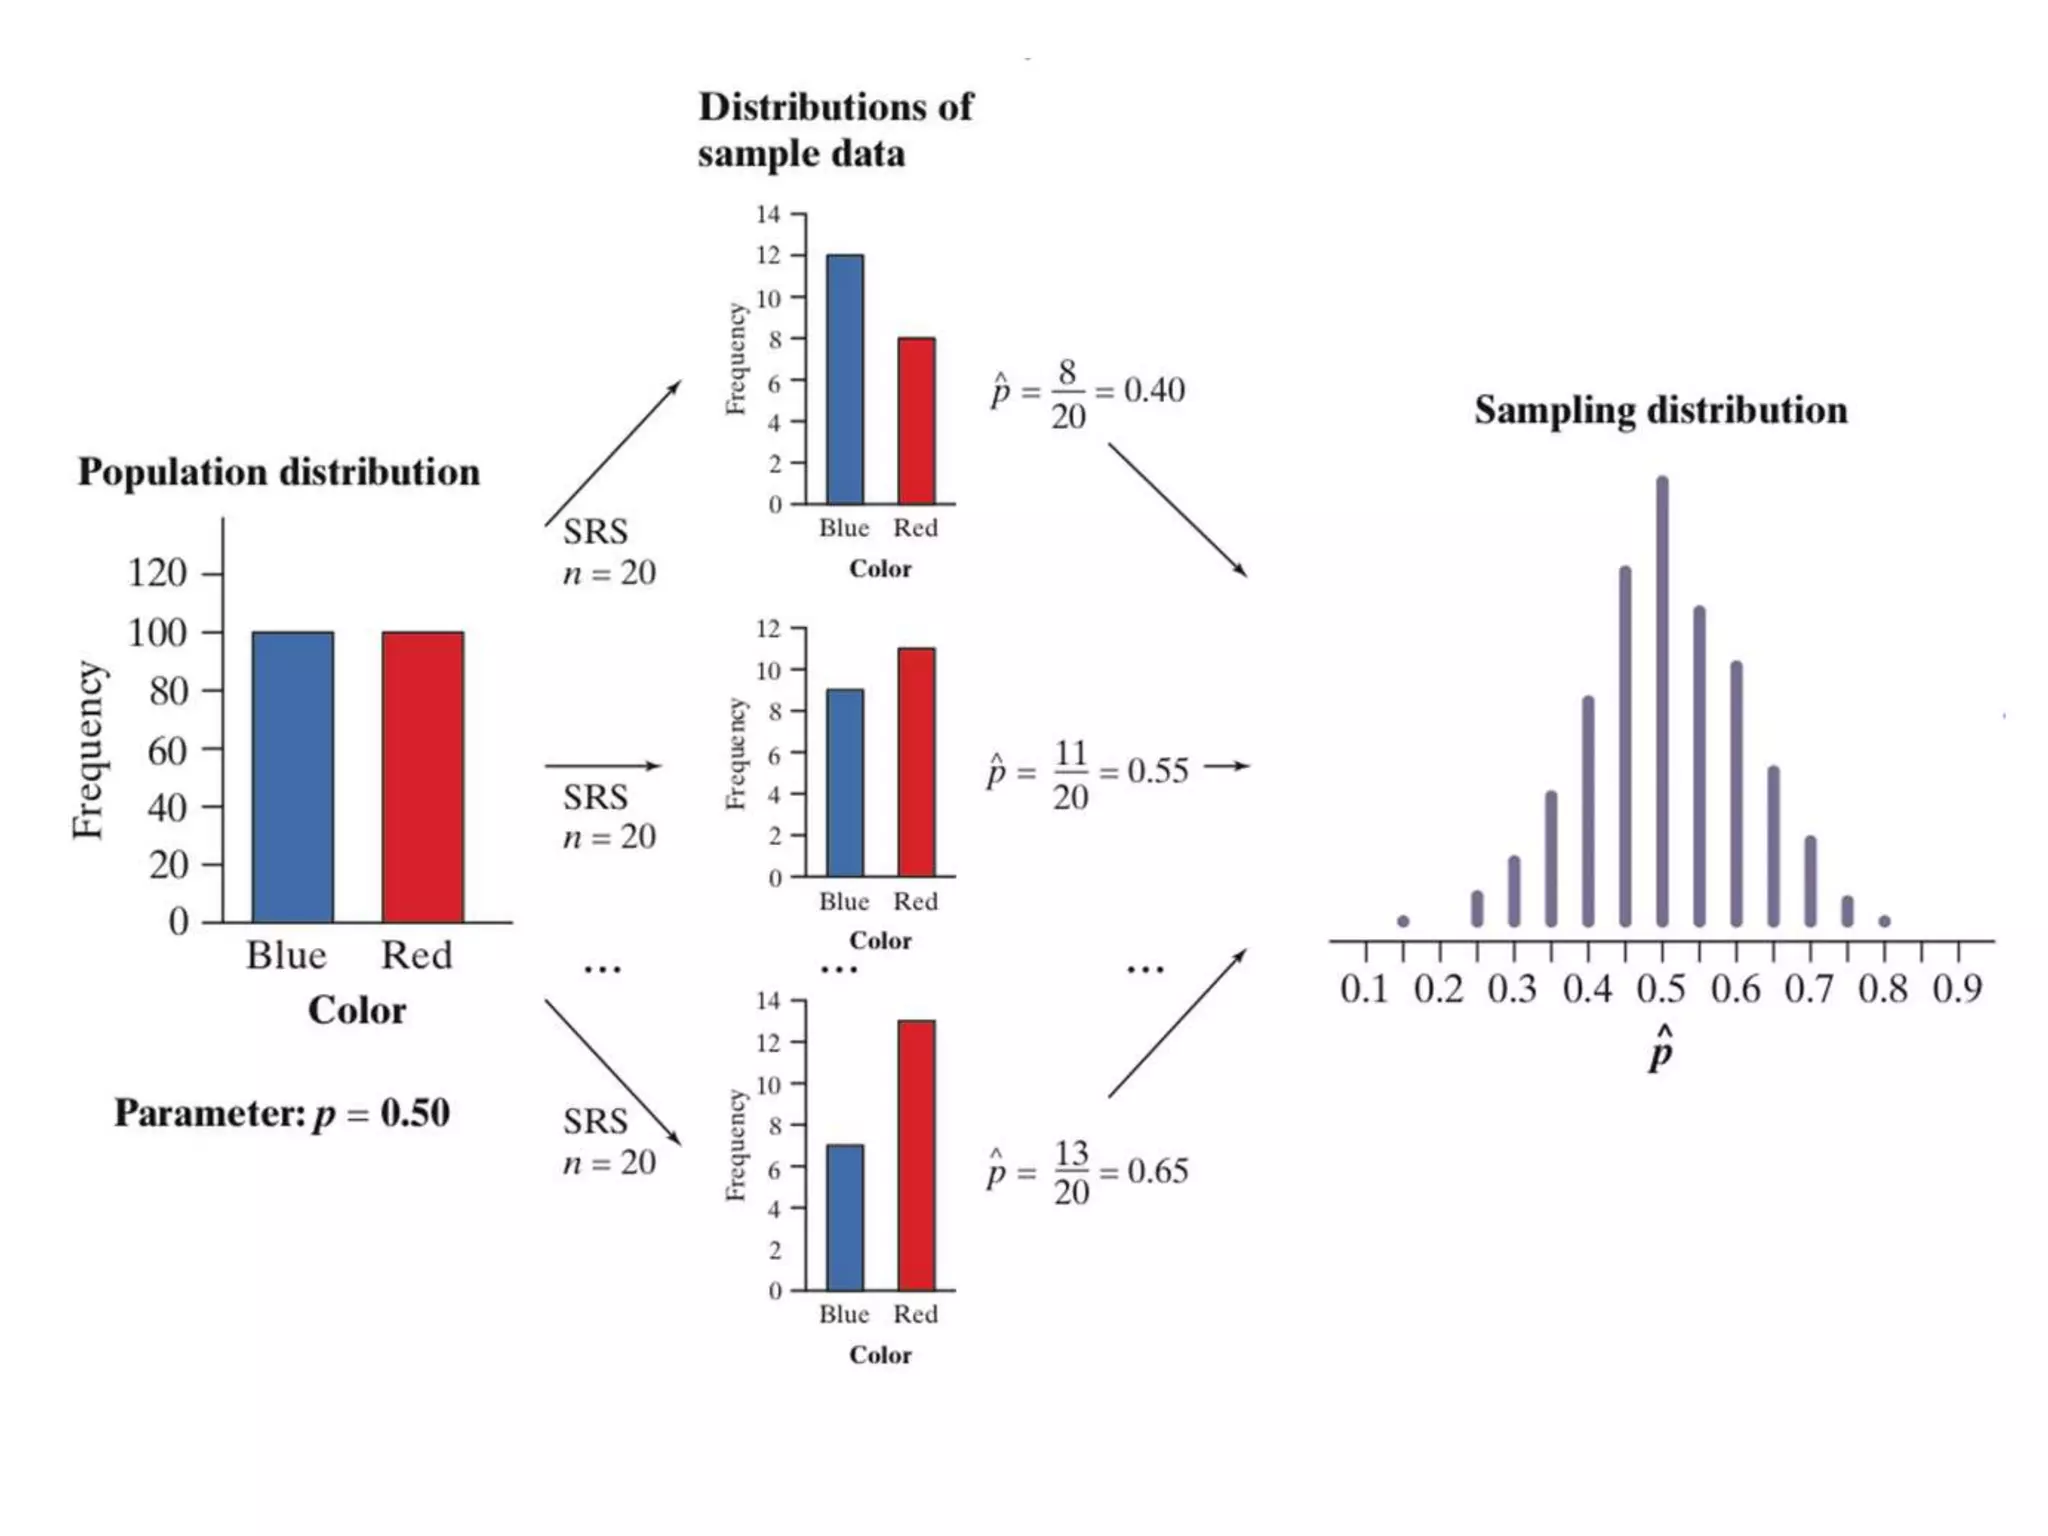
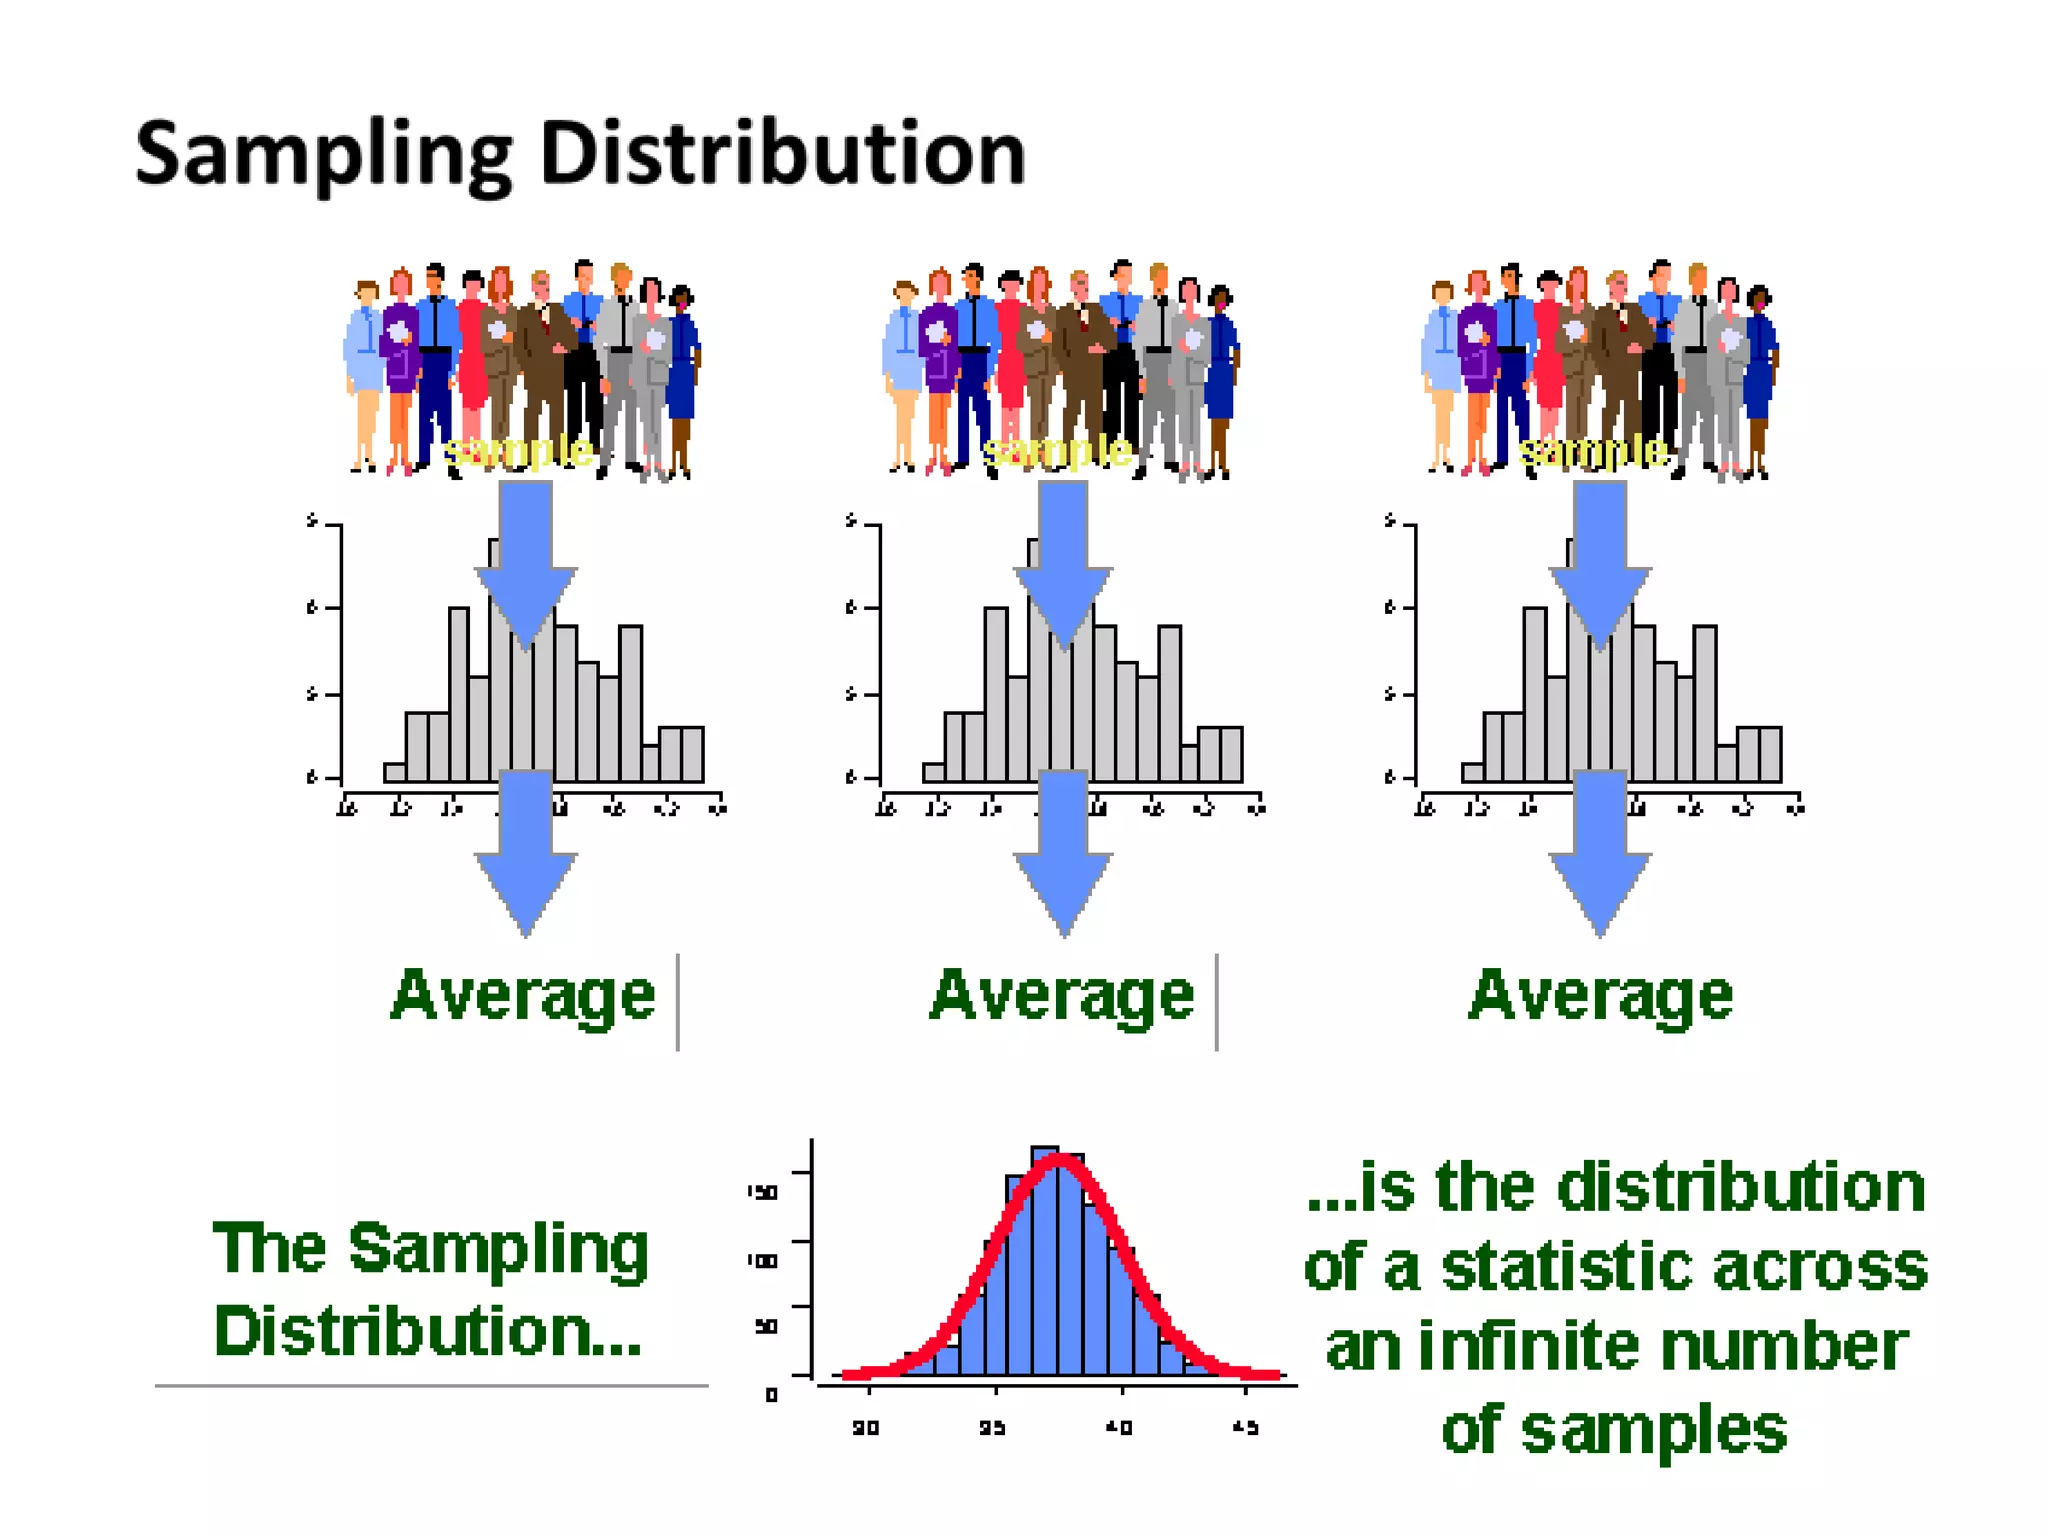
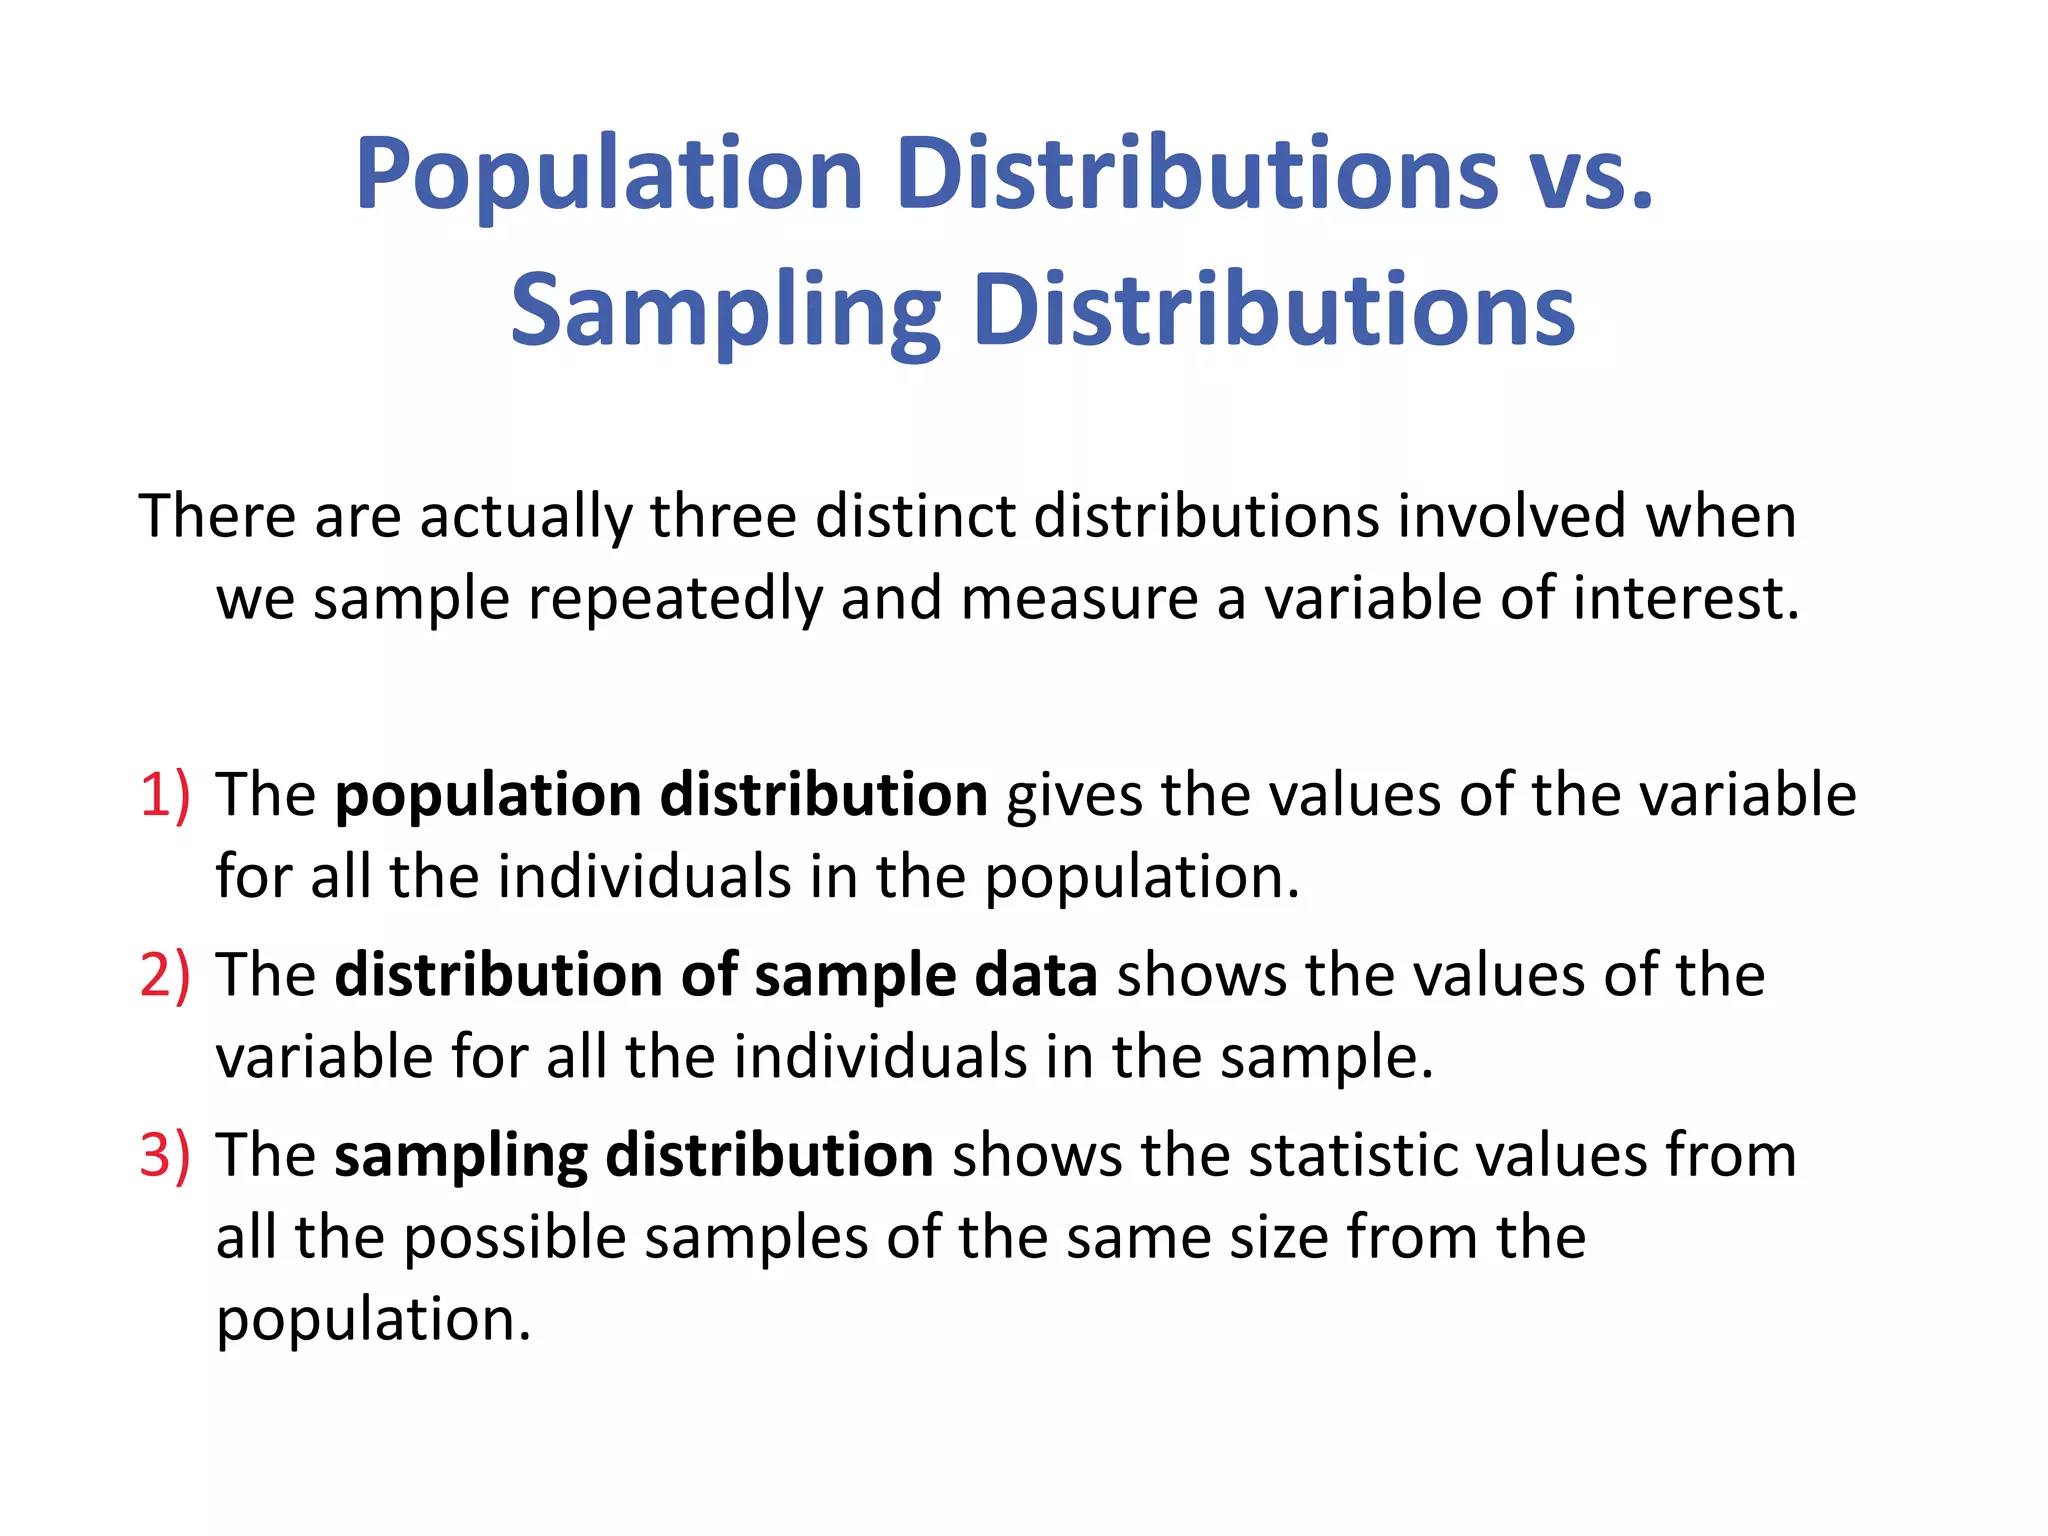
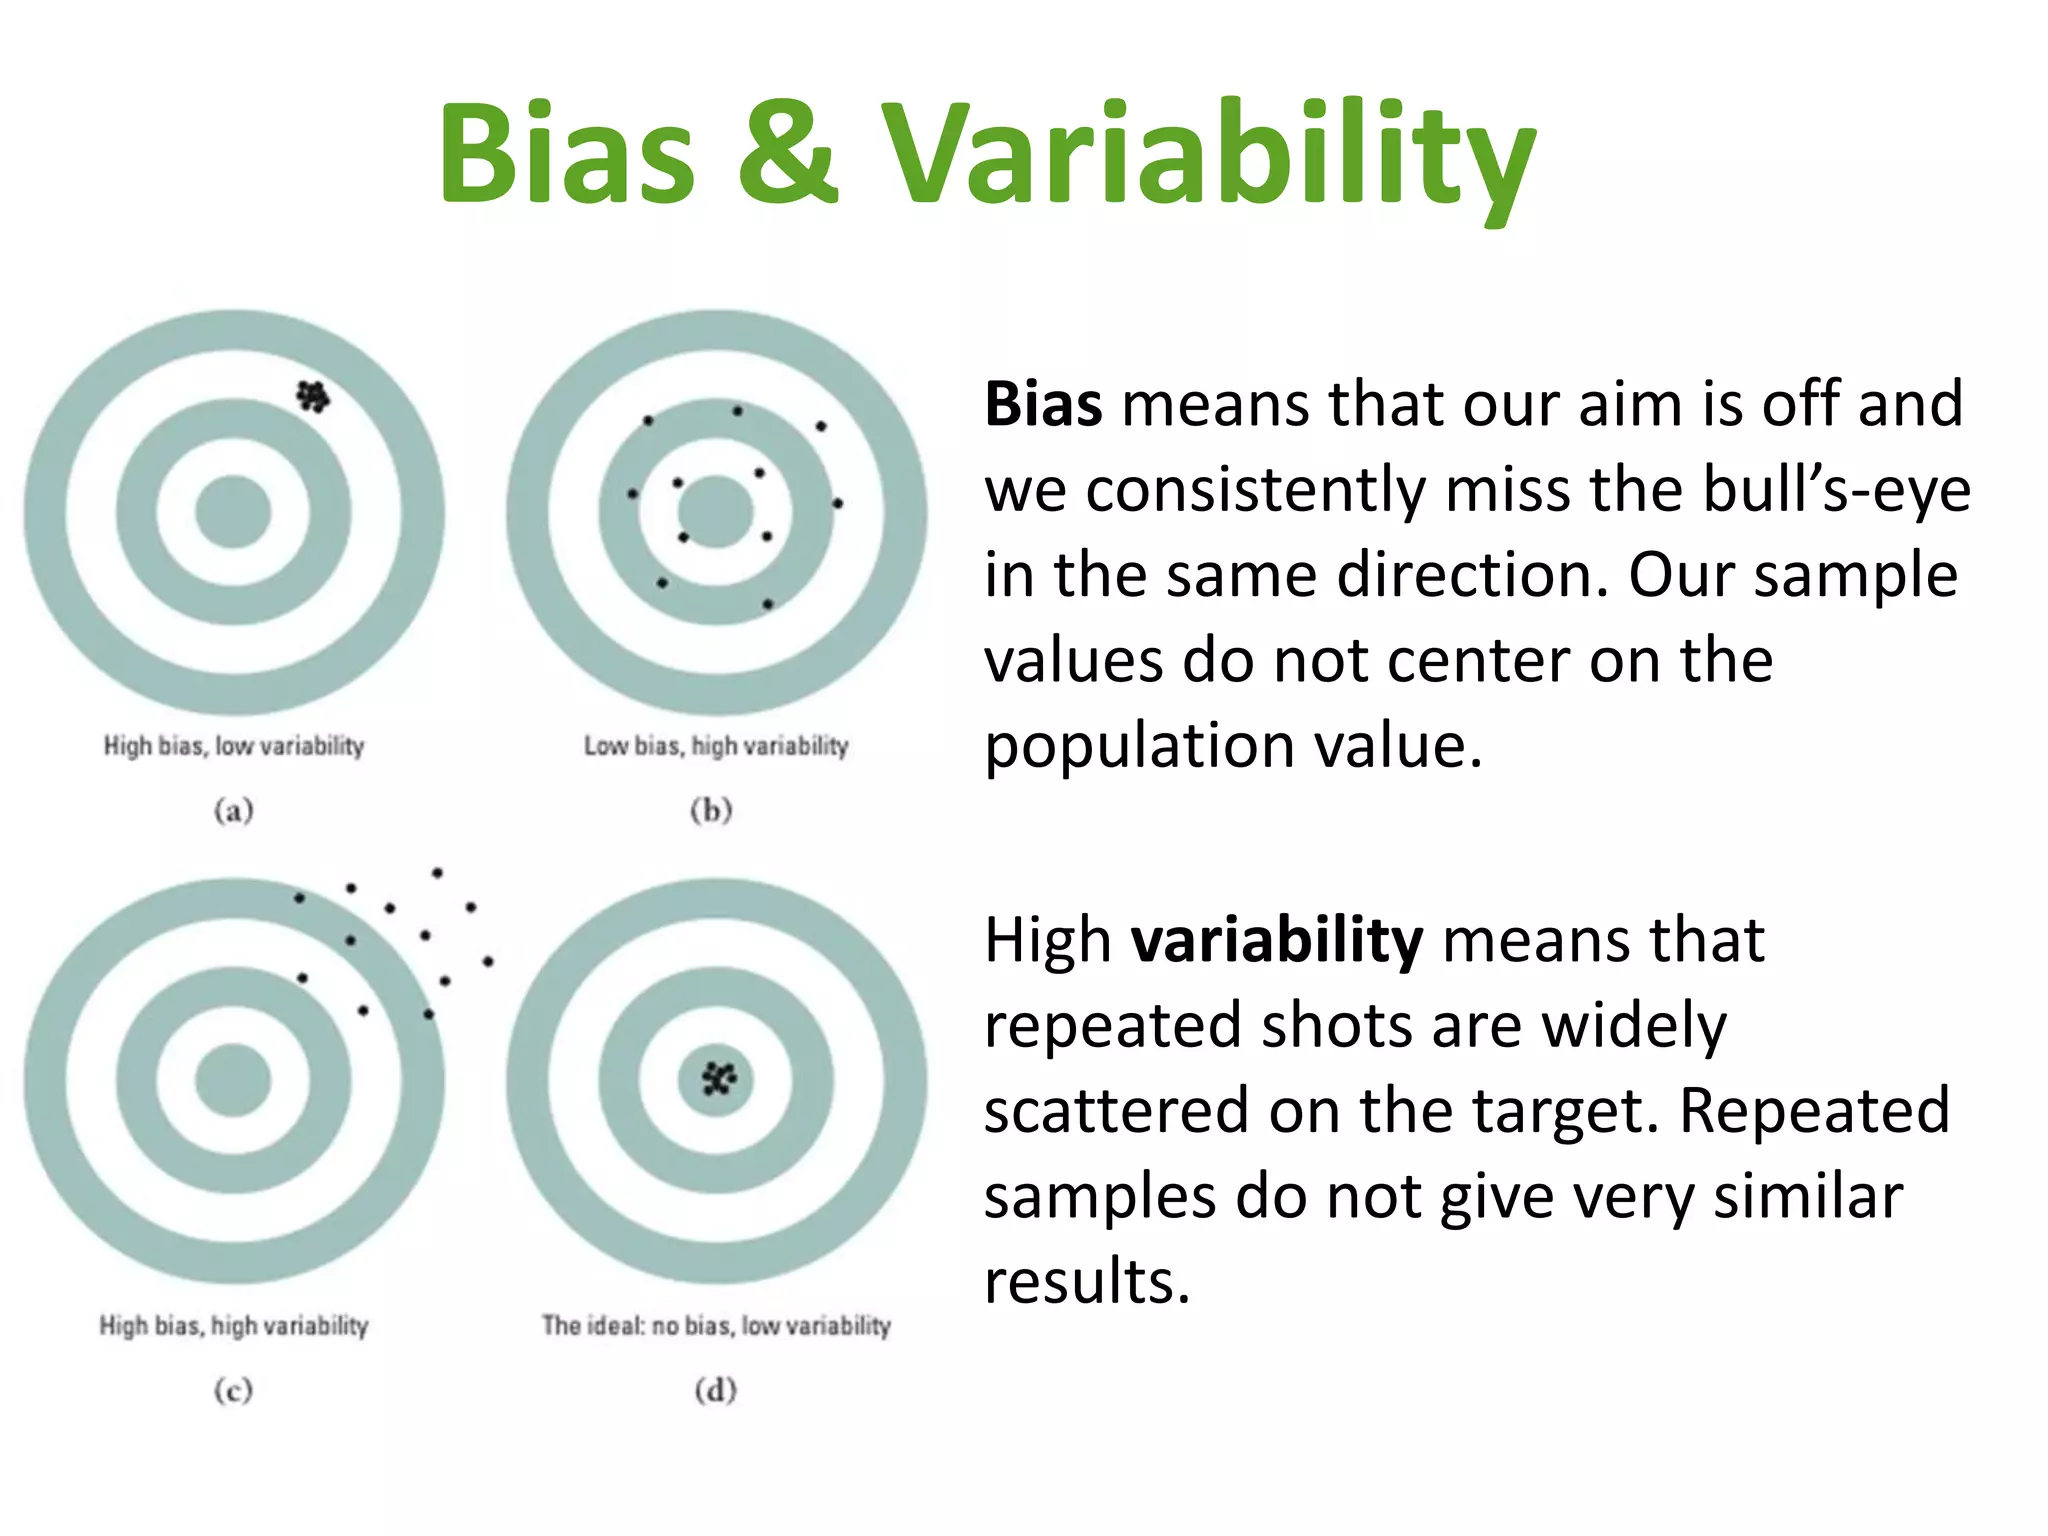

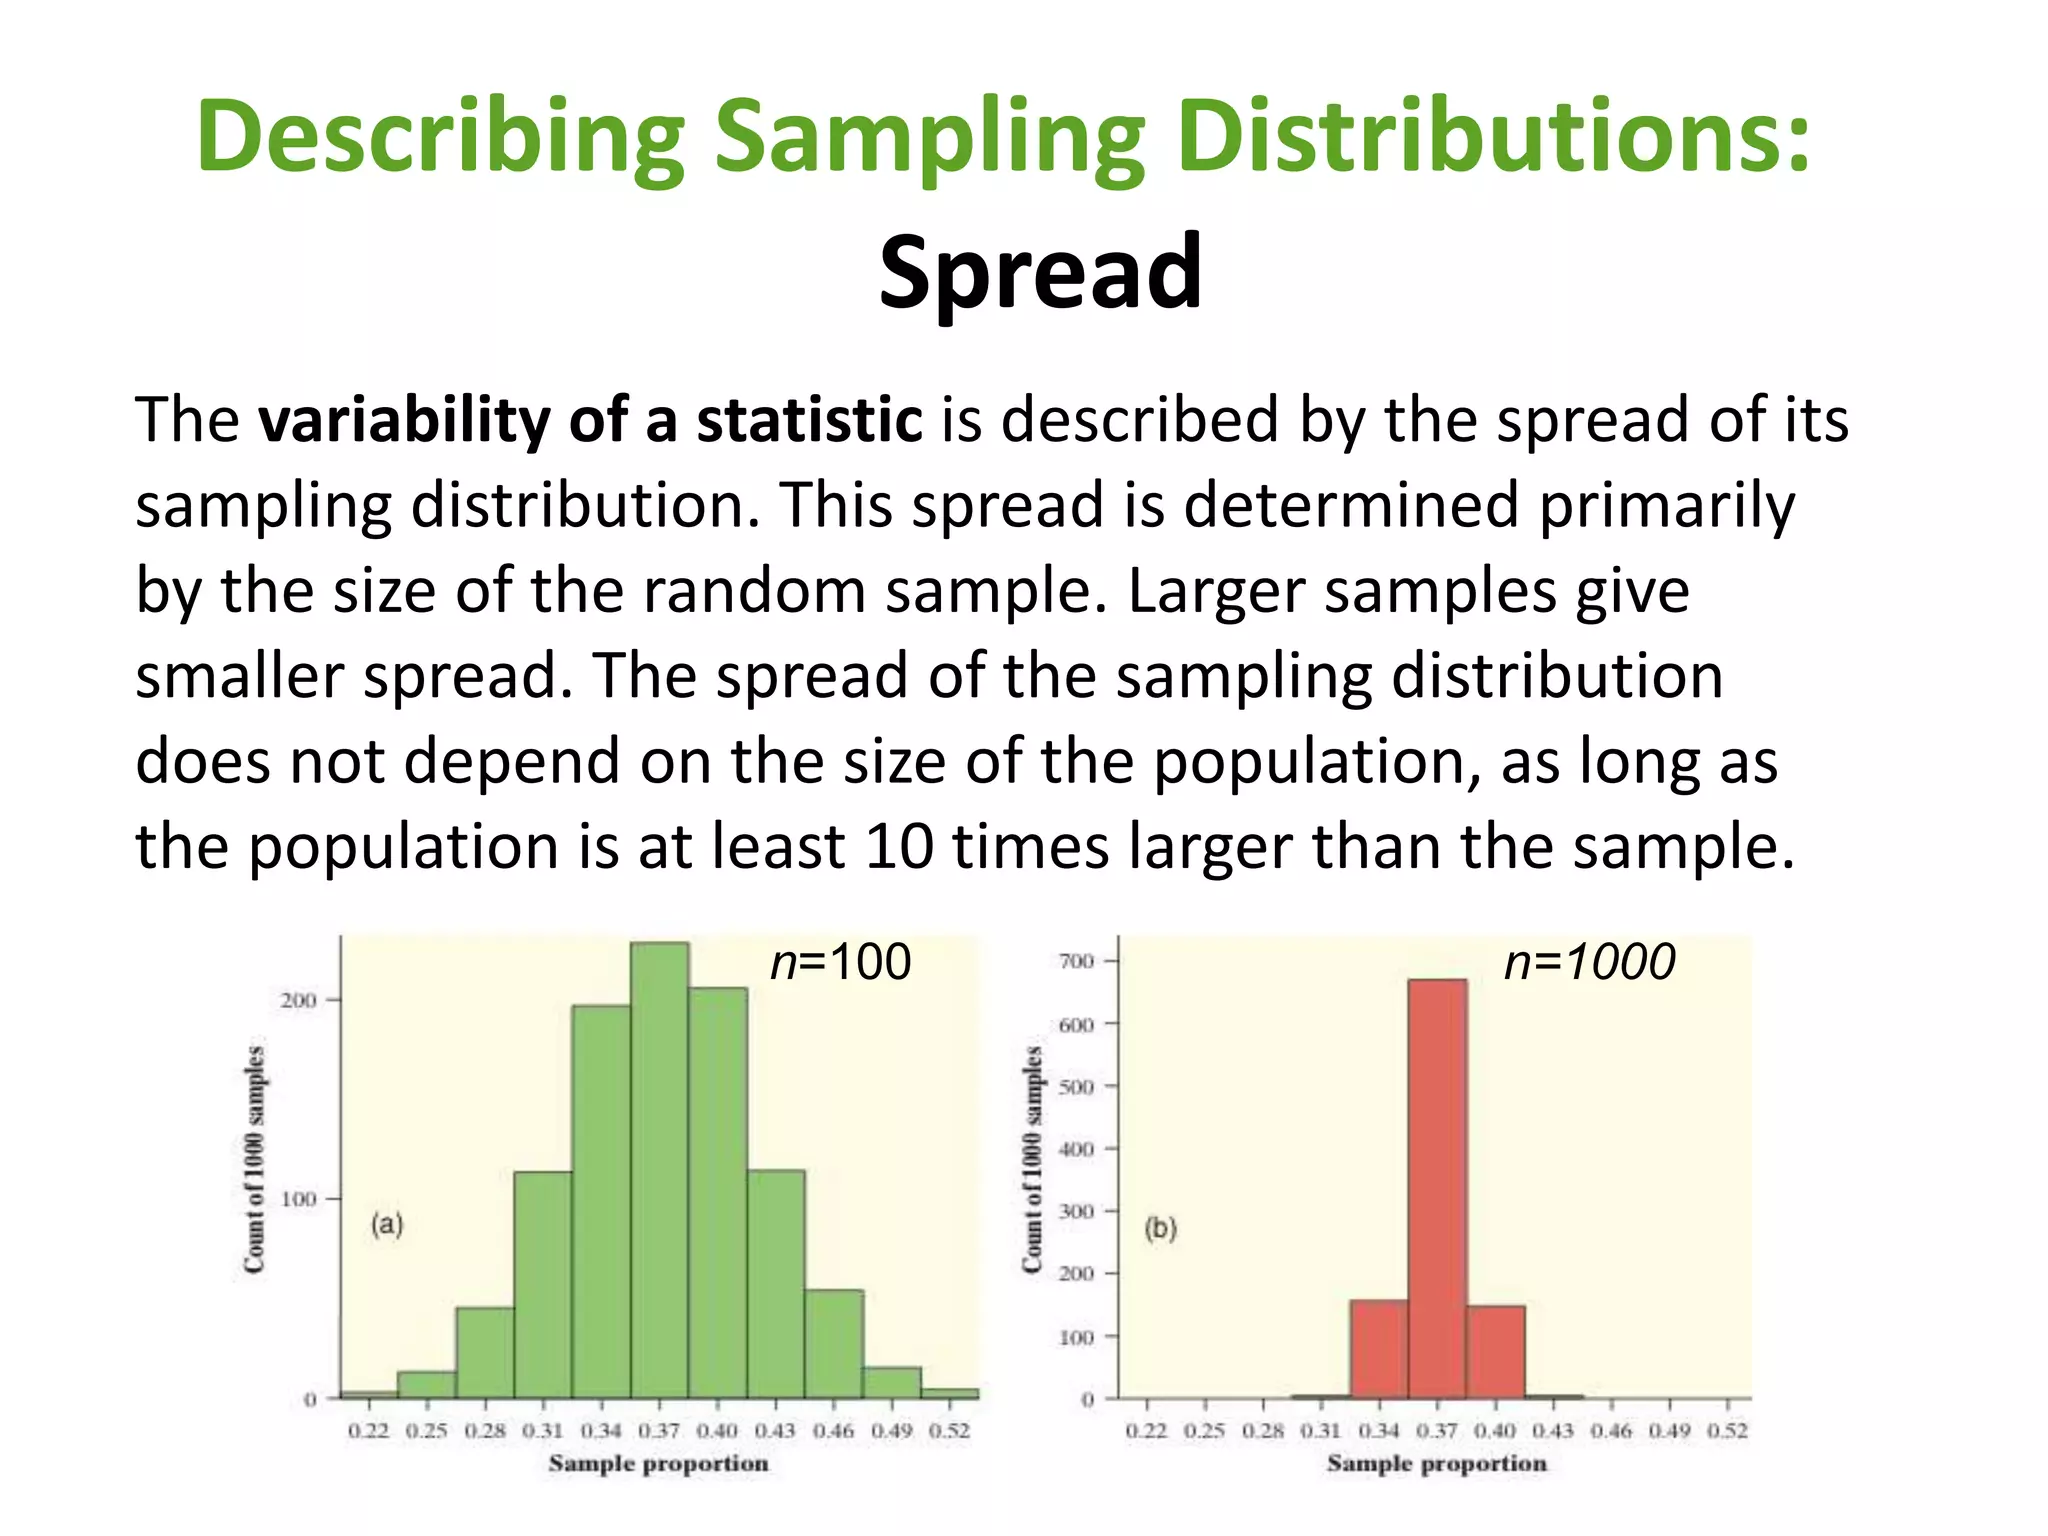
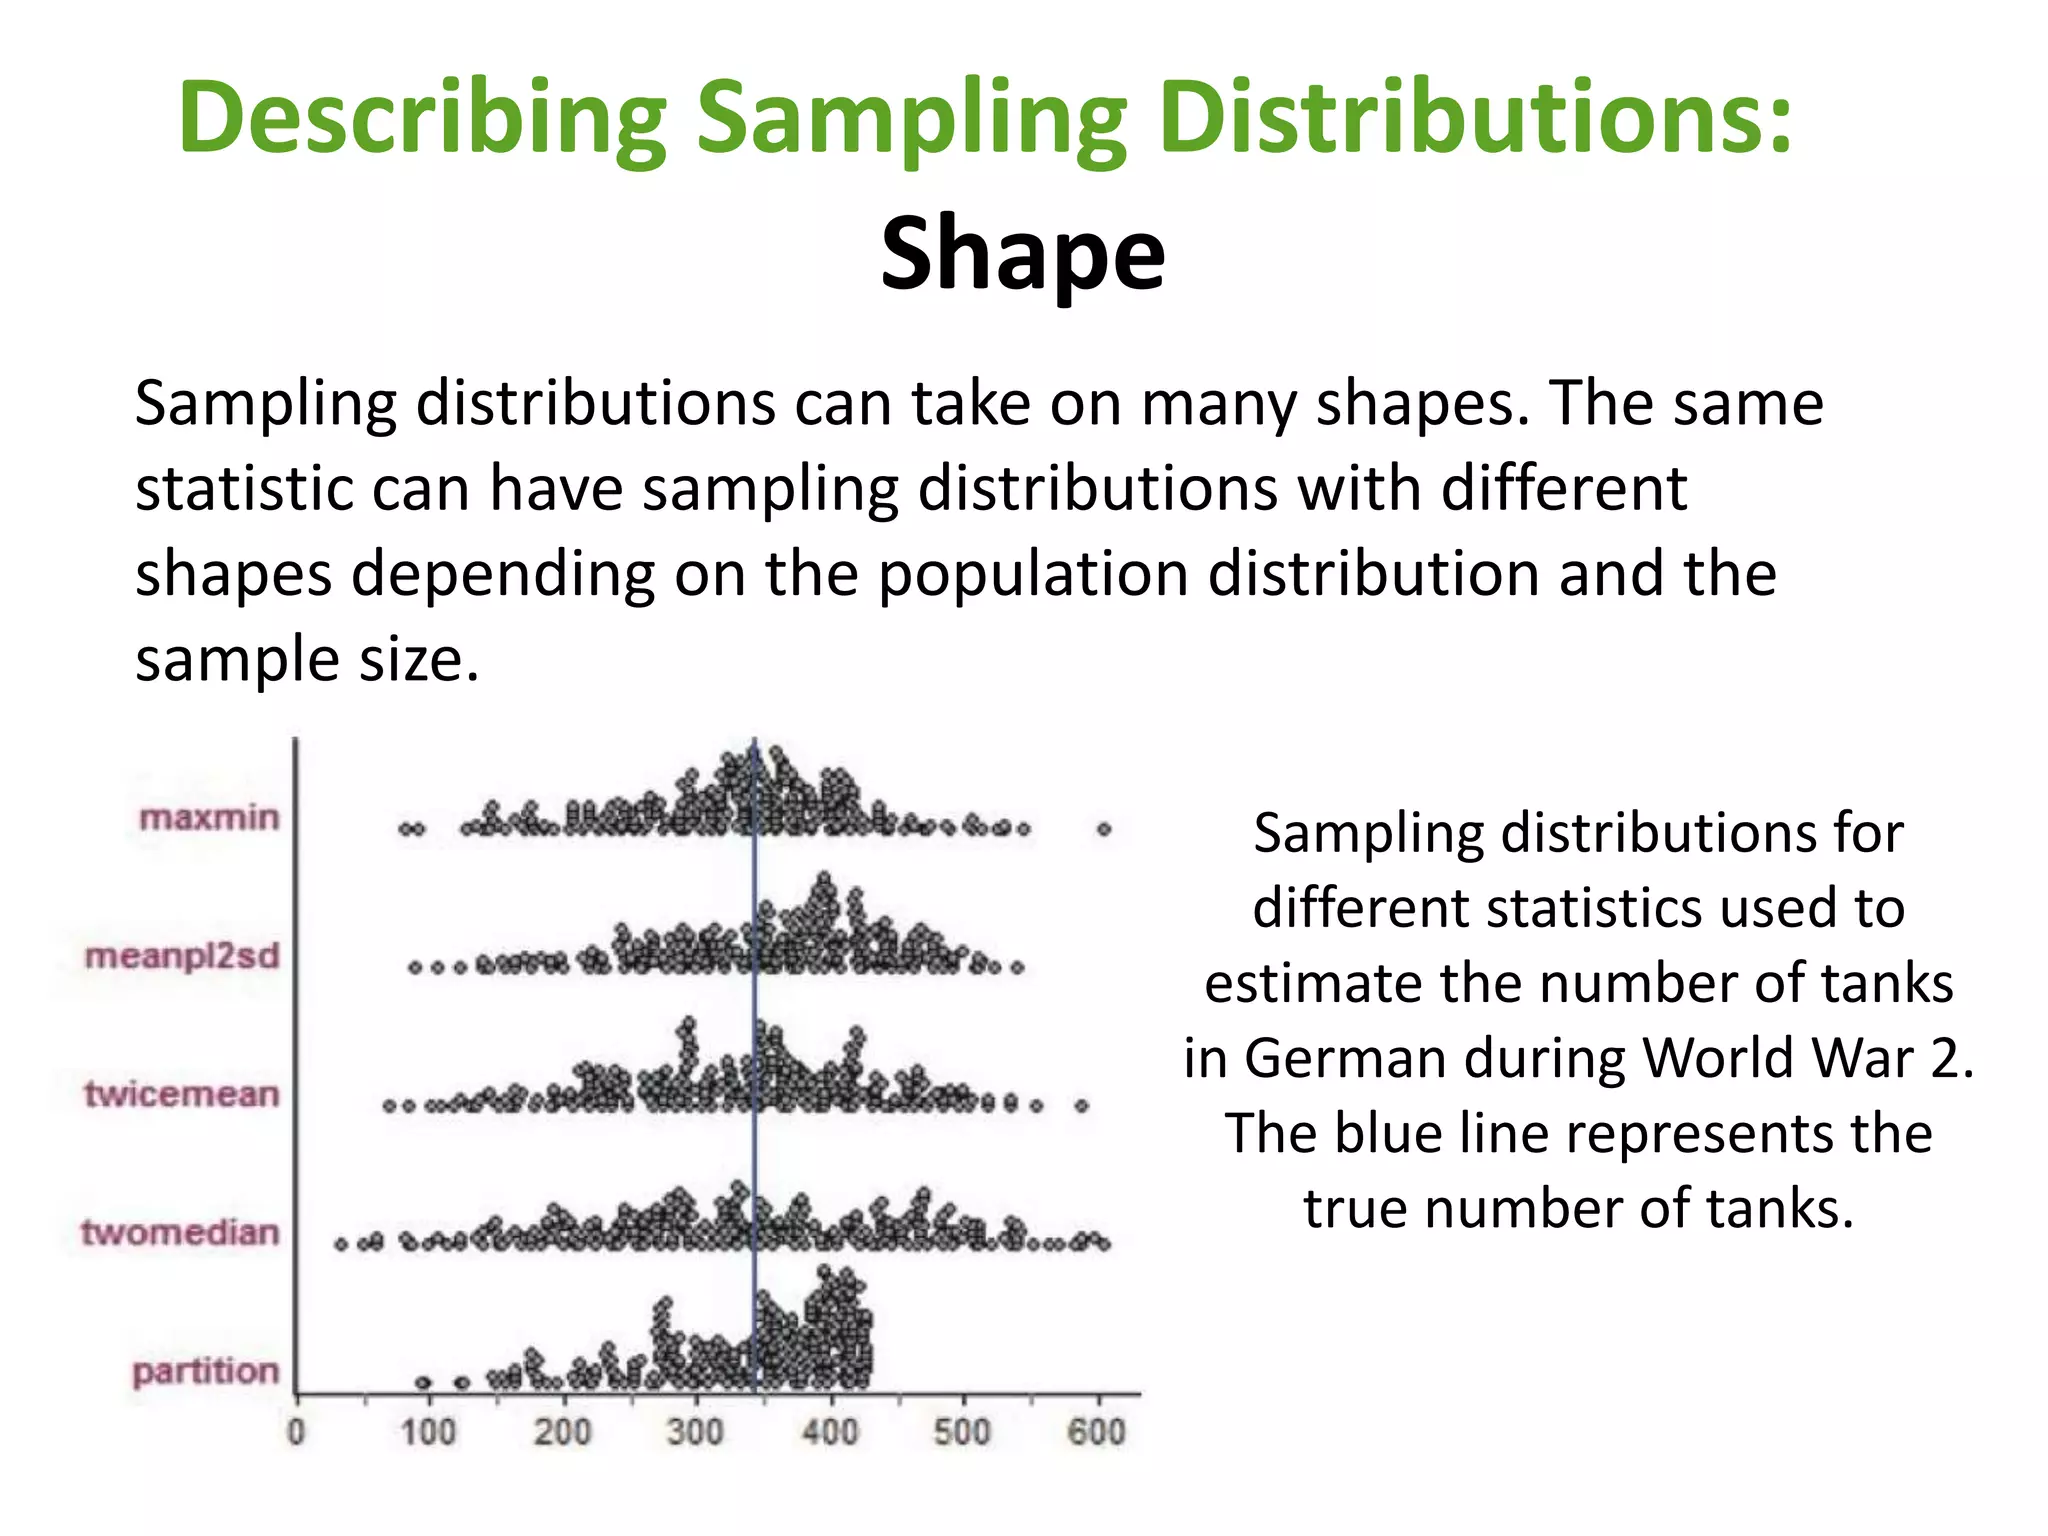

This document discusses sampling distributions and their relationship to statistical inference. It defines key terms like population, parameter, sample, and statistic. A sampling distribution describes the possible values of a statistic calculated from random samples of the same size from a population. It explains that there are population distributions, sample data distributions, and sampling distributions. The mean and spread of a sampling distribution determine if a statistic is an unbiased estimator and how variable it is. Larger sample sizes result in smaller variability in the sampling distribution.


