Downloaded 302 times


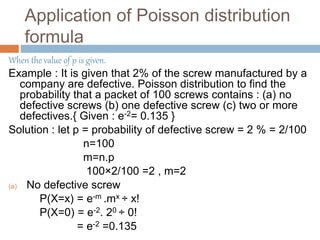
![(b) P(one defective )
P(X=1) = e-2. 21÷ 1!
= e-2×2
= 0.135 × 2 = 0.270
(c)P ( two or more defectives)
=1- [P(0)+P(1)]
= 1-[0.135+0.270]
= 1-0.405
= 0.595](https://image.slidesharecdn.com/mc206stat-171031070423/85/poisson-distribution-10-320.jpg)

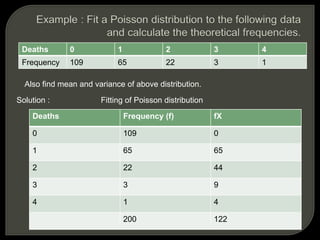
![Fitting of a Poisson Distribution
Step 1. firstly , we compute mean from the observed frequency data .
Mean = /N
Step 2. the value of e-m is obtained . If the value of e-m is not given in the
question .
e-m = Reciprocal [ Antilog (m × 0.4343)]
Step 3. then ,we compute the probability of 0,1 , 2, 3 or x success by using
Poisson distribution.
P(X=x) = e-m .mx ÷ x!](https://image.slidesharecdn.com/mc206stat-171031070423/85/poisson-distribution-12-320.jpg)

![Mean = 122 /200 = 0.61
m= 0.61
Now obtain the value of e-0.61
e-m = Reciprocal [ Antilog (m× 0.4343)]
Putting m=0.61
e-m = Reciprocal [ Antilog (0.61× 0.4343)]
= Rec. [antilog(0.26492)]
= Rec. [1.841]
=0.5432](https://image.slidesharecdn.com/mc206stat-171031070423/85/poisson-distribution-15-320.jpg)


The document presents information on the Poisson distribution: - It defines the Poisson distribution as a discrete probability distribution used for situations where events occur rarely and independently. - Properties of the Poisson distribution are discussed, including that it has one parameter (m), and the mean and variance are equal to m. - Examples of when the Poisson distribution can be applied are given, such as counting defects, bacteria, phone calls, or road accidents. - Steps for applying the Poisson distribution formula and fitting observed data to a Poisson distribution are outlined.


