Downloaded 3,223 times


![• P [x<70] = P[z<-2] = 0.5 – P[0<z<2]
=0.5 – 0.4772
=0.0228 or 2.28%
-2](https://image.slidesharecdn.com/normaldistribution-160627092159/85/Normal-distribution-17-320.jpg)

![• P [x>82] = P[z>0.4] = 0.5 – P[0>z>0.4]
=0.5 – 0.1554
=0.3446 or 34.46%
0.4](https://image.slidesharecdn.com/normaldistribution-160627092159/85/Normal-distribution-19-320.jpg)


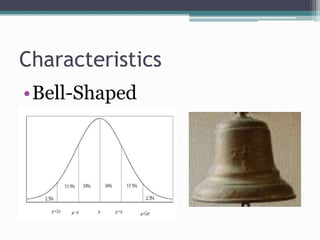
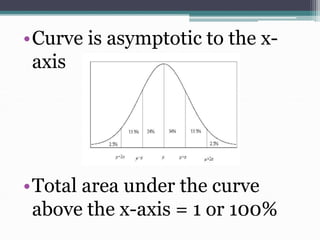
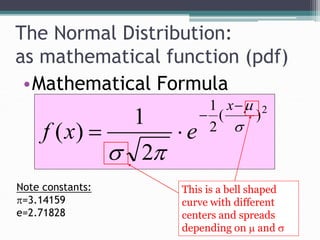
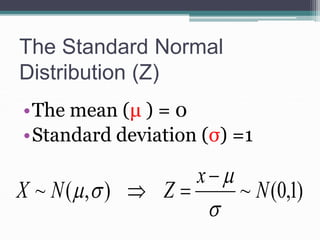
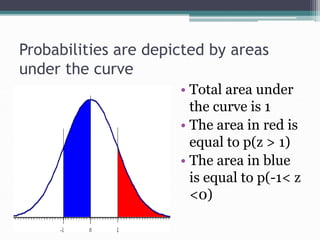
The normal distribution is a continuous probability distribution that is symmetric and bell-shaped. It is defined by its mean and standard deviation. Many real-world variables are approximately normally distributed. The standard normal distribution refers to a normal distribution with a mean of 0 and standard deviation of 1. The normal distribution is commonly used to model variables and calculate probabilities related to areas under the normal curve.


