This document discusses key concepts about the normal distribution:
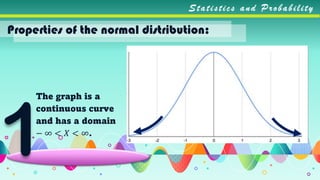
1. It defines the normal distribution as a bell-shaped probability distribution that is symmetric around the mean.
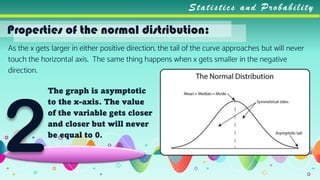
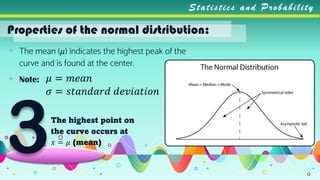
2. It lists 7 key properties of the normal distribution, including that it is continuous and asymptotic to the x-axis, peaks at the mean, is symmetrical, and corresponds to the empirical rule about percentages of data.
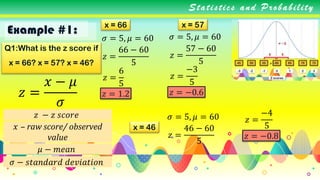
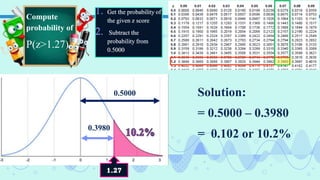
3. It provides examples of computing z-scores from raw values and using z-tables to find the probability or area under the normal curve for given z-values.