The Normal
Distribution:
A normaldistribution is a
probability distribution that is
continuous, symmetric and bell -
shaped distribution of a variable
3.
Properties of NormalDistribution
✅The graphical representation of a normal distribution is a bell
- shaped curved.
✅The mean, median, and mode of a normal distribution are identical
The tail end of the curve of normal distribution is asymptotic to x-axis.
✅The total area of the normal curve is 1.
✅The normal curve is continuous at any point.
✅The normal curve is symmetric around the mean, where mean
is located at the middle of the normal curve.
5.
Properties of NormalDistribution
✅ The are under the part of a normal curve that lies within 1 standard deviation of the mean is
approximately 0.68, ог 68%; within 2 standard deviations, about 0.95, or 95%; and within 3
standard deviations, about 0.997, or 99.7%.
Remarks:
The mean and standard deviation of the distribution plays an important role on how the curve
looks like. If the curve is normal, the mean is always in the middle of the
curve while the standard deviation defines the height and the width of the normal curve.
6.
As we observed,when the value of the standard
deviation is small, then the normal curve is tall and
narrow, otherwise the value of standard deviation is
big.
DEFINITIONS:
The standard normal distribution is a normal
distribution with a mean is zero and standard
deviation is 1.
Standard Score or Z Score is the number of standard.
deviations that a particular X value is away from the
mean.
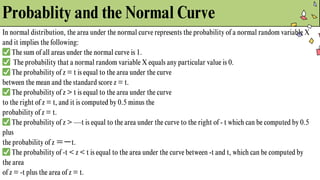
Probablity and theNormal Curve
In normal distribution, the area under the normal curve represents the probability of a normal random variable X
and it implies the following:
✅The sum of all areas under the normal curve is 1.
✅ The probability that a normal random variable X equals any particular value is 0.
✅The probability of z = t is equal to the area under the curve
between the mean and the standard score z = t.
✅The probability of z > t is equal to the area under the curve
to the right of z = t, and it is computed by 0.5 minus the
probability of z = t.
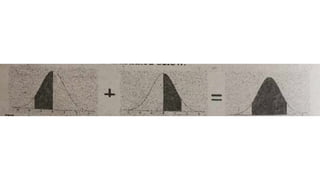
✅The probability of z > —t is equal to the area under the curve to the right of - t which can be computed by 0.5
plus
the probability of z =ーt.
✅The probability of -t < z < t is equal to the area under the curve between -t and t, which can be computed by
the area
of z = -t plus the area of z = t.
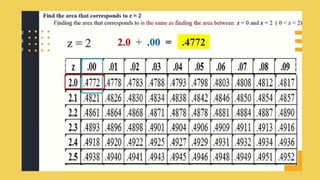
13.
a. At z= 1.52 means that the area
under
the curve between the mean (z-0)
and
z = 1.52 as illustrated on the right,
and by looking at table A (z table),
since
z = 1.52
we will get the intersection of row
1.5 and column 0.02 then,
the area of z = 1.52 is 0.4357.
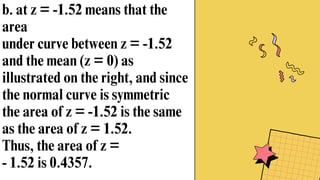
b. at z= -1.52 means that the
area
under curve between z = -1.52
and the mean (z = 0) as
illustrated on the right, and since
the normal curve is symmetric
the area of z = -1.52 is the same
as the area of z = 1.52.
Thus, the area of z =
- 1.52 is 0.4357.
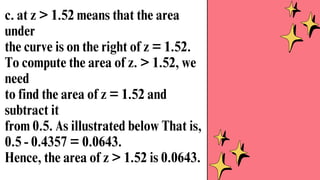
c. at z> 1.52 means that the area
under
the curve is on the right of z = 1.52.
To compute the area of z. > 1.52, we
need
to find the area of z = 1.52 and
subtract it
from 0.5. As illustrated below That is,
0.5 - 0.4357 = 0.0643.
Hence, the area of z > 1.52 is 0.0643.
d. at z> -1.52 means that the area
under the curve is on the right of z
= -1.52. To obtain the area of z >
-1.52, we will compute the area of
z = -1.52 plus 0.5 as illustrated
below. Since the area of z = -1.52
is 0.4357, then we have
0.4357 + 0.5 = 0.9357.
Thus, the area of z> -1.52 is
0.9357.
e. at -1.52< z < 1.52 means that the
area
under the curve is between z = -1.52
and
z = 1.52. To compute for the area of
-1.52 < z < 1.52, we will compute the
area of z = -1.52 and z = 1.52 as
illustrated below. That is, 0.4357 +
0.4357 = 0.8714.
Thus, the area between z = -1.52 and z
= 1.52 is 0.8714.
24.
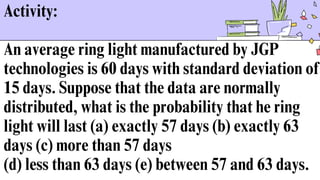
Activity:
An average ringlight manufactured by JGP
technologies is 60 days with standard deviation of
15 days. Suppose that the data are normally
distributed, what is the probability that he ring
light will last (a) exactly 57 days (b) exactly 63
days (c) more than 57 days
(d) less than 63 days (e) between 57 and 63 days.
25.
Solution:
Given the mean* = 60 and & = 15 then
(a) P(exactly 57 days), so x = 57 and to find z we
have
28.
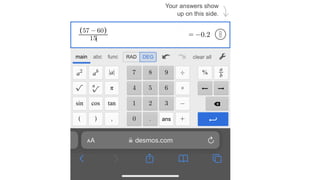
Solution:
57-60 3
Z= ———= - —— = - 0.2
15 15
By getting the area under the normal curve, using table A, we have the area
under curve
of z = - 0.2 is
0.0793. Hence,
the
probability that the ring light will lasts for 50 days is 7.93%.
(b) P(exactly 63 days), so x = 63, to find z
we have
29.
Solution:
63 - 60
Z=——— = - 0.2
15
It implies that the area of z = 0.2 is 0.0793. Thus, the
probability that
the ring light will lasts for 63 days is 7.93%.
(c) P(more than 57 days), so x > 57, to solve z we have
30.
Solution:
57-60
Z= ——— =- 0.2
15
Thus z > -0.2.
By getting the area of z > -0.2, we have 0.0793 + 0.5 = 0.5793.
Thus, the area of z. > -0.2 is 0.5793. Hence, the probability that
the ring light will lasts for more than 57 days is 57.93%.
(d) P(less than 63 days), so x < 63 and to find z we have,
31.
Solution:
63 - 60
Z=——— = - 0.2
15
Thus, 2 < 0.2
By getting the area of z. < 0.2, we have
0.5 + 0.0793 = 0.5793.
Thus, the area of z < 0.2 is 0.5793. Hence, the probability that the ring light will lasts for
less than 63 days is 57.93%.
(e) P(Between 57 and 63 days), using (a) and (b) we have z = -0.2 and
z = 0.2 then the area between -0.2 < z < 0.2 is given by
0.0793 + 0.0793 = 0.1586.
Thus, the probability that the ring light will lasts between 57 and 63 days
Is 15.86%.