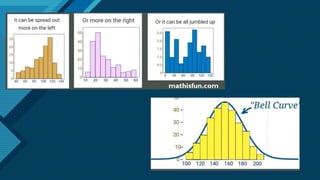
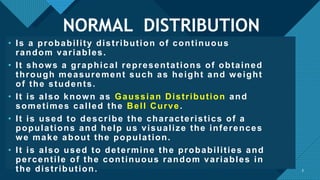
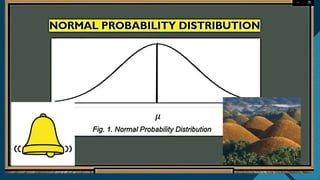
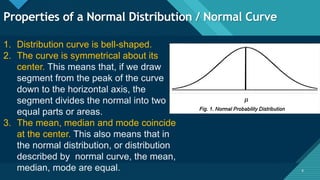
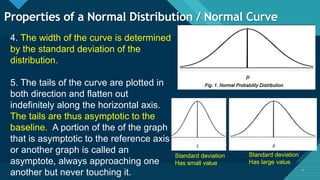
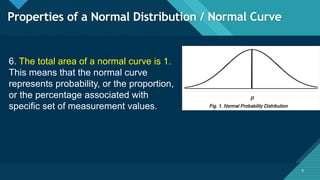
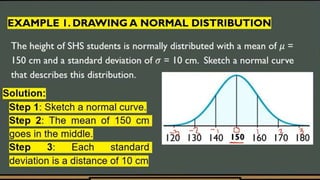
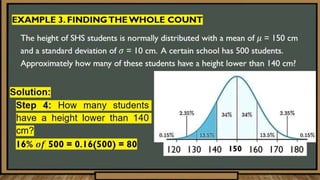
Click to edit Master title style
1
Click to edit Master title style
2
The Normal
Distribution and
Its Properties
Click to edit Master title style
3
NORMAL DISTRIBUTION
• Is a probability distribution of continuous
random variables.
• It shows a graphical representations of obtained
through measurement such as height and weight
of the students.
• It is also known as Gaussian Distribution and
sometimes called the Bell Curve.
• It is used to describe the characteristics of a
populations and help us visualize the inferences
we make about the population.
• It is also used to determine the probabilities and
percentile of the continuous random variables in
the distribution. 3
Click to edit Master title style
4 4
Click to edit Master title style
5 5
Click to edit Master title style
6
Properties of a Normal Distribution / Normal Curve
6
1. Distribution curve is bell-shaped.
2. The curve is symmetrical about its
center. This means that, if we draw
segment from the peak of the curve
down to the horizontal axis, the
segment divides the normal into two
equal parts or areas.
3. The mean, median and mode coincide
at the center. This also means that in
the normal distribution, or distribution
described by normal curve, the mean,
median, mode are equal.
Click to edit Master title style
7 7
4. The width of the curve is determined
by the standard deviation of the
distribution.
5. The tails of the curve are plotted in
both direction and flatten out
indefinitely along the horizontal axis.
The tails are thus asymptotic to the
baseline. A portion of the of the graph
that is asymptotic to the reference axis
or another graph is called an
asymptote, always approaching one
another but never touching it.
Properties of a Normal Distribution / Normal Curve
Standard deviation
Has small value
Standard deviation
Has large value
Click to edit Master title style
8 8
6. The total area of a normal curve is 1.
This means that the normal curve
represents probability, or the proportion,
or the percentage associated with
specific set of measurement values.
Properties of a Normal Distribution / Normal Curve
Click to edit Master title style
9 9
• are the points that mark the change in the curve’s
concavity.
• the point at which a change in the direction of curve at
mean minus standard deviation and mean plus
standard deviation.
• Note that each inflection point of
• the normal curve is one standard deviation away from
the mean.
Inflection Point
Click to edit Master title style
10
“
10
Click to edit Master title style
11
Click to edit Master title style
12
Let’s try this!
12
Sketch the normal curve of each
distribution
1. Mean = 95, Standard deviation = 12
2. Mean = 60 ; Standard deviation = 6
3. Mean = 23.8; Standard deviation = 5.2
Click to edit Master title style
13
Click to edit Master title style
14
Let’s try this!
14
A continuous random variable X is
normally distributed with a mean of 45 and
standard deviation of 6. Find the
percentage of the following:
1. P( 39 < X > 51)
2. P ( X > 45)
3. P ( X < 39)
Click to edit Master title style
15
Click to edit Master title style
16
Evaluation
16
Multiple Choice. Choose the letter of the
best answer.
1. What is another name for normal distribution?
A. Gaussian distribution
B. Poisson distribution
C. Bernoulli’s distribution
D. Probability distribution
2. What is the total area in the distribution under the curve?
A. 0
B. 1
C. 2
D. 3
Click to edit Master title style
17
Evaluation
17
Multiple Choice. Choose the letter of the
best answer.
3. What marks the change in the curve’s concavity?
A. curve
B. inflection points
C. mean
D. standard deviation
4. Which value is found at the center of the normal curve?
A. mean
B. median
C. mode
D. all of the above
Click to edit Master title style
18
Evaluation
18
Multiple Choice. Choose the letter of the
best answer.
5. Which of the following is a parameter of normal distribution?
A. mean
B. standard deviation
C. mean and standard deviation
D. none of the above
6. Which of the following symbols is used to denote the mean?
A.ó
B. μ
C. α
D. ∞
Click to edit Master title style
19
Evaluation
19
Multiple Choice. Choose the letter of the
best answer.
7. Which of the following does not describe a normal curve?
A. asymptotic
B. bell-shaped
C. discrete
D. symmetrical about the mean
8. What percent of the area under a normal curve is within 2
standard deviations?
A. 68.3%
B. 95.4%
C. 99.7%
D. 100%
Click to edit Master title style
20
Evaluation
20
Multiple Choice. Choose the letter of the
best answer.
9. What percent of the area under a normal curve is within 1
standard deviation?
A. 68.3%
B. 95.4%
C. 99.7%
D. 100%
10. What percent of the area under a normal curve is within 3
standard deviations?
A. 68.3% C. 99.7%
B. 95.4% D. 100%
Click to edit Master title style
21
Additional Activity
21
Directions: Make a sketch for each of the 3 areas under
the normal curve as stated in the empirical rule. Using a
mosaic art, shade the area that corresponds to the area
under the normal curve. You may use eggshells, old
magazines, dried leaves or any materials available at
home.

Normal Distribution and its characteristics.pptx

  • 1.
    Click to editMaster title style 1
  • 2.
    Click to editMaster title style 2 The Normal Distribution and Its Properties
  • 3.
    Click to editMaster title style 3 NORMAL DISTRIBUTION • Is a probability distribution of continuous random variables. • It shows a graphical representations of obtained through measurement such as height and weight of the students. • It is also known as Gaussian Distribution and sometimes called the Bell Curve. • It is used to describe the characteristics of a populations and help us visualize the inferences we make about the population. • It is also used to determine the probabilities and percentile of the continuous random variables in the distribution. 3
  • 4.
    Click to editMaster title style 4 4
  • 5.
    Click to editMaster title style 5 5
  • 6.
    Click to editMaster title style 6 Properties of a Normal Distribution / Normal Curve 6 1. Distribution curve is bell-shaped. 2. The curve is symmetrical about its center. This means that, if we draw segment from the peak of the curve down to the horizontal axis, the segment divides the normal into two equal parts or areas. 3. The mean, median and mode coincide at the center. This also means that in the normal distribution, or distribution described by normal curve, the mean, median, mode are equal.
  • 7.
    Click to editMaster title style 7 7 4. The width of the curve is determined by the standard deviation of the distribution. 5. The tails of the curve are plotted in both direction and flatten out indefinitely along the horizontal axis. The tails are thus asymptotic to the baseline. A portion of the of the graph that is asymptotic to the reference axis or another graph is called an asymptote, always approaching one another but never touching it. Properties of a Normal Distribution / Normal Curve Standard deviation Has small value Standard deviation Has large value
  • 8.
    Click to editMaster title style 8 8 6. The total area of a normal curve is 1. This means that the normal curve represents probability, or the proportion, or the percentage associated with specific set of measurement values. Properties of a Normal Distribution / Normal Curve
  • 9.
    Click to editMaster title style 9 9 • are the points that mark the change in the curve’s concavity. • the point at which a change in the direction of curve at mean minus standard deviation and mean plus standard deviation. • Note that each inflection point of • the normal curve is one standard deviation away from the mean. Inflection Point
  • 10.
    Click to editMaster title style 10 “ 10
  • 11.
    Click to editMaster title style 11
  • 12.
    Click to editMaster title style 12 Let’s try this! 12 Sketch the normal curve of each distribution 1. Mean = 95, Standard deviation = 12 2. Mean = 60 ; Standard deviation = 6 3. Mean = 23.8; Standard deviation = 5.2
  • 13.
    Click to editMaster title style 13
  • 14.
    Click to editMaster title style 14 Let’s try this! 14 A continuous random variable X is normally distributed with a mean of 45 and standard deviation of 6. Find the percentage of the following: 1. P( 39 < X > 51) 2. P ( X > 45) 3. P ( X < 39)
  • 15.
    Click to editMaster title style 15
  • 16.
    Click to editMaster title style 16 Evaluation 16 Multiple Choice. Choose the letter of the best answer. 1. What is another name for normal distribution? A. Gaussian distribution B. Poisson distribution C. Bernoulli’s distribution D. Probability distribution 2. What is the total area in the distribution under the curve? A. 0 B. 1 C. 2 D. 3
  • 17.
    Click to editMaster title style 17 Evaluation 17 Multiple Choice. Choose the letter of the best answer. 3. What marks the change in the curve’s concavity? A. curve B. inflection points C. mean D. standard deviation 4. Which value is found at the center of the normal curve? A. mean B. median C. mode D. all of the above
  • 18.
    Click to editMaster title style 18 Evaluation 18 Multiple Choice. Choose the letter of the best answer. 5. Which of the following is a parameter of normal distribution? A. mean B. standard deviation C. mean and standard deviation D. none of the above 6. Which of the following symbols is used to denote the mean? A.ó B. μ C. α D. ∞
  • 19.
    Click to editMaster title style 19 Evaluation 19 Multiple Choice. Choose the letter of the best answer. 7. Which of the following does not describe a normal curve? A. asymptotic B. bell-shaped C. discrete D. symmetrical about the mean 8. What percent of the area under a normal curve is within 2 standard deviations? A. 68.3% B. 95.4% C. 99.7% D. 100%
  • 20.
    Click to editMaster title style 20 Evaluation 20 Multiple Choice. Choose the letter of the best answer. 9. What percent of the area under a normal curve is within 1 standard deviation? A. 68.3% B. 95.4% C. 99.7% D. 100% 10. What percent of the area under a normal curve is within 3 standard deviations? A. 68.3% C. 99.7% B. 95.4% D. 100%
  • 21.
    Click to editMaster title style 21 Additional Activity 21 Directions: Make a sketch for each of the 3 areas under the normal curve as stated in the empirical rule. Using a mosaic art, shade the area that corresponds to the area under the normal curve. You may use eggshells, old magazines, dried leaves or any materials available at home.