Downloaded 480 times
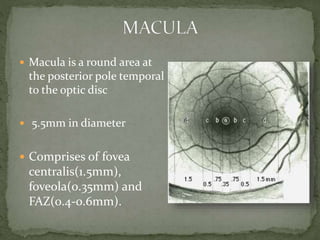
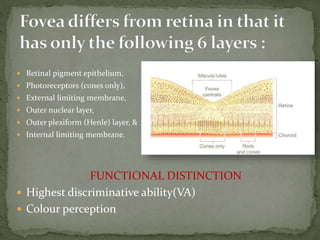
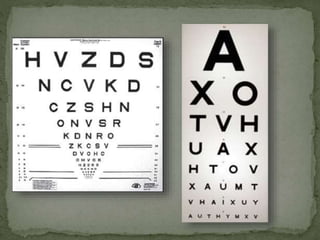


The document discusses the macula and various tests used to evaluate macular function. It notes that the macula is a round area at the back of the eye responsible for highest visual acuity and color perception. It then describes several psychophysical and electrophysiological tests used to assess macular function, including visual acuity tests, Amsler grid, photostress recovery time, color vision tests, flicker sensitivity, dark adaptation, and perimetry. The tests evaluate various aspects of macular structure and function along the visual pathway.


