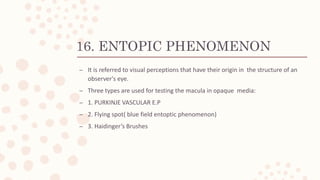
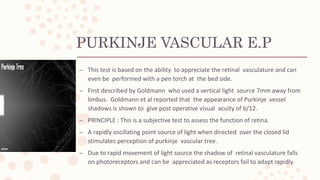
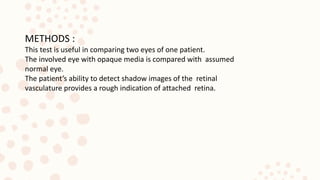
Downloaded 505 times


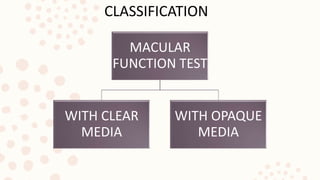

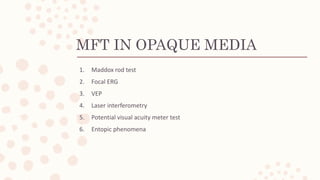
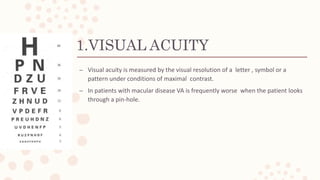
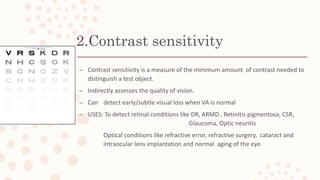

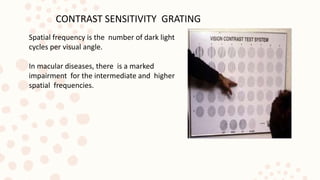
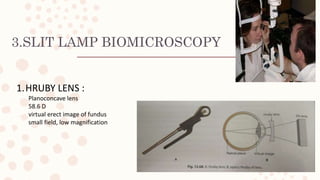
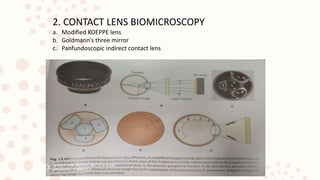


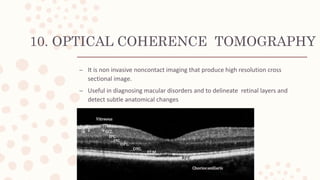
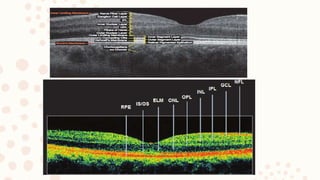
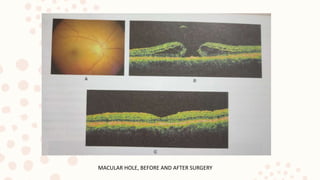
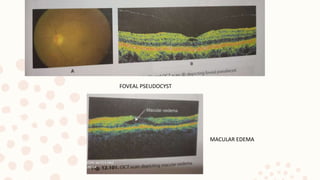


The document provides a comprehensive overview of macular function tests conducted by Dr. Ankita Mahapatra, focusing on the anatomy and functions of the macula, particularly its critical role in central vision and color perception. It describes various tests used to assess macular health, including visual acuity, contrast sensitivity, and specialized procedures for both clear and opaque media. Diagnostic techniques such as fluorescein angiography and optical coherence tomography are also discussed, emphasizing their importance in diagnosing macular disorders.


![CASE_PRESENTATION_ON_subdural_hematoma(SDH)[1 FINAL PPT]-1.pptx](https://cdn.slidesharecdn.com/ss_thumbnails/casepresentationonsubduralhematomasdh1finalppt-1-260129172522-d405d375-thumbnail.jpg?width=640&height=640&fit=bounds)


