Downloaded 888 times


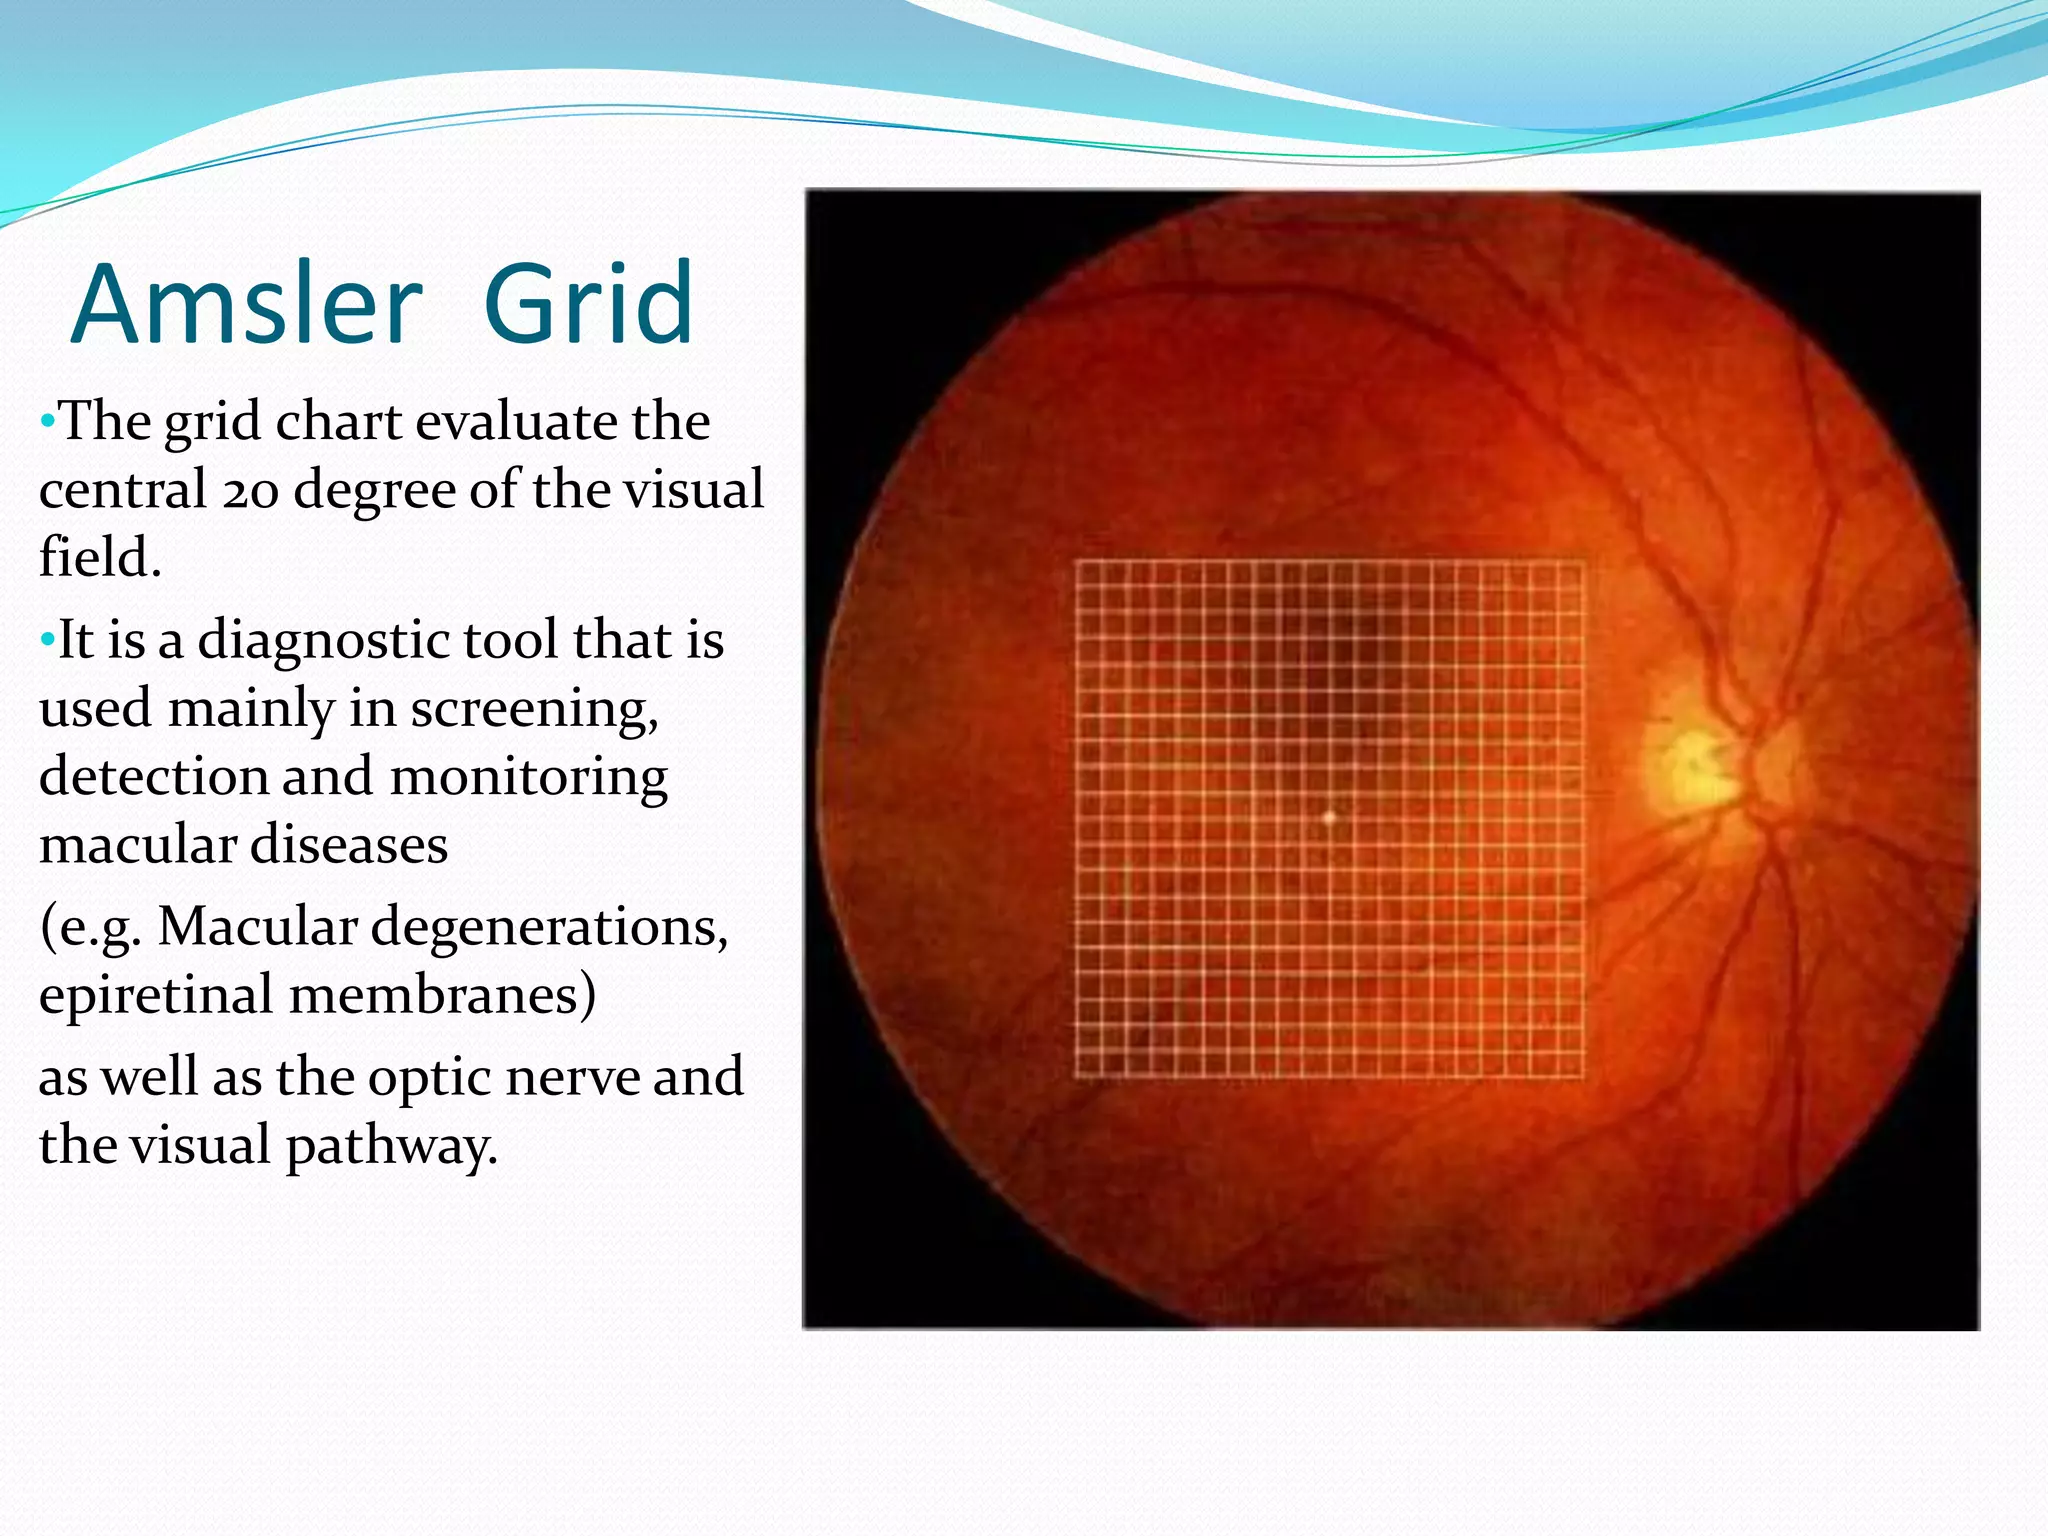


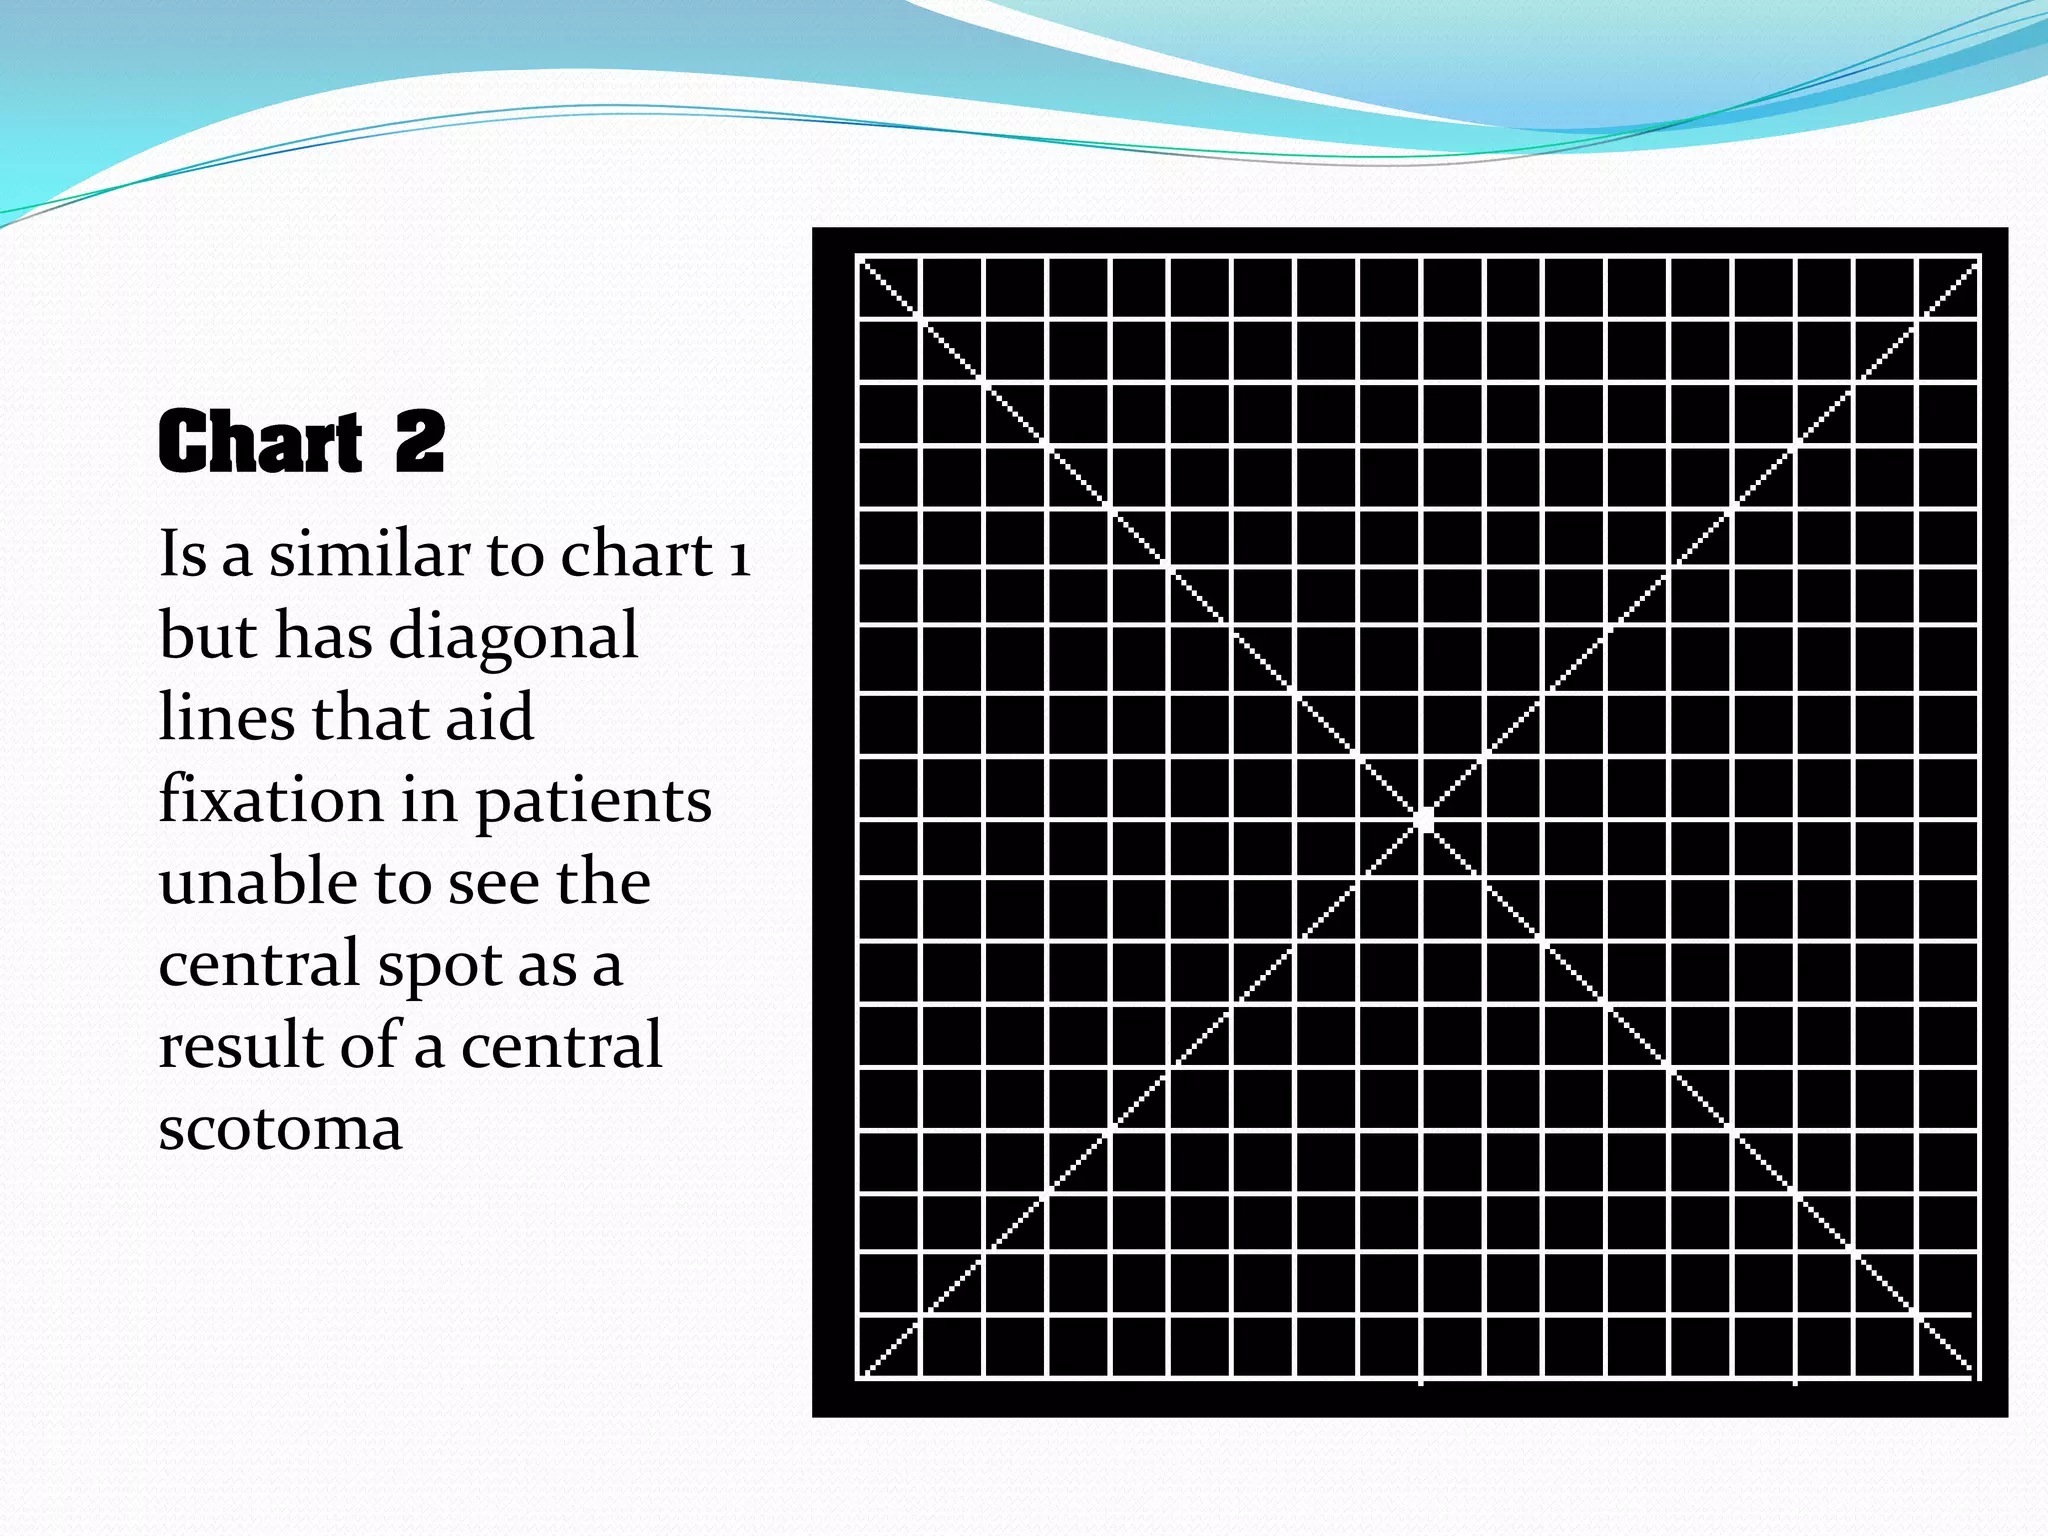


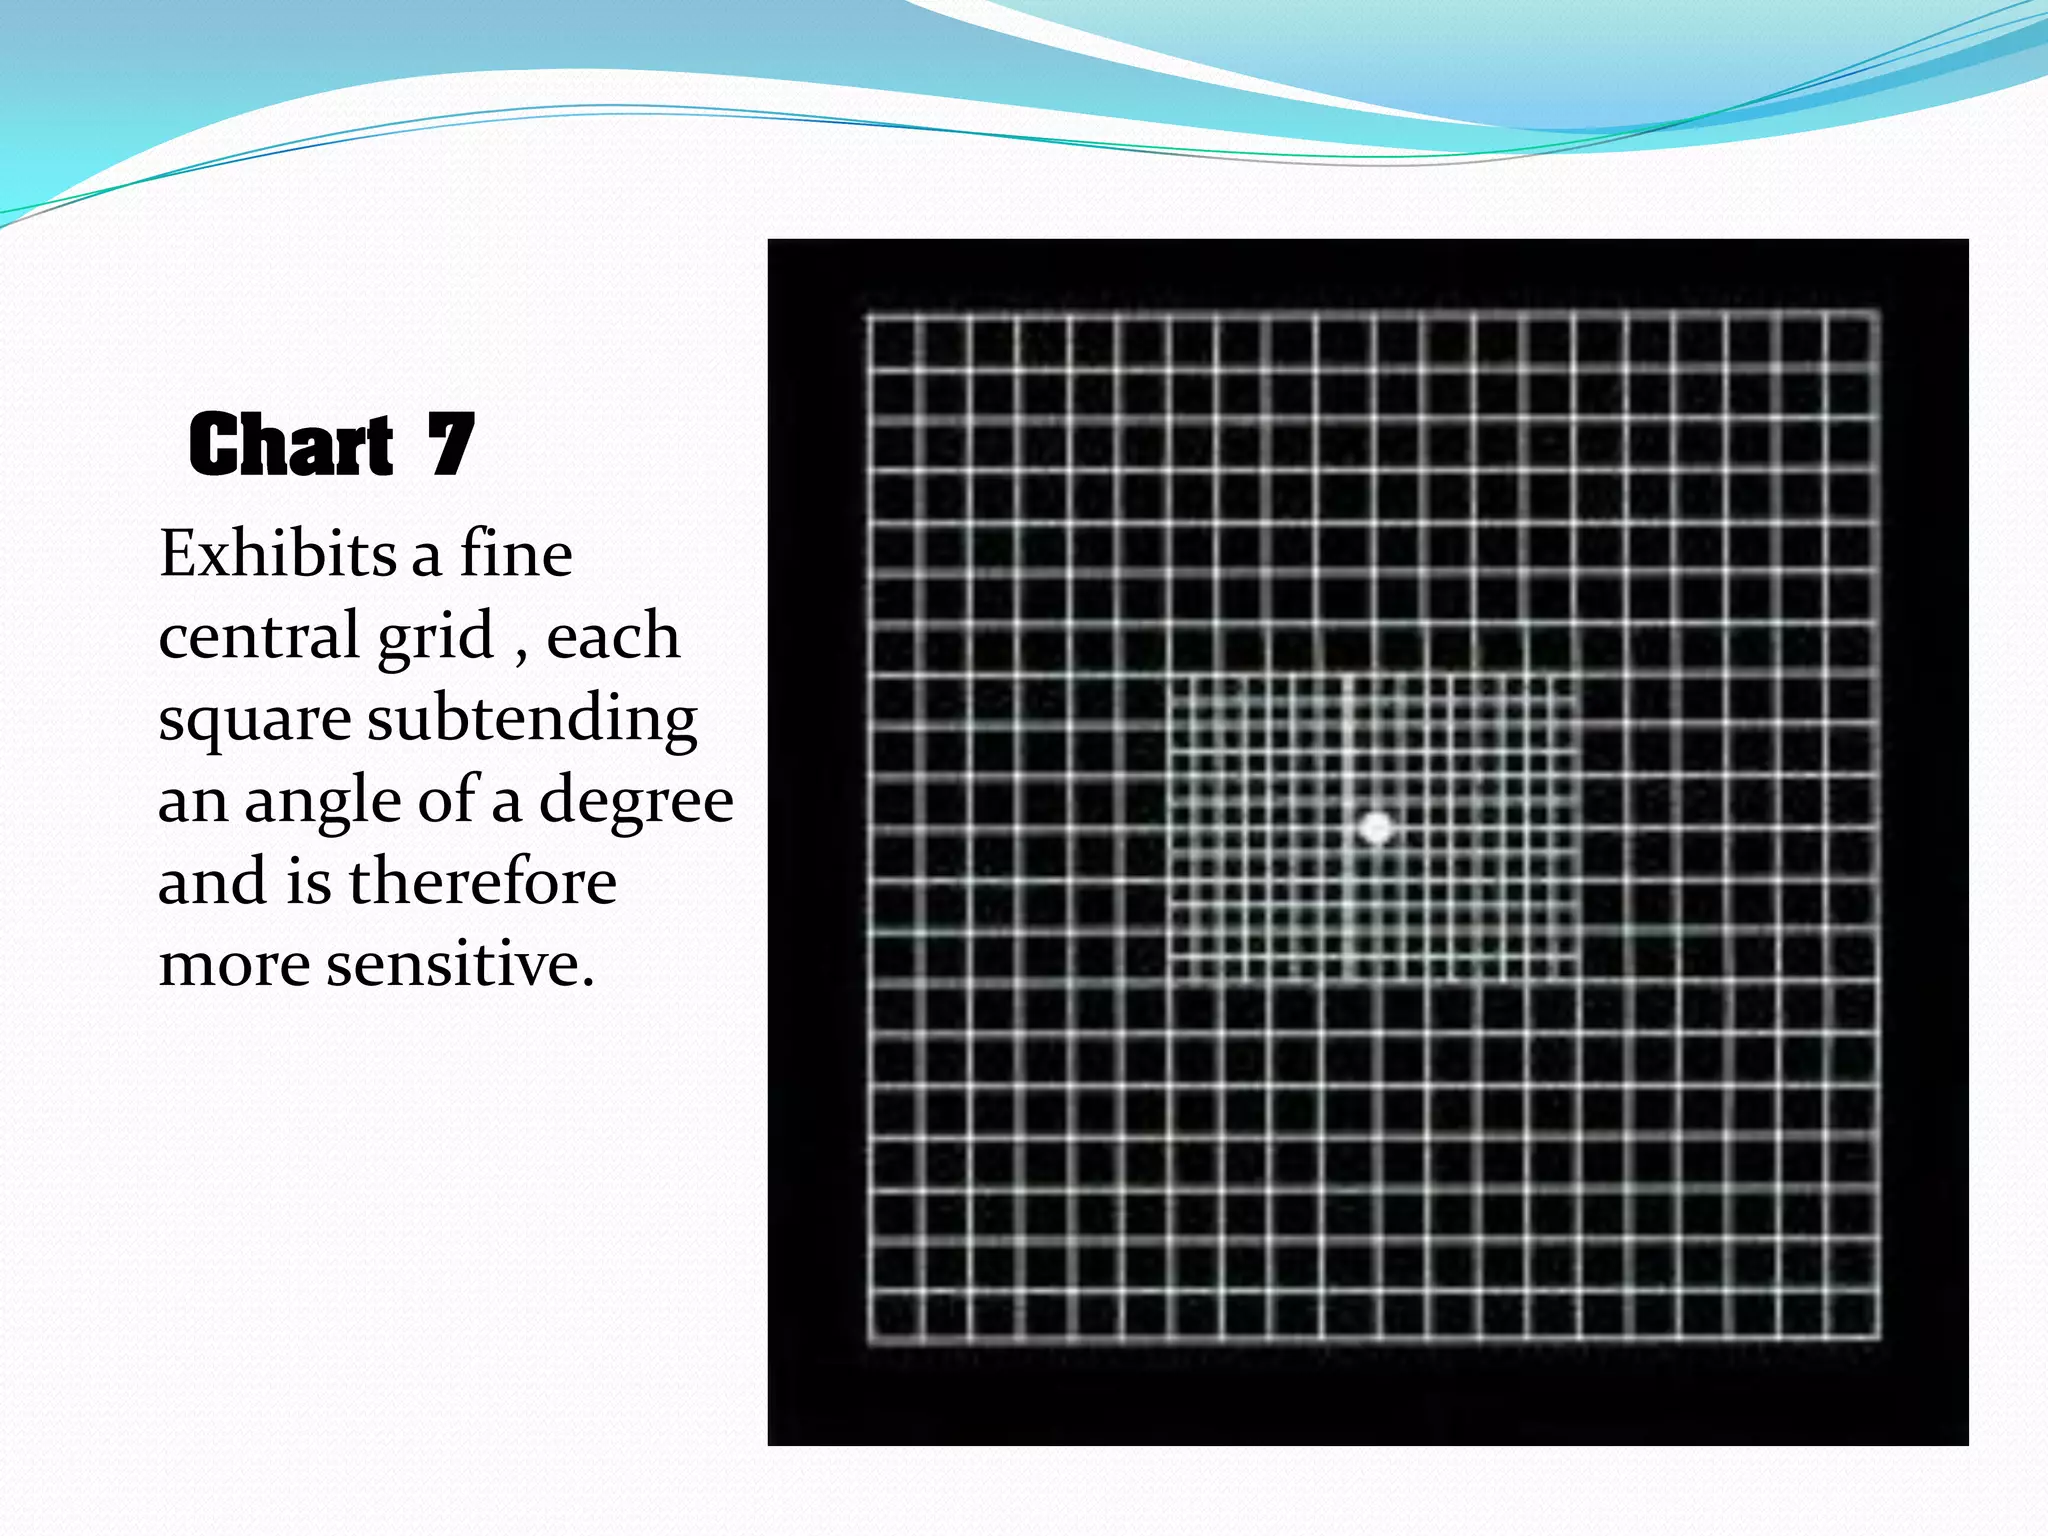


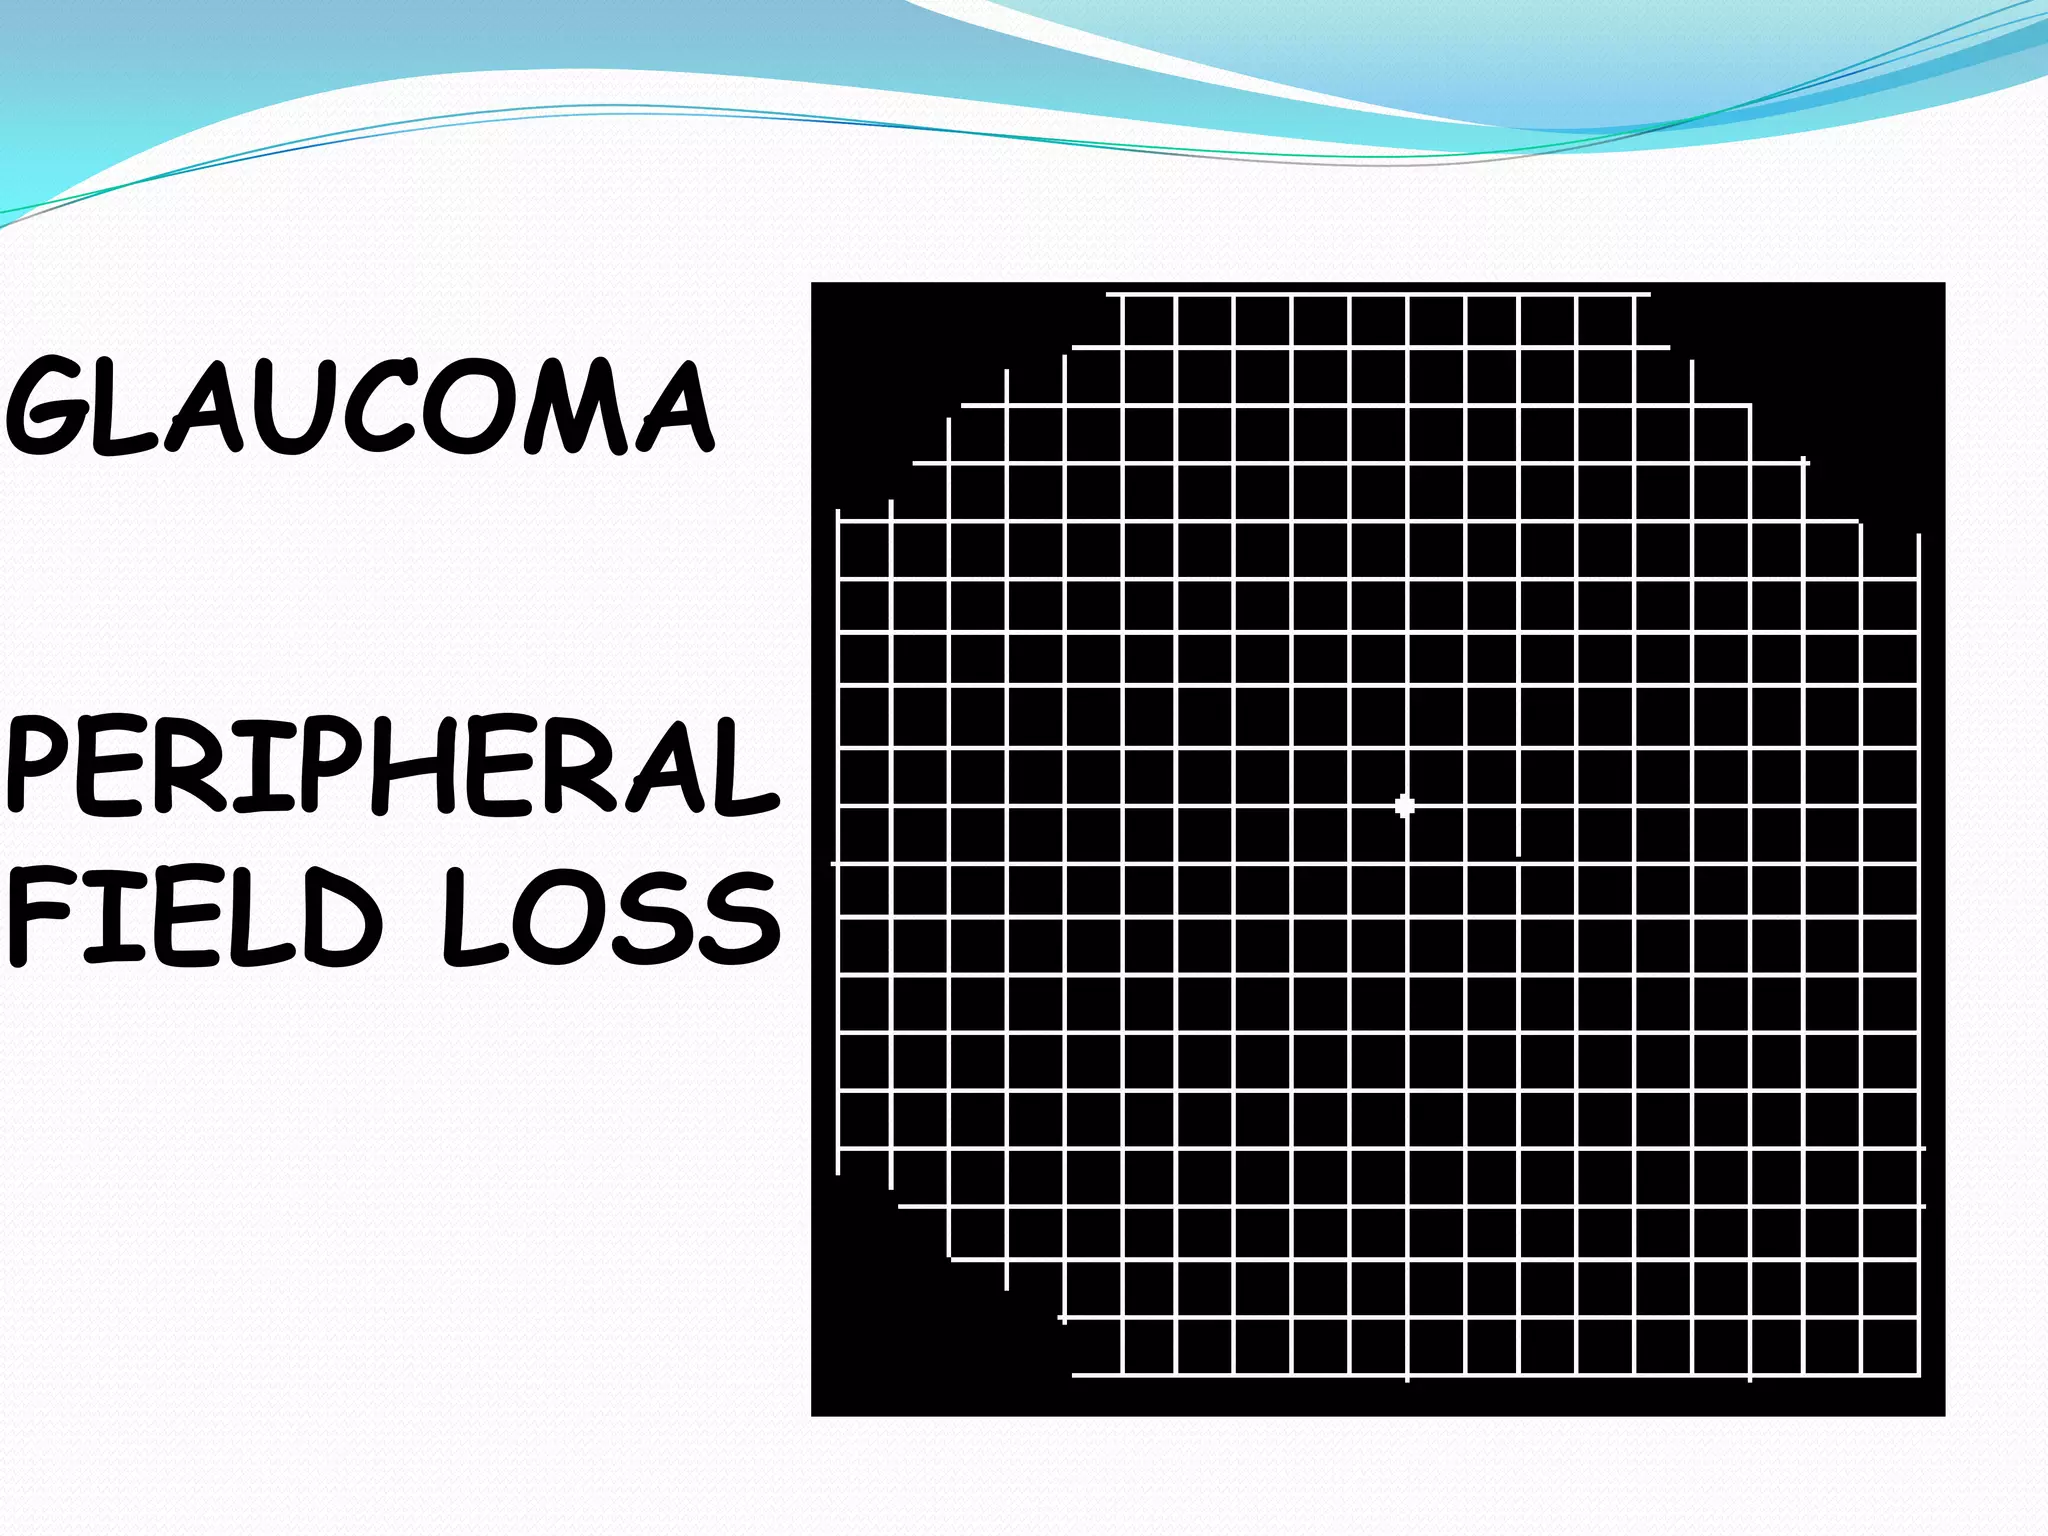


The document summarizes the Amsler grid, a diagnostic tool used since 1945 to screen for and monitor macular diseases. It consists of a grid with a central dot that patients look at to detect any distortions, gaps, or blurred areas in their central vision. Various versions are available, including ones with different colors, patterns of lines, or dot sizes to test specific parts of the visual field and detect different types of visual abnormalities that could indicate conditions like macular degeneration or glaucoma. The procedure involves having patients view the grid with each eye separately at 16 inches and report any anomalies in the lines of the grid.