Downloaded 444 times

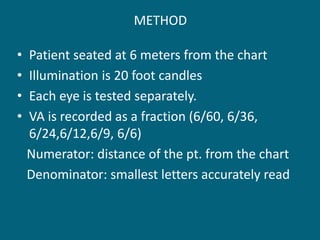

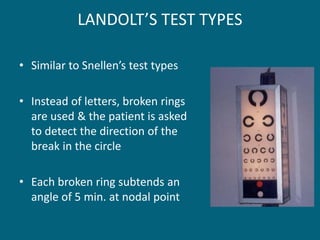

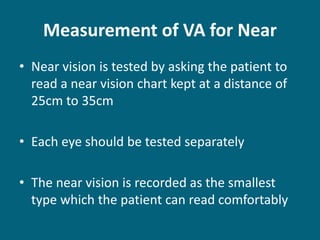

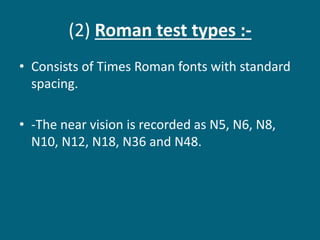
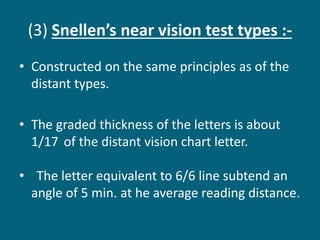
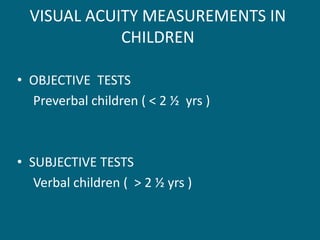
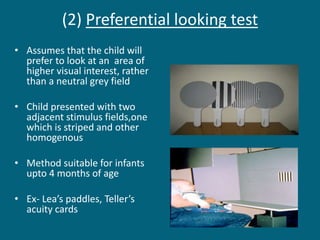
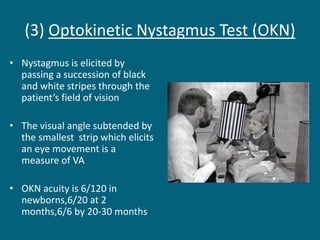
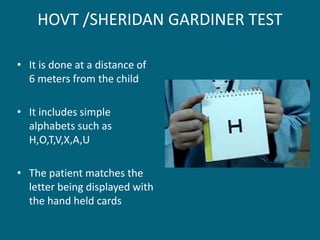
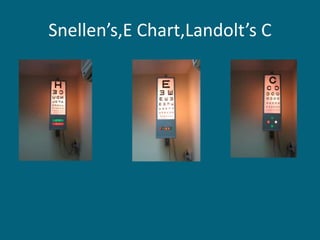
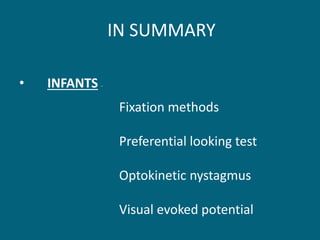
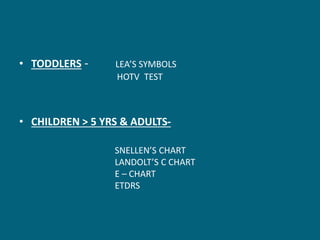


Visual acuity can be measured in 3 sentences or less as follows: Visual acuity measurement techniques include objective tests for preverbal children like preferential looking tests and subjective letter charts for verbal children and adults. Techniques assess the smallest object or pattern that can be detected, resolved, or recognized at given distances through detection of motion in optokinetic nystagmus tests or identification of shapes, letters, or broken circles in visual acuity charts. Proper measurement requires standardized tests, distances, lighting conditions, and recording of results in accepted notation systems.


![CASE_PRESENTATION_ON_subdural_hematoma(SDH)[1 FINAL PPT]-1.pptx](https://cdn.slidesharecdn.com/ss_thumbnails/casepresentationonsubduralhematomasdh1finalppt-1-260129172522-d405d375-thumbnail.jpg?width=640&height=640&fit=bounds)


