The document describes the Amsler grid chart, which was developed in 1920 by Dr. Marc Amsler to test for central vision disorders. It consists of a grid pattern with white lines on a black background that is used to evaluate the macula. Patients are asked a series of questions while viewing the chart to check for blurriness, distortions, or missing areas that could indicate conditions like macular degeneration or retinal detachment. The document outlines the purposes and procedures for several variations of the Amsler grid and provides instructions for patients to perform self-examinations at home in order to monitor eye conditions.
2. INTRODUCTION
• After series of attempts to develop unique
charts for the diagnosis of central vision
disorder & its effects on day to day activities
of the sufferer ,Dr.Marc Amsler, noted Swiss
ophthalmologist developed the first Amsler
grid chart manual in 1920.
3. PURPOSE OF AMSLER GRID CHART
• -Important in testing macular function when
v/a decreased or distorted
-Chart consisting of white lines on black
background & central white dot for fixation
-10 cm square divided in 5mm square
-It is use to evaluate 20 degree of v/f
surrounding fixation.
-This test is use for screening & diagnostic
purpose
4. • Procedure-
Test is done uniocularly
Patients pupil should not be dilated
Patient should were their full refractive correction
Use good illumination on chart
Hold the chart at 30cm from patients eye.
Ask the patient to fixate on central white dot & tell patient
while looking on central dot give the answers of following
questions-
5. 1.Can you see the central white dot in the center of
grid?
2.While looking at central dot ,can you see all four
quadrants of chart simultaneously?
3.Does the grid appears to have any missing or
distorted area?
4.Are there any area of grid that have an unusual
appearance?
5.Are any square blurring/missing?
6. CHART 1
• The most familiar and widely used of the charts is
the first in the manual, the Standard Amsler grid.
• This is merely a grid pattern consisting of 0.5cm
white squares, each corresponding to 1 degree of
visual field, set against a black background.
• This is arranged in 20 horizontal & vertical rows
making 20 squares each.
8. • This grid pattern is the most versatile of the
charts
• This enables the clinician to identify various
forms of distortion as well as Relative and
Absolute scotoma.
• Relative scotoma: The area in the visual field
which is seen as blur or not seen clearly
• Absolute scotoma: The area in the visual field
which is not at all seen or unrecognizable, usually
reported by the patient as a black area
9. CHART 2
• The patient with a central scotoma may
respond better if this chart is used.
• The only difference between this and Standard
grid chart is that diagonal lines intersect at the
center of the grid to form an ‘X’.
• This gives the patient a better idea of where the
fixation point is located.
• A larger white central spot may be applied with
tape to the center of the grid if the patient is still
unable to achieve or maintain central fixation.
11. CHART 3
• This chart has an identical configuration with that
of the Standard Amsler chart, except for having
red squares instead of white ones in the black
background.
• The patient suspected of having a central or
cecocentral scotoma associated with nutritional
amblyopia, as from alcohol-related thiamine
deficiency, or toxic maculopathy, as from
quinine and its derivatives, should be tested with
this chart.
13. 13
OTHER USES
• This chart can also be used to differentiate patient
with functional vision loss , as from malingering
with the conjunction of red-green lenses, the red
grid may allow detection of artificial monocular
field/vision loss.
• Under normal circumstances, the grid will disappear
when viewed through the green lens; conversely, it
will remain visible when viewed through the red
lens.
14. 14
CHART NO 4:
• This chart has no lines to distort; instead it
consists of small white dots randomly
distributed over a black background like stars in
the sky.
• Amsler hoped that the patient with one or more
paracentral scotomas may be able to delineate
the area[s] of involvement more easily with this
chart.
• But its credibility is doubtful since the
background and scotoma use to appear same in
color for the observer may result in false results
16. 16
CHART NO 5:
• This chart consists of 20 evenly spaced white
horizontal lines on a black background.
• This design makes it possible to rotate the chart to
any meridian to check for irregularities in a
particular/specific area.
• The patient with central or paracentral
metamorphopsia resulting from various retinal and
choroidal disorders may be especially sensitive to
this chart
18. 18
CHART NO 6:
• This chart varies slightly from chart no 5
• It contains black lines against a white
background and the areas 1 degree above and
below the fixation dot are bisected by
additional horizontal lines.
• Metamorphopsia along the reading level may
be more easily observed with this chart.
20. 20
CHART NO 7:
• This chart breaks the horizontally oriented 6 degree
X 8 degree central area, which corresponds
anatomically to the normal macula, into 0.5 degree
squares, rather than 1 degree squares.
• This making it a more sensitive detector to insidious
macular compromise
• This chart is more useful in cases where there is a
subtle visual disturbance from macular disease,
especially early in the course of the disease
22. 22
CLINICAL IMPLICATIONS
• Disturbances that appear on the Amsler grid should
alert the clinician to the possibility of either acute
or longstanding disease of the retina, choroid, optic
nerve, anterior visual system, visual pathways and
cortex.
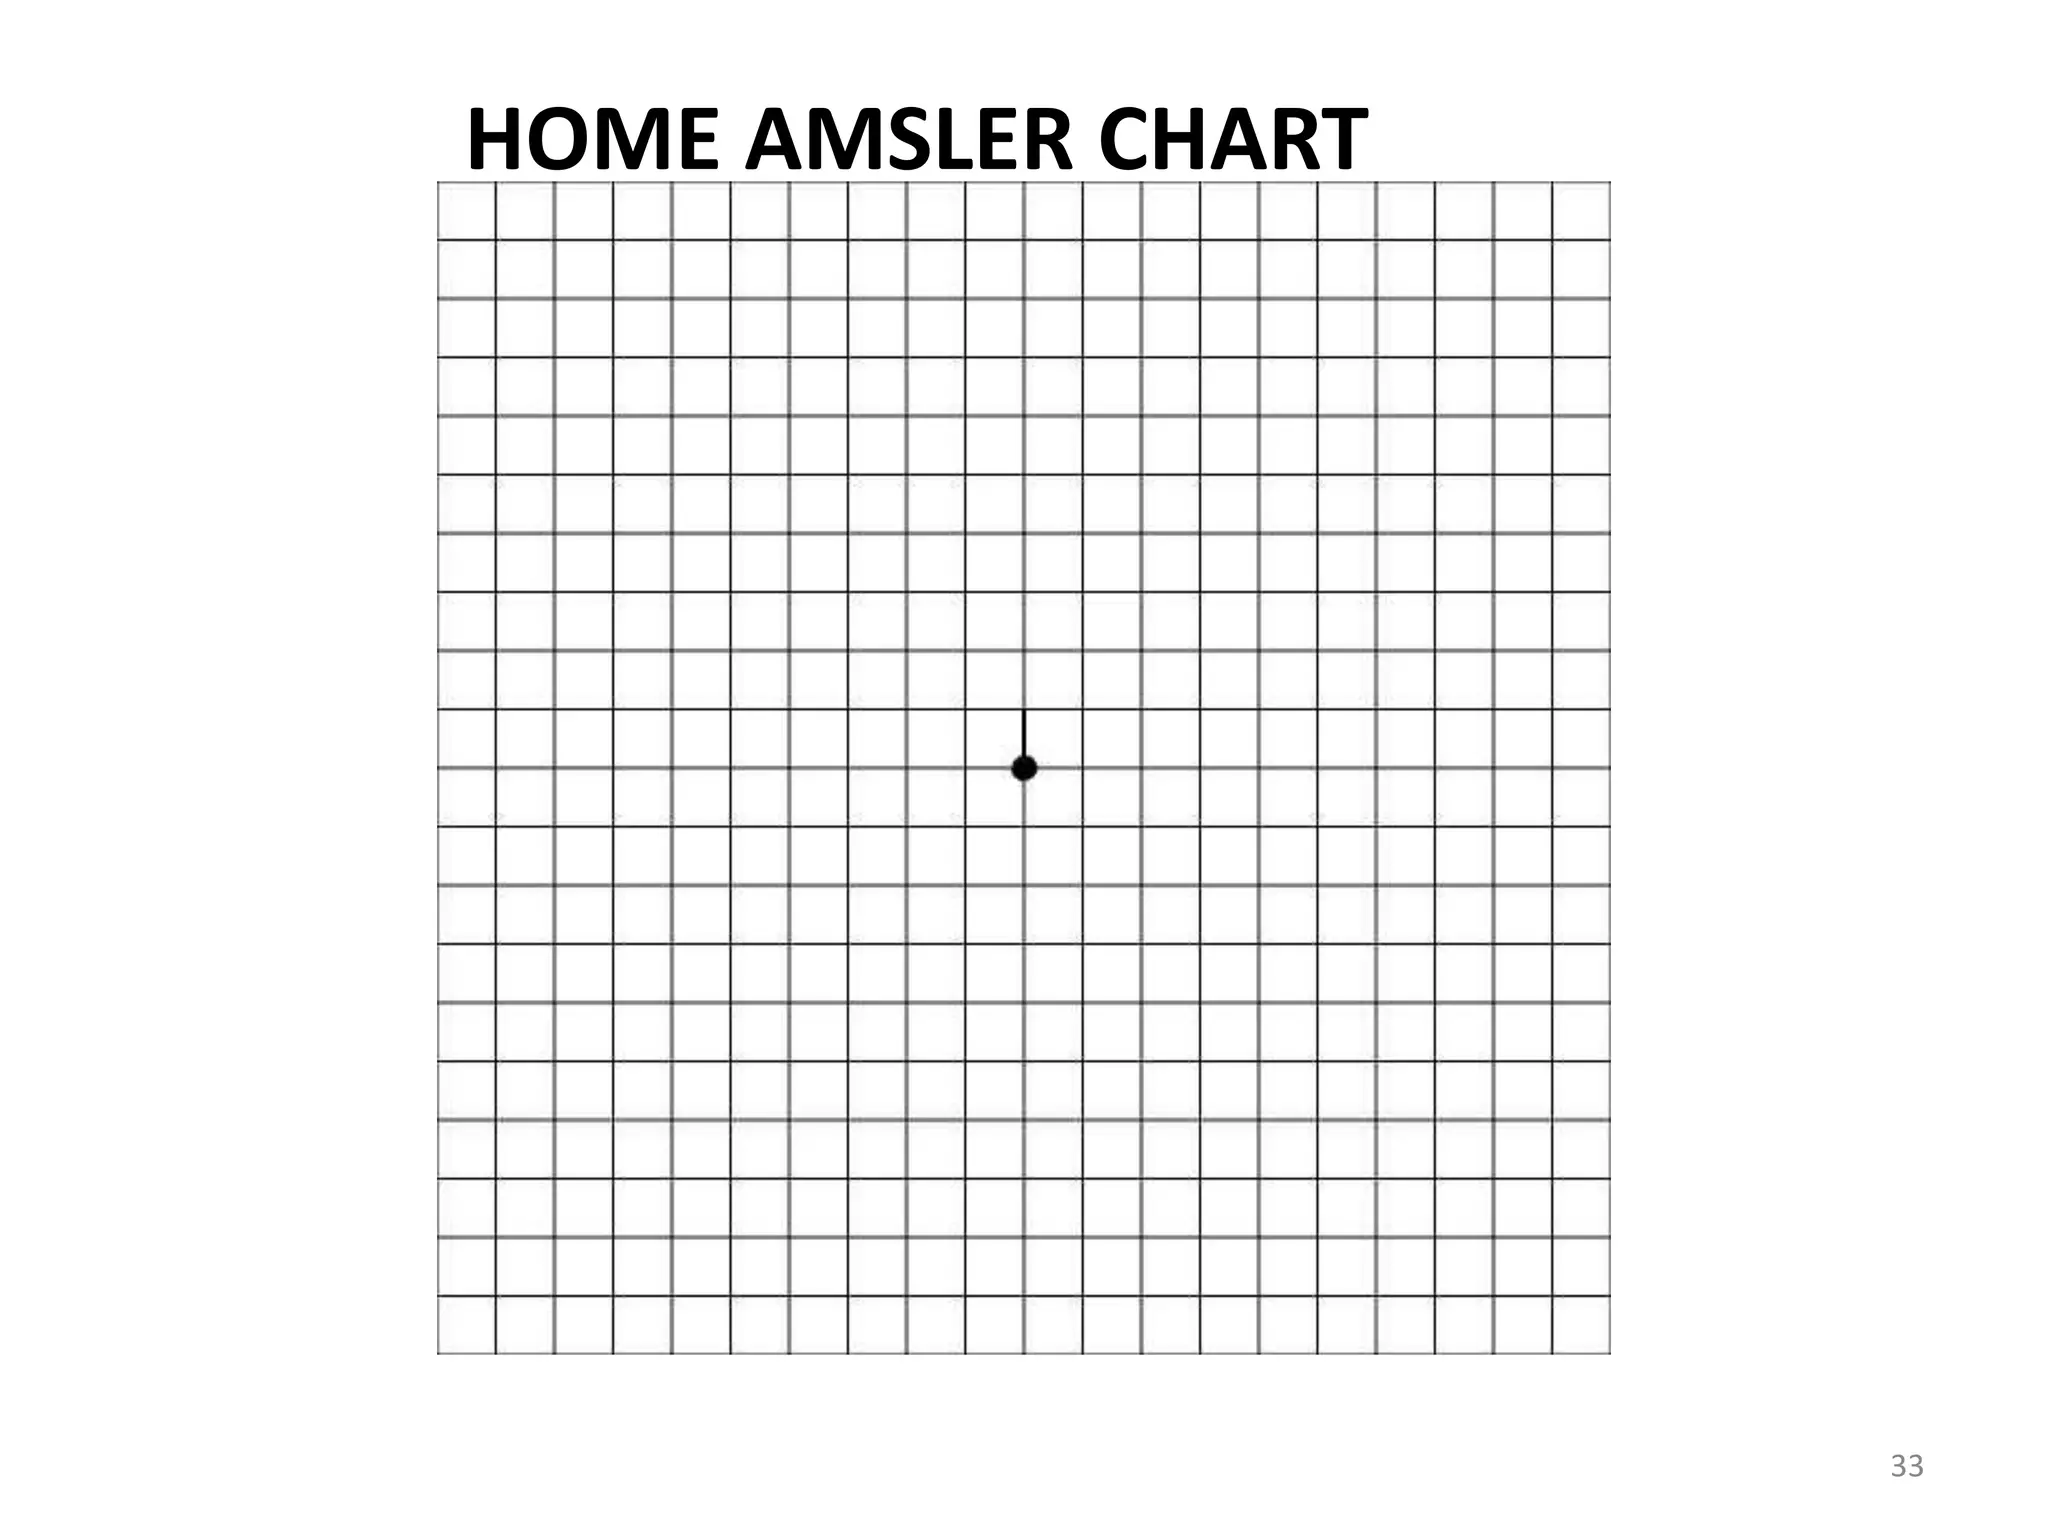
• The clinician should consider dispensing an Home
Amsler grid chart [Black lines in white background]
with complete instructions for self-assessment to
three categories of patients.
23. INTERPITATION
(1) Can you see the central white dot?
• The purpose of this question is to rule out a
central scotoma.
• If the answer is ‘Yes’, a central scotoma is unlikely
unless the clinician is obtaining a false-positive
response due to poor patient compliance.
• If the answer is ‘ It looks washed out’ or ‘It seems
slightly blurry’, one should suspect for a relative
central scotoma.
25. 25
• If the patient says he/she is unable to see
the central white dot at all, an absolute
central scotoma may be present.
• This type of defect may arise from several
retinal, choroidal , and optic nerve
disorders, as well as lesions of the anterior
visual system.
27. 2) Can you see all the four sides of the large square as well
as all four of its corners?
• The purpose of this question is to rule out
arcuate, altitudinal, quandrantic,or hemianopic field
defects, as well as overall field constrictions.
• If the answer is ‘Yes’, the clinician may then proceed to
Question no 3.
• If the answer is ‘No’ then the patients should be asked to
document the missing sides/corners as accurately as
possible in the tear-off chart with the help of pencil.
28. 28
3) Are any of the small squares blurry or missing on
any part of the grid?
• The purpose of this question is to rule out relative
or absolute paracentral, cecocentral, or altitudinal
scotomas.
• If the answer is ‘No’ then the clinician may
proceed to Question no 4.
• If the answer is ‘Yes’, the clinician must initially
rule out the false-positive responses that may
occur if the patient is not properly corrected for
the test distance or if media opacities create a
blurriness or a doubling of the horizontal or
vertical lines (monocular diplopia).
29. 29
4) Do any of the horizontal or vertical lines that make
up the squares appear wavy or bent?
• The purpose of this question is to rule out
metamorphopsia and other forms distortions.
• If the answer is ‘No’, then clinician may proceed to
Question no 5.
• If the answer is ‘Yes ’, the clinician must initially
rule out false-positive responses that may occur if
the patient is looking through the line of a
multifocal segment he/she is wearing or noticing
the peripheral distortions of a progressive
addition lens.
31. Gaurav Bhardwaj
• The purpose of this question is to rule out
scintillating scotomas.
• If the answer is ‘No’ the series of questions are
complete and one can expect patient to have
normal central visual field.
Is any part of the grid shimmering, flickering, or
colored?
32. • If the answer is ‘Yes’, this may herald the onset
of a scotoma of retinal origin, particularly if
early serous or hemorrhagic detachment is
disrupting retinal topography.
34. 34
• The first category is the patient with progressive
disease, such as toxic maculopathy or atypical
retinitis pigmentosa [field defect starts from center
to periphery] , who is predisposed to developing
significant alterations in the functional vision over
time.
• The second category is the patient with active
disease, such as optic neuritis or macular
neuroretinopathy, whose visual acuity may improve
or worsen within a relatively short time span.
35. 35
The third category is the patient with
recurrent disease, such as central serous
retinopathy or toxoplasmic retinochoroiditis,
who may have already suffered vision loss,
but is at risk of experiencing a reactivation of
the disease process.
36. 36
INSTRUCTIONS FOR HOME AMSLER GRID SELF-
ASSESSMENT
1) Patient should hold Home Amsler chart at
his/her reading or working distance while
wearing proper reading glasses for that
particular distance.
2) Patient should cover/occlude one of his/her
eye, chart should be viewed only with one eye
open.
37. (4) Patient should be always looking directly at
the central white dot at all times.
(5)If patient notice any [new] missing or
distorted areas, he/she should mark them
with a pencil.
(6) Patient should report the clinician along with
Home Amsler chart used as soon as possible
for any new symptoms found with the chart.