Downloaded 547 times

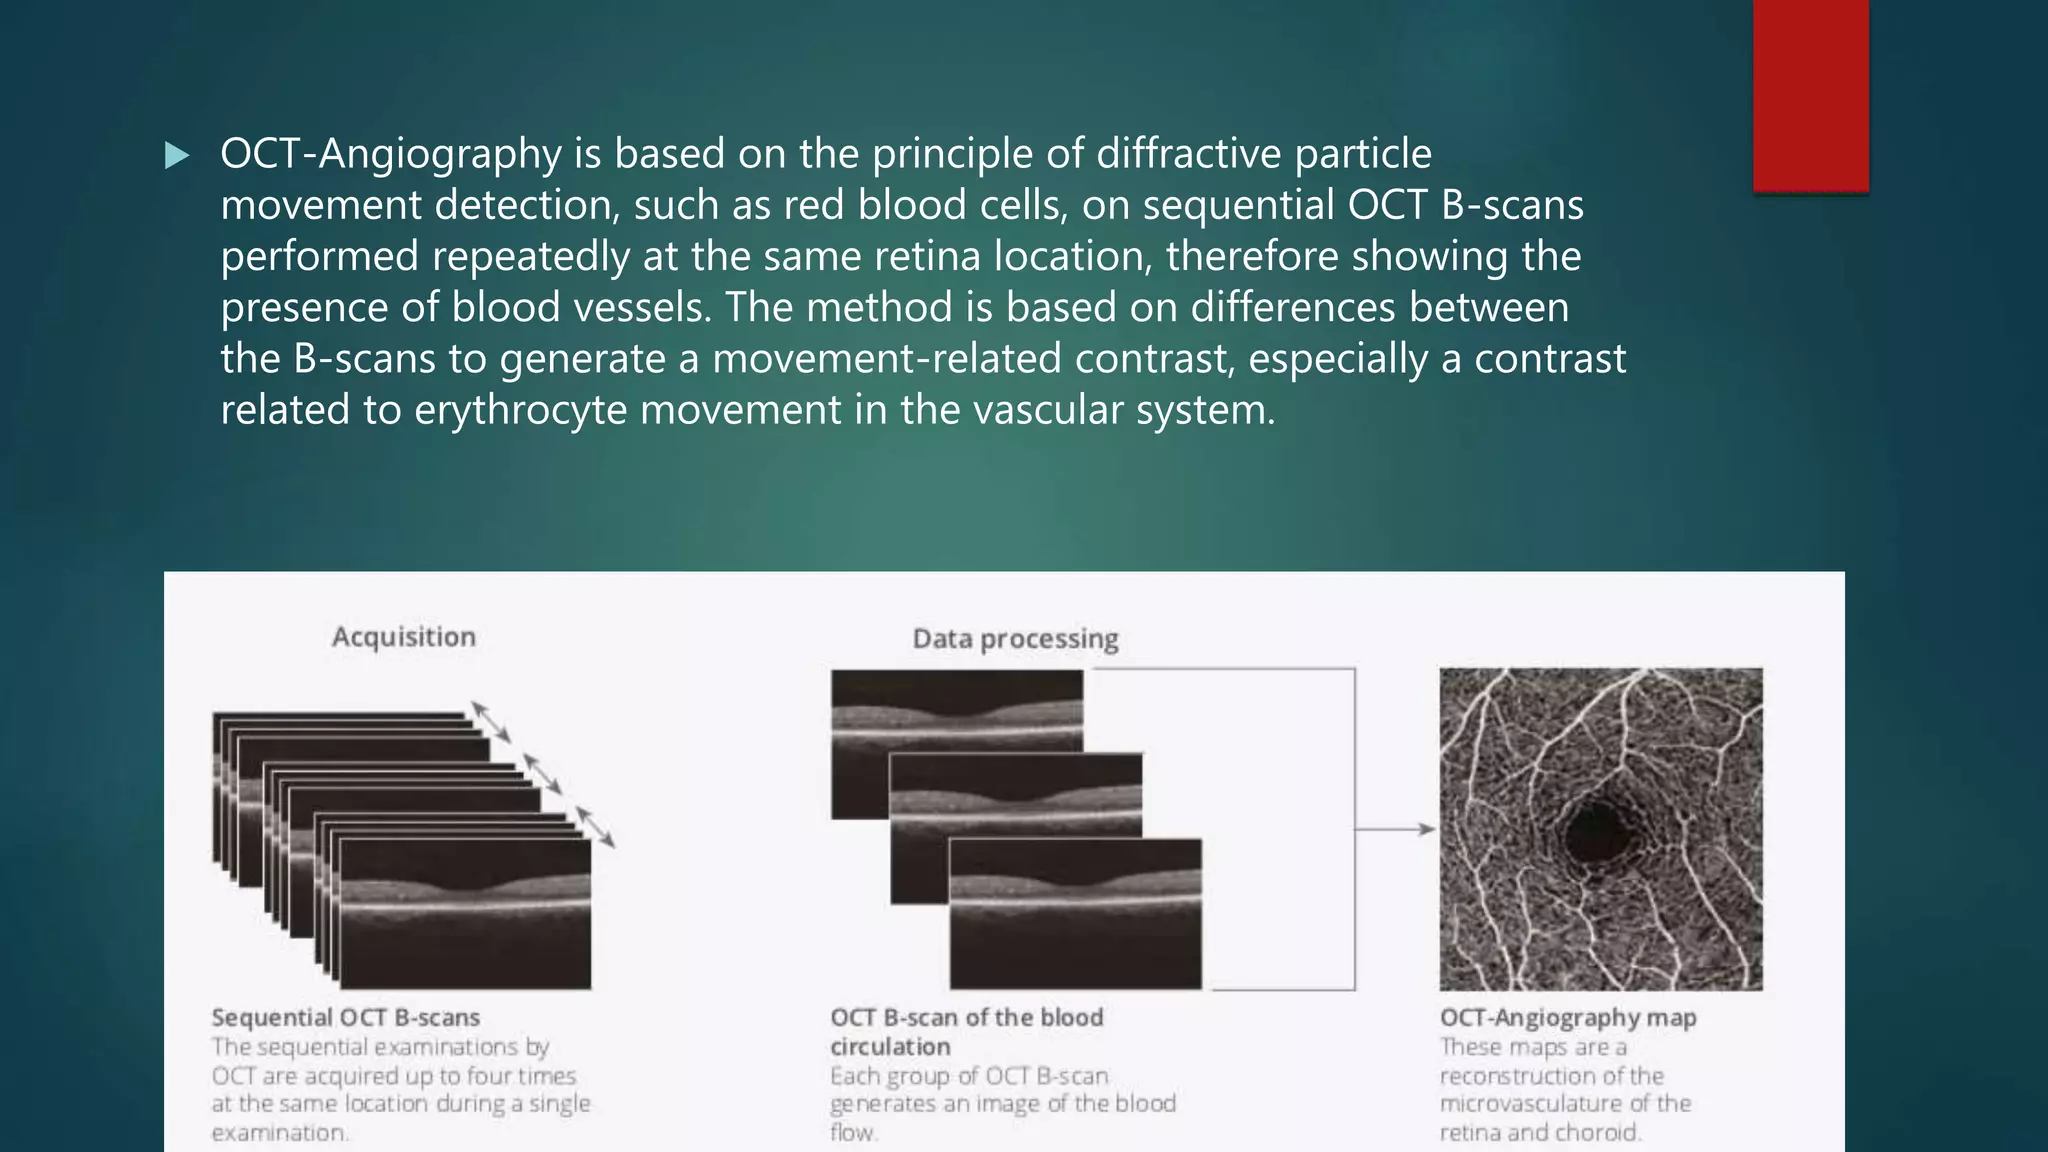


OCT-Angiography is a non-invasive imaging method that uses light to visualize the retinal and choroidal vasculature in 3D without dye injection. It works by detecting the movement of red blood cells on sequential OCT scans to identify blood vessels. The document describes the technical aspects and clinical applications of several commercial OCT-Angiography systems.


