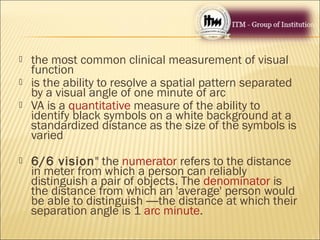
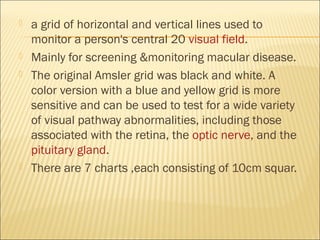
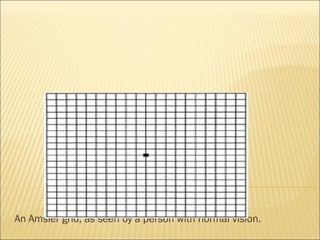
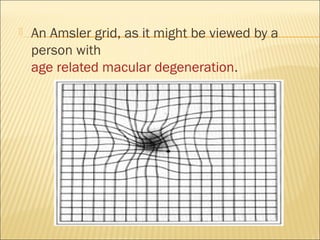
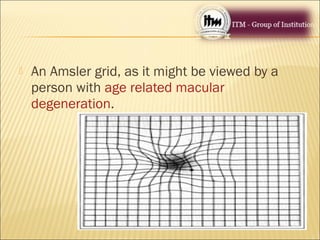
1
Name-Mehnaaz Mariam
2nd
year B-OPTOM
1- visual acuity
2-contrast sesitivity
3-amsler grid
4-light brightness comparison test
5-photostress test
6- Dark adaptation
7-color vision test
 Electroretinography
 Electrooculography
 Visual evoked potential
 the most common clinical measurement of visual
function
 is the ability to resolve a spatial pattern separated
by a visual angle of one minute of arc
 VA is a quantitative measure of the ability to
identify black symbols on a white background at a
standardized distance as the size of the symbols is
varied
 6/6 vision" the numerator refers to the distance
in meter from which a person can reliably
distinguish a pair of objects. The denominator is
the distance from which an 'average' person would
be able to distinguish —the distance at which their
separation angle is 1 arc minute.
7
Name-Mehnaaz Mariam
2nd
year B-OPTOM
1- visual acuity
2-contrast sesitivity
3-amsler grid
4-light brightness comparison test
5-photostress test
6- Dark adaptation
7-color vision test
 Electroretinography
 Electrooculography
 Visual evoked potential
 the most common clinical measurement of visual
function
 is the ability to resolve a spatial pattern separated
by a visual angle of one minute of arc
 VA is a quantitative measure of the ability to
identify black symbols on a white background at a
standardized distance as the size of the symbols is
varied
 6/6 vision" the numerator refers to the distance
in meter from which a person can reliably
distinguish a pair of objects. The denominator is
the distance from which an 'average' person would
be able to distinguish —the distance at which their
separation angle is 1 arc minute.
 Visual acuity is often measured according to
the size of letters viewed on a Snellen chart
or the size of other symbols, such as
Landolt Cs or Tumbling E.
CONTRASTCONTRAST SENSITIVITYSENSITIVITY
..
 Contrast is the difference in visual
properties that makes an object
distinguishable from other objects and the
background .
 determined by the difference in the color
and brightness of the object and other
objects within the same field of view.
 Can detect very eary visual dysfunction, even
when snellen VA is normal
 Example: Pelli-Robson chart
 a grid of horizontal and vertical lines used to
monitor a person's central 20 visual field.
 Mainly for screening &monitoring macular disease.
 The original Amsler grid was black and white. A
color version with a blue and yellow grid is more
sensitive and can be used to test for a wide variety
of visual pathway abnormalities, including those
associated with the retina, the optic nerve, and the
pituitary gland.
 There are 7 charts ,each consisting of 10cm squar.
An Amsler grid, as seen by a person with normal vision.
 An Amsler grid, as it might be viewed by a
person with
age related macular degeneration.
 Macular disease = wavy lines
 Optic nerve disease = missing or faint lines
but not distorted
 the ability of the visual system to adjust to
various levels of darkness and light.
 Tested by dark adaptometry.
 Maily useful in patients with nyctalopia.
 Gross test of dark adaptation.
 Used to differentiate visual loss caused by
macular from that caused by an optic nerve
lesion.
 Normal recovery time = 15-30 seconds
 Delay in visual recovery indicates macular
pathology (e.g CME ,CSR)
 To test optic nerve function by comparing light
brightness in one eye with the fellow.
 In optic neuropathy , light is less bright in the
affected eye.
 ability to perceive differences between colors .
 color blindness, a color vision deficiency, is
the inability to perceive differences between
some of the colors that others can distinguish.
 Tests:
 Ishihara: most often used to diagnose red-
green color deficiencies.
 Hardy-rand-rittler: more sensitive than
ishihara , it detect all 3 congenital defects.
 Farnsworth-Munsell 100-hue : most
sensitive.
Example of an Ishihara color test plate
•measures the electrical responses of various cell
types in the retina.
• Electrodes are usually placed on the cornea and the
skin near the eye with a reference electrode on
forehead.
•Potential between 2 electrodes is amplified &
displayed.
•Normal ERG is biphasic ,an a-wave (initial negative
deflection) followed by a b-wave (positive deflection).
•The leading edge of the a-wave is produced by the
photoreceptors, while the remainder of the wave is
produced by a mixture of cells including
photoreceptors, bipolar, amacrine, and Muller cells.
•If a flash ERG is performed on a dark-adapted eye, the
response is primarily from the rod system and if a flash
ERGs performed on a light adapted eye will reflect the
activity of the cone system .
•The multifocal ERG is used to record separate
responses for different retinal locations.
•Clinically used mainly by ophthalmologists and
optometrists, the electroretinogram (ERG) is used for
the diagnosis of various retinal disease ,examples:
Retinitis pigmentosa
Leber's congenital amaurosis
Cone dystrophy
Diabetic retinopathy
Retinal vain acclusion..etc
 The main applications are in ophthalmological
diagnosis and in recording eye movements.
 a technique for measuring the resting potential of
the retina.
 Unlike the electroretinogram, the EOG does not
represent the response to individual visual stimuli.
 The EOG is used to assess the function of the
pigment epithelium.
During dark adaptation, the resting potential
decreases slightly and reaches a minimum
("dark trough") after several minutes. When the
light is switched on, a substantial increase of
the resting potential occurs ("light peak"), which
drops off after a few minutes when the retina
adapts to the light. The ratio of the (light peak
divided by dark trough) is known as the Arden
ratio.
•VEP is a recording of electrical activity of
the visual cortex after retinal stimulation.
Main indications:
Monitoring visual function in babies.
Optic neuropathy
Monitor macular pathway function
 Visual acuity is often measured according to
the size of letters viewed on a Snellen chart
or the size of other symbols, such as
Landolt Cs or Tumbling E.
CONTRASTCONTRAST SENSITIVITYSENSITIVITY
..
 Contrast is the difference in visual properties that
makes an object distinguishable from other objects
and the background .
 determined by the difference in the color and
brightness of the object and other objects within
the same field of view.
 Can detect very eary visual dysfunction, even when
snellen VA is normal
 Example: Pelli-Robson chart
 a grid of horizontal and vertical lines used to
monitor a person's central 20 visual field.
 Mainly for screening &monitoring macular disease.
 The original Amsler grid was black and white. A
color version with a blue and yellow grid is more
sensitive and can be used to test for a wide variety
of visual pathway abnormalities, including those
associated with the retina, the optic nerve, and the
pituitary gland.
 There are 7 charts ,each consisting of 10cm squar.
An Amsler grid, as seen by a person with normal vision.
 An Amsler grid, as it might be viewed by a
person with age related macular
degeneration.
 Macular disease = wavy lines
 Optic nerve disease = missing or faint lines
but not distorted
 the ability of the visual system to adjust to
various levels of darkness and light.
 Tested by dark adaptometry.
 Maily useful in patients with nyctalopia.
 Gross test of dark adaptation.
 Used to differentiate visual loss caused by
macular from that caused by an optic nerve
lesion.
 Normal recovery time = 15-30 seconds
 Delay in visual recovery indicates macular
pathology (e.g CME ,CSR)
 To test optic nerve function by comparing light
brightness in one eye with the fellow.
 In optic neuropathy , light is less bright in the
affected eye.
 ability to perceive differences between colors .
 color blindness, a color vision deficiency, is
the inability to perceive differences between
some of the colors that others can distinguish.
 Tests:
 Ishihara: most often used to diagnose red-
green color deficiencies.
 Hardy-rand-rittler: more sensitive than
ishihara , it detect all 3 congenital defects.
 Farnsworth-Munsell 100-hue : most
sensitive.
Example of an Ishihara color test plate
•measures the electrical responses of various cell
types in the retina.
• Electrodes are usually placed on the cornea and the
skin near the eye with a reference electrode on
forehead.
•Potential between 2 electrodes is amplified &
displayed.
•Normal ERG is biphasic ,an a-wave (initial negative
deflection) followed by a b-wave (positive deflection).
•The leading edge of the a-wave is produced by the
photoreceptors, while the remainder of the wave is
produced by a mixture of cells including
photoreceptors, bipolar, amacrine, and Muller cells.
•If a flash ERG is performed on a dark-adapted eye, the
response is primarily from the rod system and if a flash
ERGs performed on a light adapted eye will reflect the
activity of the cone system .
•The multifocal ERG is used to record separate
responses for different retinal locations.
•Clinically used mainly by ophthalmologists and
optometrists, the electroretinogram (ERG) is used for
the diagnosis of various retinal disease ,examples:
Retinitis pigmentosa
Leber's congenital amaurosis
Cone dystrophy
Diabetic retinopathy
Retinal vain acclusion..etc
 a technique for measuring the resting
potential of the retina.
 The main applications are in
ophthalmological diagnosis and in recording
eye movements.
 Unlike the electroretinogram, the EOG does
not represent the response to individual
visual stimuli.
 The EOG is used to assess the function of
the pigment epithelium.
•During dark adaptation, the resting potential
decreases slightly and reaches a minimum
("dark trough") after several minutes. When the
light is switched on, a substantial increase of
the resting potential occurs ("light peak"), which
drops off after a few minutes when th retina
adapts to the light. The ratio of the (light peak
divided by dark trough) is known as the Arden
ratio.
•VEP is a recording of electrical activity of the visual cortex after
retinal stimulation.
Main indications:
Monitoring visual function in babies.
Optic neuropathy
Monitor macular pathway function

MACULAR FUNCTION TEST

  • 1.
  • 3.
    1- visual acuity 2-contrastsesitivity 3-amsler grid 4-light brightness comparison test 5-photostress test 6- Dark adaptation 7-color vision test
  • 4.
  • 6.
     the mostcommon clinical measurement of visual function  is the ability to resolve a spatial pattern separated by a visual angle of one minute of arc  VA is a quantitative measure of the ability to identify black symbols on a white background at a standardized distance as the size of the symbols is varied  6/6 vision" the numerator refers to the distance in meter from which a person can reliably distinguish a pair of objects. The denominator is the distance from which an 'average' person would be able to distinguish —the distance at which their separation angle is 1 arc minute.
  • 7.
  • 9.
    1- visual acuity 2-contrastsesitivity 3-amsler grid 4-light brightness comparison test 5-photostress test 6- Dark adaptation 7-color vision test
  • 10.
  • 12.
     the mostcommon clinical measurement of visual function  is the ability to resolve a spatial pattern separated by a visual angle of one minute of arc  VA is a quantitative measure of the ability to identify black symbols on a white background at a standardized distance as the size of the symbols is varied  6/6 vision" the numerator refers to the distance in meter from which a person can reliably distinguish a pair of objects. The denominator is the distance from which an 'average' person would be able to distinguish —the distance at which their separation angle is 1 arc minute.
  • 13.
     Visual acuityis often measured according to the size of letters viewed on a Snellen chart or the size of other symbols, such as Landolt Cs or Tumbling E.
  • 14.
  • 15.
     Contrast isthe difference in visual properties that makes an object distinguishable from other objects and the background .  determined by the difference in the color and brightness of the object and other objects within the same field of view.  Can detect very eary visual dysfunction, even when snellen VA is normal  Example: Pelli-Robson chart
  • 17.
     a gridof horizontal and vertical lines used to monitor a person's central 20 visual field.  Mainly for screening &monitoring macular disease.  The original Amsler grid was black and white. A color version with a blue and yellow grid is more sensitive and can be used to test for a wide variety of visual pathway abnormalities, including those associated with the retina, the optic nerve, and the pituitary gland.  There are 7 charts ,each consisting of 10cm squar.
  • 18.
    An Amsler grid,as seen by a person with normal vision.
  • 19.
     An Amslergrid, as it might be viewed by a person with age related macular degeneration.
  • 20.
     Macular disease= wavy lines  Optic nerve disease = missing or faint lines but not distorted
  • 21.
     the abilityof the visual system to adjust to various levels of darkness and light.  Tested by dark adaptometry.  Maily useful in patients with nyctalopia.
  • 22.
     Gross testof dark adaptation.  Used to differentiate visual loss caused by macular from that caused by an optic nerve lesion.  Normal recovery time = 15-30 seconds  Delay in visual recovery indicates macular pathology (e.g CME ,CSR)
  • 23.
     To testoptic nerve function by comparing light brightness in one eye with the fellow.  In optic neuropathy , light is less bright in the affected eye.
  • 24.
     ability toperceive differences between colors .  color blindness, a color vision deficiency, is the inability to perceive differences between some of the colors that others can distinguish.  Tests:  Ishihara: most often used to diagnose red- green color deficiencies.
  • 25.
     Hardy-rand-rittler: moresensitive than ishihara , it detect all 3 congenital defects.  Farnsworth-Munsell 100-hue : most sensitive. Example of an Ishihara color test plate
  • 27.
    •measures the electricalresponses of various cell types in the retina. • Electrodes are usually placed on the cornea and the skin near the eye with a reference electrode on forehead. •Potential between 2 electrodes is amplified & displayed. •Normal ERG is biphasic ,an a-wave (initial negative deflection) followed by a b-wave (positive deflection). •The leading edge of the a-wave is produced by the photoreceptors, while the remainder of the wave is produced by a mixture of cells including photoreceptors, bipolar, amacrine, and Muller cells.
  • 28.
    •If a flashERG is performed on a dark-adapted eye, the response is primarily from the rod system and if a flash ERGs performed on a light adapted eye will reflect the activity of the cone system . •The multifocal ERG is used to record separate responses for different retinal locations. •Clinically used mainly by ophthalmologists and optometrists, the electroretinogram (ERG) is used for the diagnosis of various retinal disease ,examples: Retinitis pigmentosa Leber's congenital amaurosis Cone dystrophy Diabetic retinopathy Retinal vain acclusion..etc
  • 30.
     The mainapplications are in ophthalmological diagnosis and in recording eye movements.  a technique for measuring the resting potential of the retina.  Unlike the electroretinogram, the EOG does not represent the response to individual visual stimuli.  The EOG is used to assess the function of the pigment epithelium.
  • 31.
    During dark adaptation,the resting potential decreases slightly and reaches a minimum ("dark trough") after several minutes. When the light is switched on, a substantial increase of the resting potential occurs ("light peak"), which drops off after a few minutes when the retina adapts to the light. The ratio of the (light peak divided by dark trough) is known as the Arden ratio.
  • 33.
    •VEP is arecording of electrical activity of the visual cortex after retinal stimulation. Main indications: Monitoring visual function in babies. Optic neuropathy Monitor macular pathway function
  • 34.
     Visual acuityis often measured according to the size of letters viewed on a Snellen chart or the size of other symbols, such as Landolt Cs or Tumbling E.
  • 35.
  • 36.
     Contrast isthe difference in visual properties that makes an object distinguishable from other objects and the background .  determined by the difference in the color and brightness of the object and other objects within the same field of view.  Can detect very eary visual dysfunction, even when snellen VA is normal  Example: Pelli-Robson chart
  • 38.
     a gridof horizontal and vertical lines used to monitor a person's central 20 visual field.  Mainly for screening &monitoring macular disease.  The original Amsler grid was black and white. A color version with a blue and yellow grid is more sensitive and can be used to test for a wide variety of visual pathway abnormalities, including those associated with the retina, the optic nerve, and the pituitary gland.  There are 7 charts ,each consisting of 10cm squar.
  • 39.
    An Amsler grid,as seen by a person with normal vision.
  • 40.
     An Amslergrid, as it might be viewed by a person with age related macular degeneration.
  • 41.
     Macular disease= wavy lines  Optic nerve disease = missing or faint lines but not distorted
  • 42.
     the abilityof the visual system to adjust to various levels of darkness and light.  Tested by dark adaptometry.  Maily useful in patients with nyctalopia.
  • 43.
     Gross testof dark adaptation.  Used to differentiate visual loss caused by macular from that caused by an optic nerve lesion.  Normal recovery time = 15-30 seconds  Delay in visual recovery indicates macular pathology (e.g CME ,CSR)
  • 44.
     To testoptic nerve function by comparing light brightness in one eye with the fellow.  In optic neuropathy , light is less bright in the affected eye.
  • 45.
     ability toperceive differences between colors .  color blindness, a color vision deficiency, is the inability to perceive differences between some of the colors that others can distinguish.  Tests:  Ishihara: most often used to diagnose red- green color deficiencies.
  • 46.
     Hardy-rand-rittler: moresensitive than ishihara , it detect all 3 congenital defects.  Farnsworth-Munsell 100-hue : most sensitive. Example of an Ishihara color test plate
  • 48.
    •measures the electricalresponses of various cell types in the retina. • Electrodes are usually placed on the cornea and the skin near the eye with a reference electrode on forehead. •Potential between 2 electrodes is amplified & displayed. •Normal ERG is biphasic ,an a-wave (initial negative deflection) followed by a b-wave (positive deflection). •The leading edge of the a-wave is produced by the photoreceptors, while the remainder of the wave is produced by a mixture of cells including photoreceptors, bipolar, amacrine, and Muller cells.
  • 49.
    •If a flashERG is performed on a dark-adapted eye, the response is primarily from the rod system and if a flash ERGs performed on a light adapted eye will reflect the activity of the cone system . •The multifocal ERG is used to record separate responses for different retinal locations. •Clinically used mainly by ophthalmologists and optometrists, the electroretinogram (ERG) is used for the diagnosis of various retinal disease ,examples: Retinitis pigmentosa Leber's congenital amaurosis Cone dystrophy Diabetic retinopathy Retinal vain acclusion..etc
  • 51.
     a techniquefor measuring the resting potential of the retina.  The main applications are in ophthalmological diagnosis and in recording eye movements.  Unlike the electroretinogram, the EOG does not represent the response to individual visual stimuli.  The EOG is used to assess the function of the pigment epithelium.
  • 52.
    •During dark adaptation,the resting potential decreases slightly and reaches a minimum ("dark trough") after several minutes. When the light is switched on, a substantial increase of the resting potential occurs ("light peak"), which drops off after a few minutes when th retina adapts to the light. The ratio of the (light peak divided by dark trough) is known as the Arden ratio.
  • 54.
    •VEP is arecording of electrical activity of the visual cortex after retinal stimulation. Main indications: Monitoring visual function in babies. Optic neuropathy Monitor macular pathway function