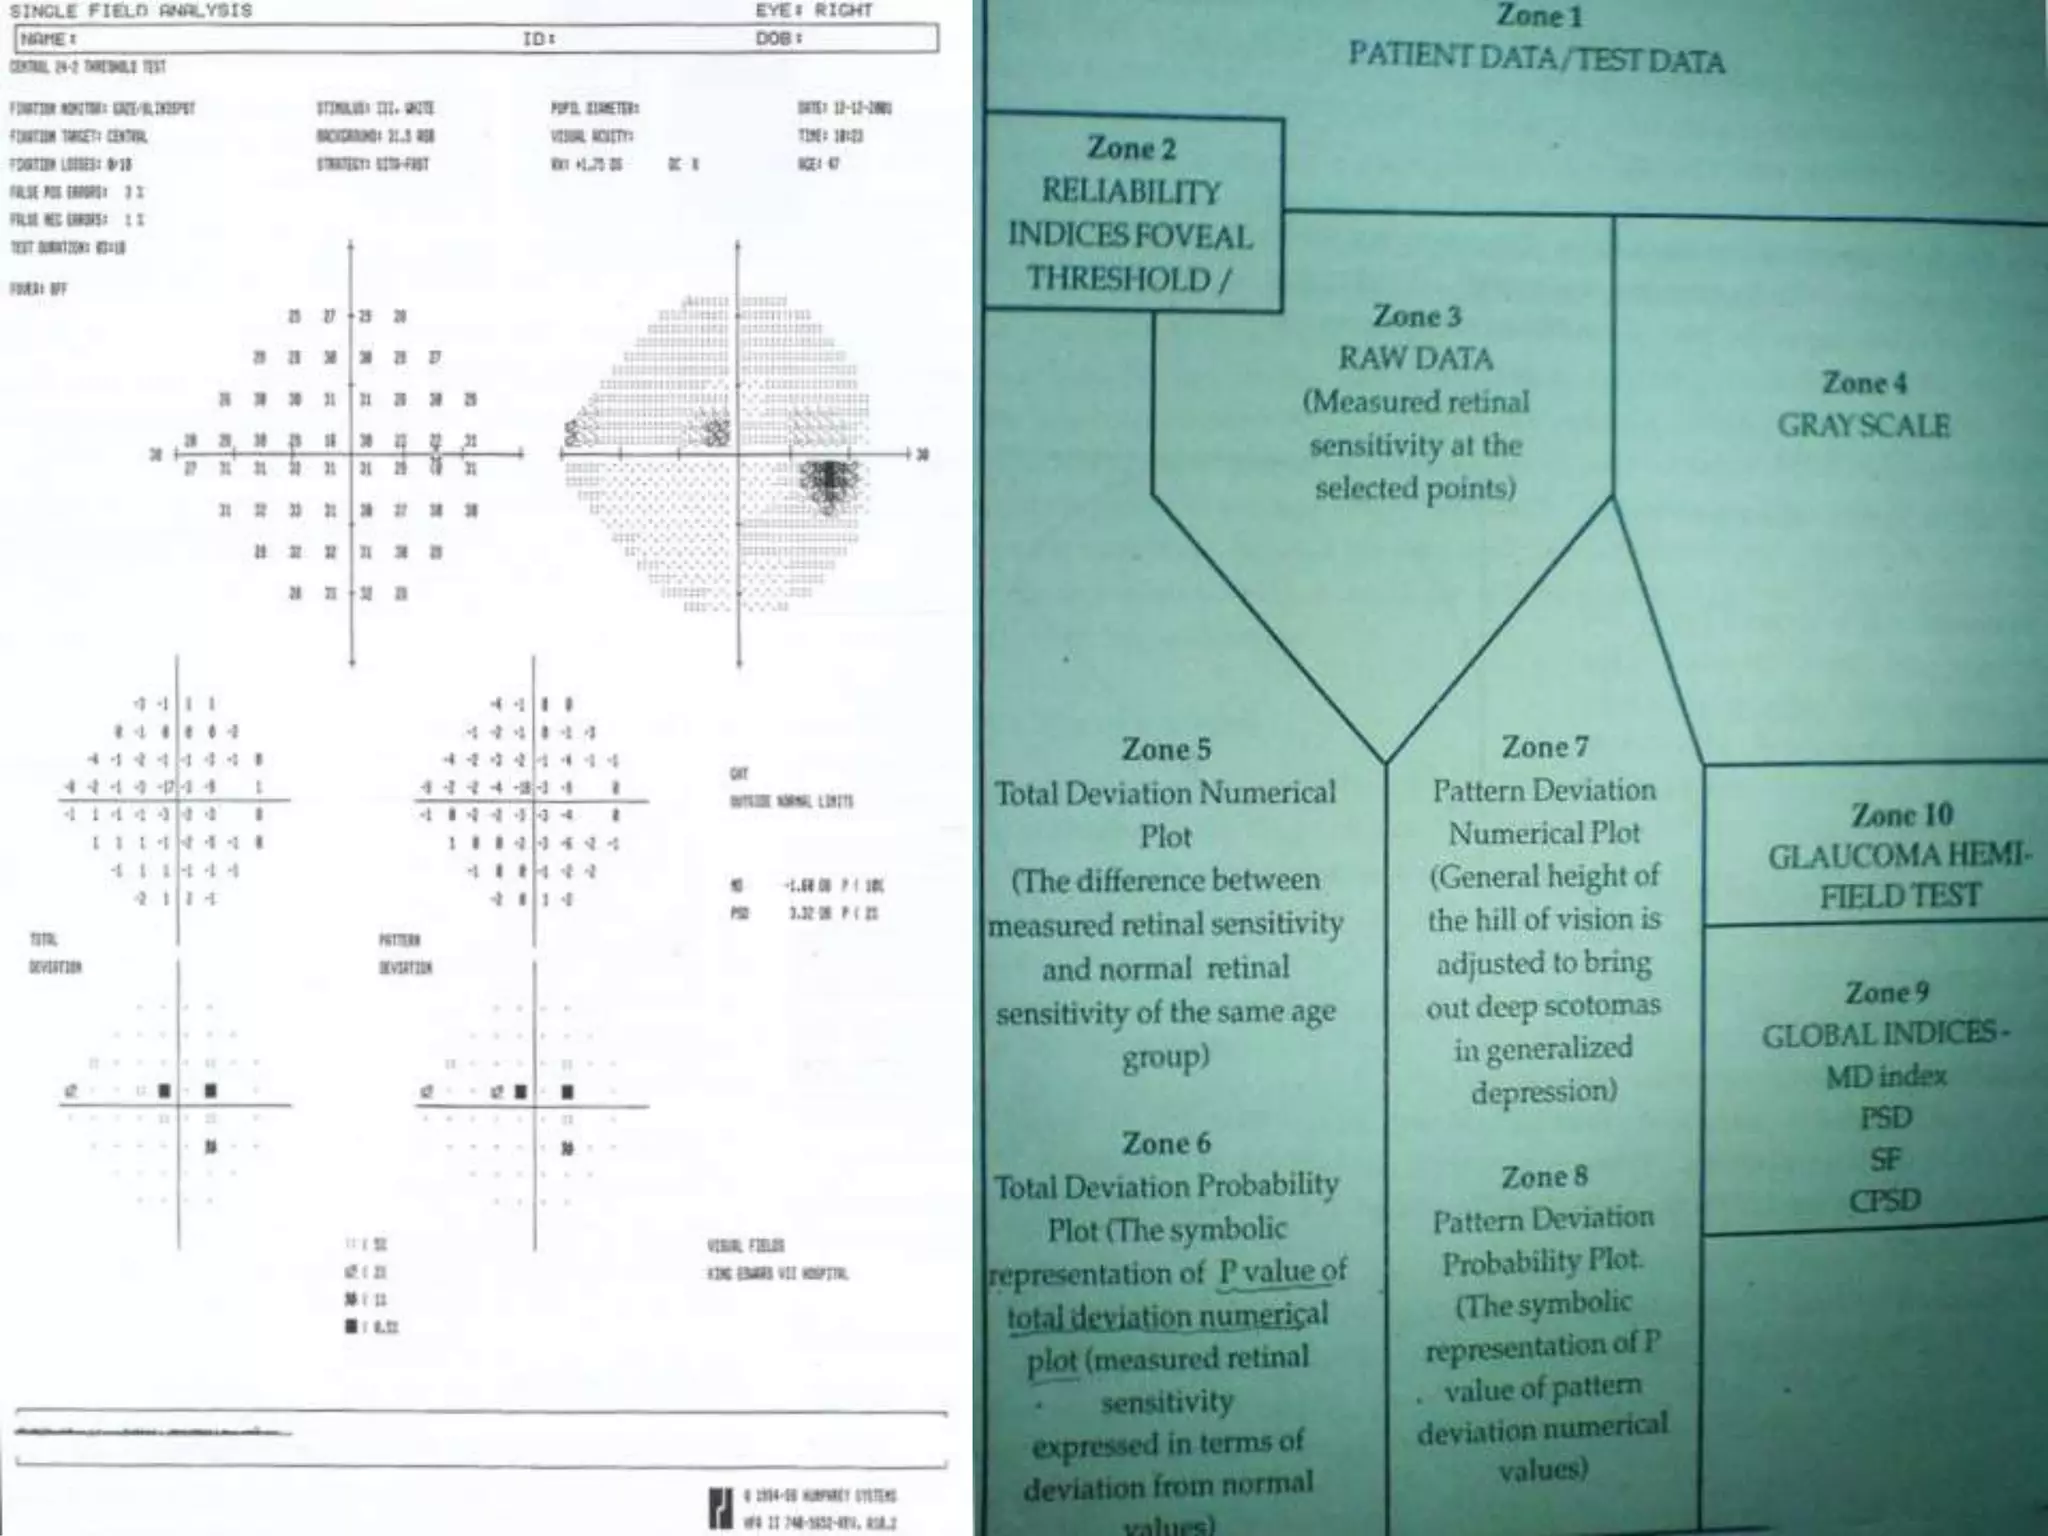
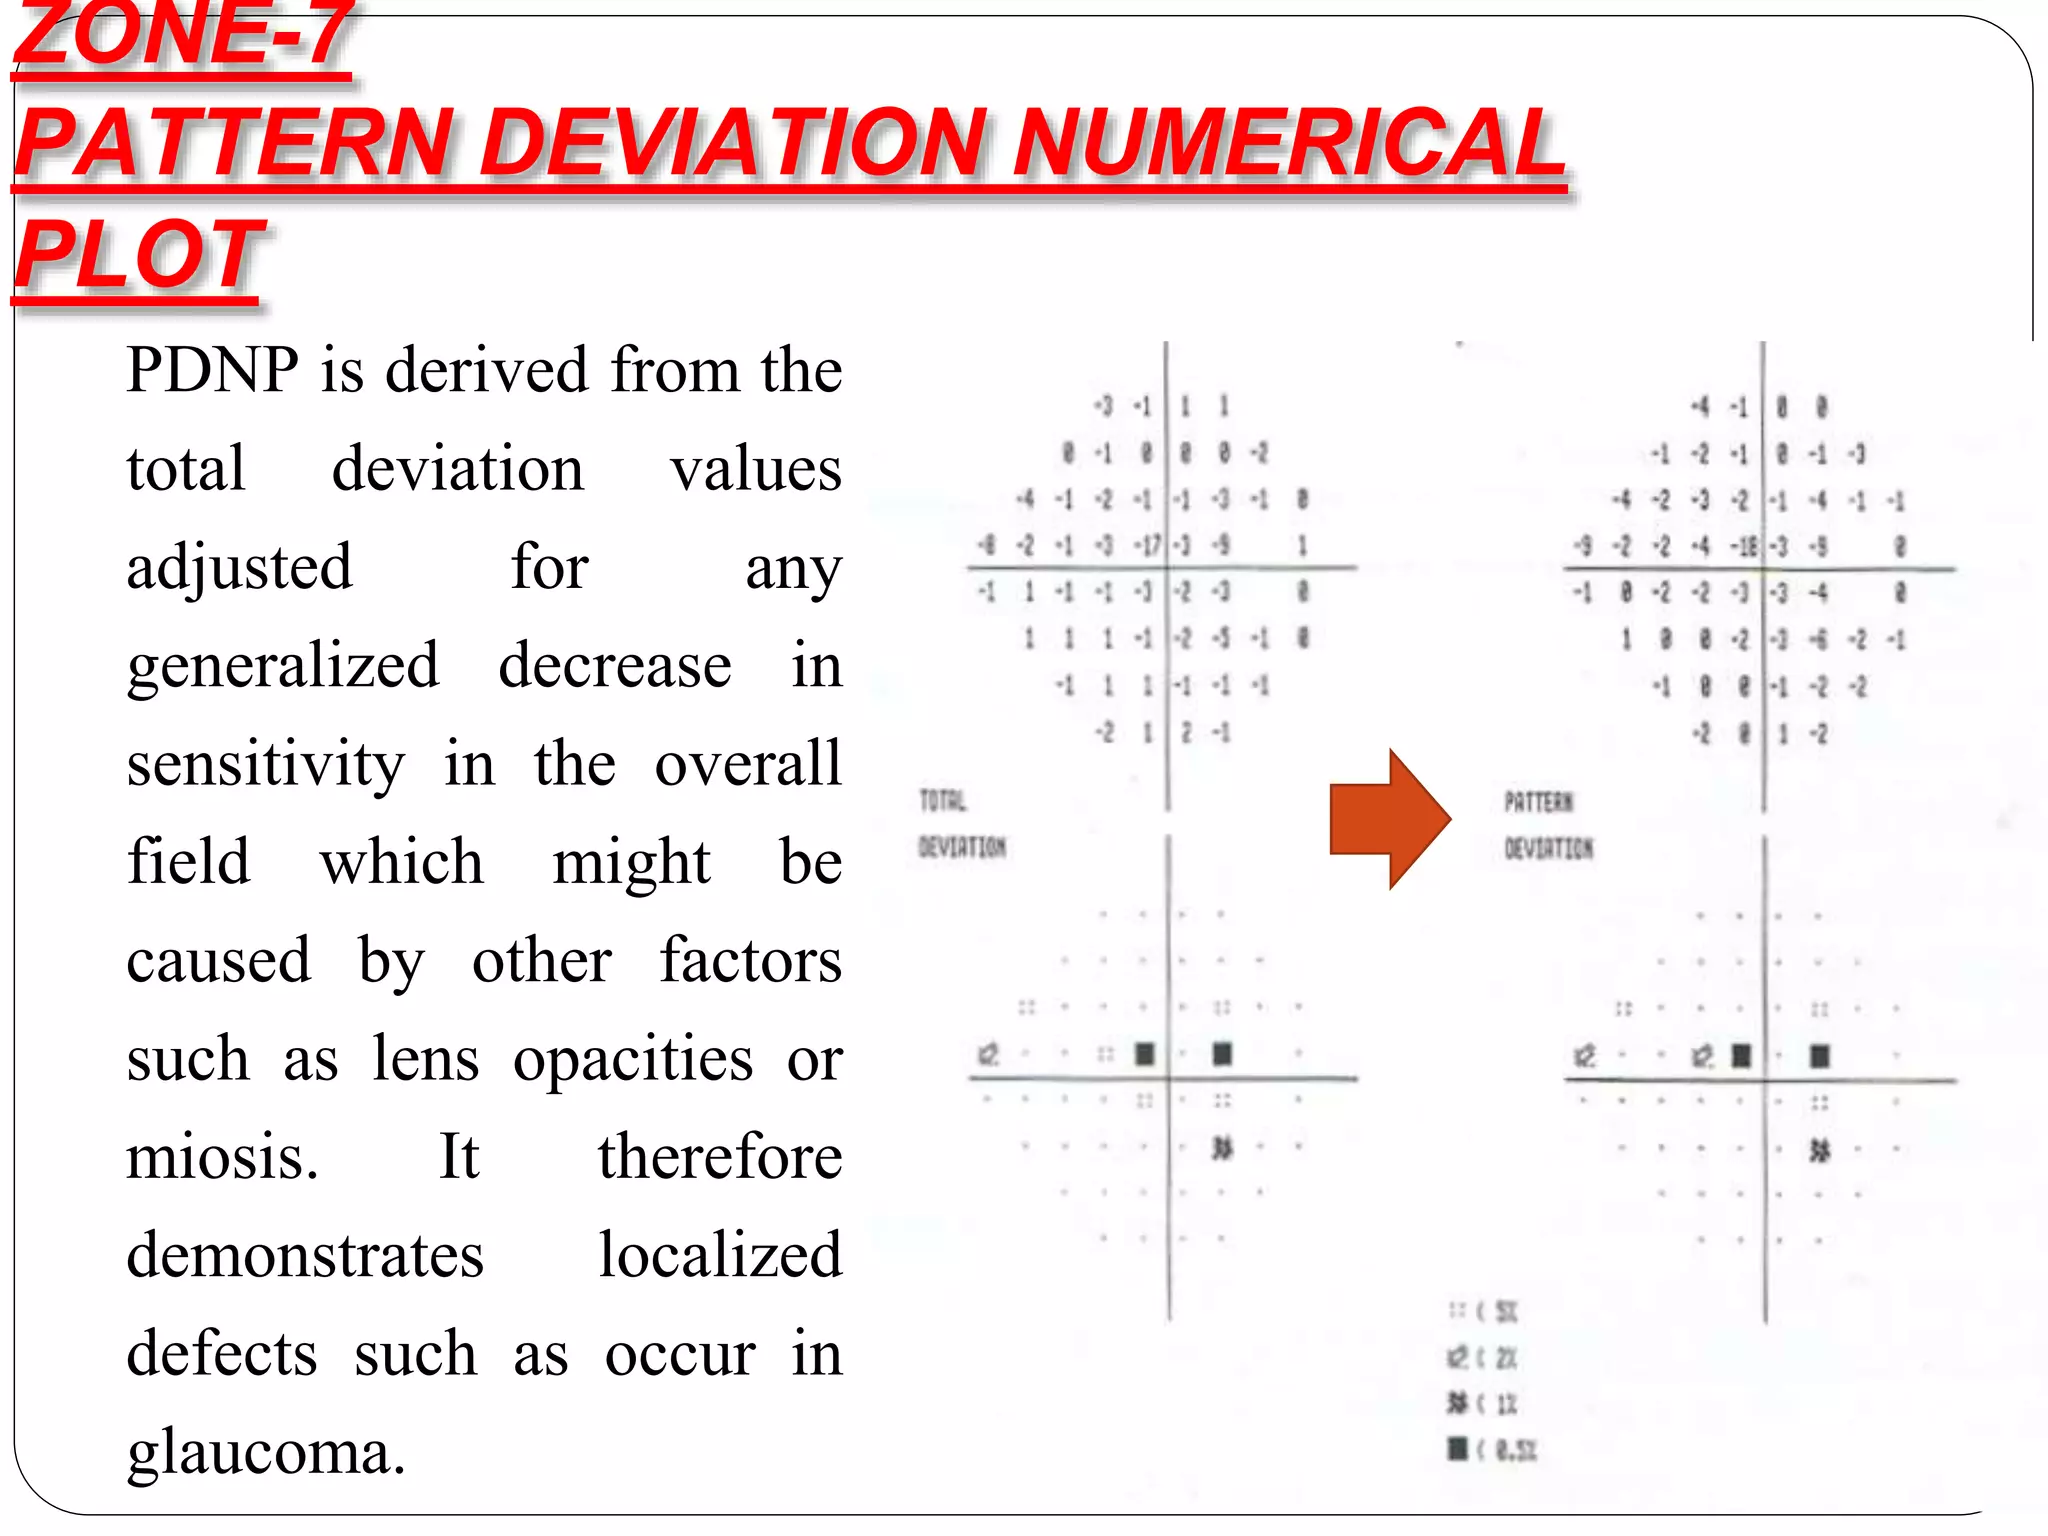
Moderators: Prof. H. Ashraf
Dr. S M Zakir
Presenter Armaan Ahmed
INTERPRETATION OF AUTOMATED
PERIMETRY
Automated Perimetry
●Automated threshold static perimetry
quantifies the sensitivity of a patient’s
central vision using efficient and
standardized testing algorithms.
●Perimetry is essential in glaucoma
management and also frequently
useful in diagnosis and management
of some neurological and retinal
diseases.
● Visual field is a 3-D
structure akin to a
Hill-of-Vision
● Normal field is
horizontally oval with a
shallow inferonasal
depression
50 ˚ superiorly
60 ˚ nasally
70 ˚ inferiorly , and
90 ˚ temporally
Terminologies
❖ Isopter
● Line on a visual field representation connecting points
with same visible threshold.
❖Scotoma
● It is an area of reduced(‘relative’) or
total(‘absolute’)loss of vision that is
surrounded by a field of normal or a relatively
well-preserved vision.
❖Blind spot
● Physiological scotoma corresponding to optic
nerve head
● b/w 10-20 ˚ .It is located temporally and slightly
inferiorly.
LUMINANCE
• Intensity/brightness of a light stimulus
• measured in apostilb or decibel (logarithmic
unit)
• The humphrey perimeter presents white light
stimuli that can be varied in brightness with
maximum brightness of 0dB (10000asb) and
minimum brightness of 51dB(0.08asb).
• In standardized testing,the dimmest stimulus
that can be seen by a young well trained
observer is little less than 40dB.
Visible threshold
● Luminance of a given stimulus at which it
is perceived 50 % of the time when
presented statically.
PERIMETRY VS CAMPIMETRY
❖Perimetry – measurement of visual field
by projecting targets onto a curved
surface
❖Campimetry – measurement of visual
field by projecting targets onto a flat
surface
Types of Perimetry
●Kinetic
●Static
Why Automation?
● Removes subjectivity of perimetrist
● Improves uniformity and reproducibility
● Computer provides facility of random
presentation of targets, estimation of
patient reliability and statistical
evaluation of data
● Faster ,more accurate and informative
Zone 1- patients data and test data
Test Data
Fixation monitor: Blind spot
Fixation Target: Central
Colour of the stimulus: White
Back ground illumination: 31.5asb
Stimulus size: Goldmann Size III
Threshold test pattern:
Testing strategy:
Patient Data
Name of the patient:
Date of birth and age:
Pupil Diameter:
Visual Acuity:
Refractive error correction for N.V.
DOB OF THE PATIENT- Since the interpretation of raw data by
STATPAC is age dependent, it is very important to enter the age
of the patient accurately. Otherwise the patients raw data will be
compared to mean normal threshold value of a wrong age group
and thus derived decibel deviations from the normal will form
the numerical plot .
SIZE OF THE STIMULUS – The Humphrey Perimeter is capable
of testing with five standard Goldman stimulus sizes.
Size III stimulus is used almost exclusively.
Size V stimulus is sometimes employed in advanced field loss.
Sizes I,II and IV are almost never used in static visual field
testing.
EFFECT OF SIZE OF PUPIL-
. Normal size 3-4 mm.
. Constricted pupil is thought to give rise to diffuse visual
field defects and edge scotomas
. Pupil size less than 2mm is more likely to exert a
significant effect on the overall level of the visual field.
Constricted field d/t
miosis
Pupil Diameter: 1.0mm
Repeat Perimetry with
Pupil Diameter: 2.5 mm
• REFRACTIVE ERROR-
• Refractive blur reduces visual sensitivity to
perimetric stimuli.
• One dioptre of refractive blur in undilated patient will
produce a little more than 1dB of depression of field
of vision when testing with Goldmann Size III
stimulus.
• Hence near vision must be properly corrected ,
otherwise the visual field will show a generalized
depression .
Strategies
● Suprathreshold – Suprathreshold perimetry
involves testing with stimuli of luminance
above the expected normal threshold levels for
an age-matched population to assess whether
these are detected; in other words, testing to
check that a subject can see stimuli that would
be seen by a normal person of the same age.
It enables testing to be carried out rapidly to
indicate whether function is grossly normal or
not.
● However, it is not highly quantitative, and so is
usually reserved for screening.
Threshold perimetry
● It is used for detailed assessment of the hill of
vision by plotting the threshold luminance value in
various locations in the visual field and comparing
the results with age-matched ‘normal’ values.
● Here the threshold is crossed in one direction
with large increments, then crossed again to ‘fine-
tune’ the result with smaller increments.
● Threshold testing is quantitatively detailed and is
therefore used for monitoring glaucomatous
fields.
SITA (Swedish Interactive Threshold
Algorithm):
● A newer, faster thresholding algorithm
● Shows more abnormal points in PDP than
the full-threshold programme.
● Provides shorter testing time with good
accuracy & reproducibility by less number of
stimuli.
Types :
a) SITA standard – Average testing time
50% of FTT
b) SITA fast - 30% less time than SITA std
but less accurate.
TESTING PATTERNS
● Most important defects in glaucoma occur within the central
30° radius of field, so this is the area most commonly tested.
● The 30-2 test pattern measures visual sensitivity at 76
locations within 30° of fixation.
● The 24-2 test pattern consists of 54 most central test
locations of the 30-2 pattern .
● The number after the dash (–2 or sometimes –1) describes the
pattern of the points tested.
● The –2 strategy involves a grid of test points spaced 6° apart,
offset from the vertical and horizontal meridia whereas the
-1 includes points along the vertical and horizontal meridia.
Other examples include-
1) 10–2 which is used to assess an area of central radius 10° –
as defects here may threaten central vision as in macular
diseases and
2) FF (‘full field’) – 120 (120°) is used to assess neurological
defects
ZONE 2- FOVEAL THRESHOLD AND
RELIABILITY INDICES
●Foveal threshold –it is useful to measure
the foveal threshold at the very beginning
of the test . If the patient is not properly
focused on the bowl ,foveal sensitivity will
be reduced along with the remainder of
the field.
●Visual Acuity-BCVA should be 6/36 or
better for the visual field to be tested.
Reliability indices-
•Fixation losses-The fixation
loss rate measures patients gaze
stability.During the test 5% of
the stimulus will be presented on
the blind spot. The patients
response to this stimulus
presentation will tell that the
patient is not gazing straight or
is looking from side to side
during test.
•fixation losses more than 20%
are considered to be of fixation
unreliable.
•False positive response-
• These are detected when
stimulus is accompanied by a
sound.If the sound alone is
presented and the patient still
responds,a false positive is
recorded.
- FP >15% is strongly
associated with compromised
test.
-With a high FP
score,grey scale appears
abnormally pale.
● False negative
response-
● These are detected by
presenting a stimulus
much (9dB)brighter
than threshold at a
location where the
threshold has already
been determined. If the
patient fails to respond
a false negative is
recorded
- In general >30% of
FN is considered
abnormal
ZONE-3 RAW DATA
● The raw data is the exact retinal sensitivity in
dB units of the selected points calculated by
field analyser.
● In raw data 0 dB = absolute scotoma.
● 40 dB is the highest retinal sensitivity.
● In same patient the raw data calculated by
different strategies is not exactly similar .
ZONE-4 GREY SCALE
ZONE-5
TOTAL DEVIATION NUMERICAL PLOT
• The measured retinal
sensitivity is now
compared with the
mean normal sensitivity
of those points of same
age groups of the
patient and calculates
the difference between
them at each point and
plots them as TDNP.
• If there is no field loss – TDNP must have
deviation value 0 to -2
Localized field loss- high deviation values at
those particular areas.
Uniform generalized field loss-all the deviation
values will be almost symmetrical and the
difference between max and min deviation
values will be minimal.
In irregular generalized field defects – the
deviation values in TDNP will show dissimilar
deviation values and the difference between
max and min values will be very high .
Conversion of numerical data to
probability data
● P<5% indicates the retinal
sensitivity of that point is seen
in < 5% of normal population.
● P<2%, P<1%,P<0.5%
● Probability statements are
based on the distribution seen
in the normal population .
● Darker the symbol,the greater
the probability of abnormality
as indicated by P value.
● Higher the P value lesser the
chances of field being
abnormal
ZONE-6
TOTAL DEVIATION PROBABILITY
PLOT
• STATPAC calculates the
P value of each dB
deviation in the TDNP.
• A symbol is given to each
P value as shown in the
fig.
• Each deviation in TDNP is
converted to a symbolic
form according to its P
value and plotted as
TDPP.
• By seeing TDPP we
cannot tell the depth of
defect at that point .
ZONE-7
PATTERN DEVIATION NUMERICAL
PLOT
PDNP is derived from the
total deviation values
adjusted for any
generalized decrease in
sensitivity in the overall
field which might be
caused by other factors
such as lens opacities or
miosis. It therefore
demonstrates localized
defects such as occur in
glaucoma.
ZONE 8
PATTERN DEVIATION PROBABILITY
PLOT
● PDPP is the symbolic
representation of P value of
each numerical threshold
deviation values of PDNP or
the symbolic representation
of p value of each measured
retinal sensitivity corrected
for generalized loss.
● In uniform generalized
depression we do not see
any scotoma in PDPP.
● In irregular generalized
depression, the mild and
moderate field defects are
eliminated and the deep
defects are highlighted in the
PDPP.
ZONE-9 GLOBAL INDICES
• The basic global field
indices are-
1.Mean deviation(MD)
2.Short term fluctuation (SF)
3.Pattern standard
deviation(PSD)
4.Corrected pattern standard
deviation(CPSD)
MEAN DEVIATION
• MD gives an indication of the overall sensitivity of the
field.
• The positive value indicates better overall retinal
sensitivity than normal observer.
• Negative value indicates that the patient’s overall
sensitivity is worse than the average normal individual.
PATTERN STANDARD
DEVIATION
• It is a measure of focal loss or variability within the field
taking into account any generalized depression in the hill of
vision.
● An increased PSD is therefore a more specific indicator of
glaucomatous damage than MD.
SHORT TERM
FLUCTUATION
• It is an index of intra test variation.
• At 10 preselected points the retinal sensitivity
will be calculated twice.
• The result of 1st series of the threshold values
at these points are compared with the 2nd
series of threshold values at these points and
the difference between them is calculated .
• It is not available for SITA strategy.
• A high SF means either decreased reliability
or an early finding indicative of glaucoma .
CORRECTED PATTERN
STANDARD DEVIATION(CPSD)
● It is the PSD corrected for short term
fluctuations.
● It indicate the variability between
adjacent points that may be due to
disease rather than due to intra-test
variability .
ZONE-10 GLAUCOMA HEMIFIELD
TEST
• GHT evaluates 5
zones in the upper
field and compares
these zones to
their mirror image
zones in the lower
field .
• The zones are
constructed in the
approx patterns of
retinal nerve fibres.
● Depending upon the values between upper and
lower clusters of points the following five
messages may be displayed ;
● Outside normal limit –It is displayed whenever at
least one zone pair differs by an amount found in
fewer than 1% of normal subjects.
● Border line – It is displayed whenever at least one
zone pair differs by an amount found in fewer than
3% but more than 1% of normal subjects.
● General reduction in sensitivity /Abnormally high
sensitivity : These messages are presented
whenever even the best test point locations are
either so low or so high as to be at levels seen in
fewer than 0.5% of normal subjects.
● Within normal limit .- if none of the above conditions
Interpretation of
Visual field printout.
VISUAL FIELD SEVERITY GRADING SYSTEM
as proposed by Hodapp, Anderson, and Parrish.
Stage 1: Early Defect :
Mean deviation (MD)
≤ –6.00 dB and at least
one of the following:
A) On pattern deviation plot,
<25% of the points depressed
below the 5% level and less
than 15% depressed below 1%
level.
B) No point within central 5 ˚ with
sensitivity <15dB.
Stage 2: Moderate
Defect :
MD of –6.01 to –12.00 dB and at
least one of the following:
A) On pattern deviation plot,
greater than or equal to 25% but
fewer than 50% of points
depressed below the 5% level,
and greater than or equal to 15%
but fewer than 25% of points
depressed below 1% level
B) At least 1 point within central 5°
with sensitivity of < 15 dB but no
point within central 5° with
sensitivity of < 0 dB
C) Only 1 hemifield containing a
point with sensitivity < 15 dB
within 5° of fixation
Stage 3: Advanced
Defect : MD of –12.01 dB to
–20.00 dB and at least one of
the following:
A) On pattern deviation plot,
greater than or equal to 50%
but fewer than 75% of points
depressed below the 5% level
and greater than or equal to
25% but fewer than 50% of
points depressed below 1%
level
B) Any point within central 5°
with sensitivity of < 0 dB
C) Both hemifields containing a
point(s) with sensitivity < 15 dB
within 5° of fixation
Stage 4: Severe Defect :
MD of –20.00 dB and at least
one of the following:
A) On pattern deviation plot,
greater than or equal to 75%
of points depressed below
the 5% level and greater than
or equal to 50% of points
depressed below 1% level
B )At least 50% of points
within central 5° with
sensitivity of < 0 dB
C )Both hemifields containing
greater than 50% of points
with sensitivity < 15 dB
within 5° of fixation
Stage 5: End-Stage Disease -
Unable to perform Humphrey visual fields in
“worst eye” due to central scotoma
or “worst eye” visual acuity of 6/60 or
worse due to primary open-angle
glaucoma. “Best eye” may be any stage
Paracentra
l
scotoma
Nasal step
scotoma
Arcuate
scotoma
Severe
Defect
Measurement of visual field
progression
GLAUCOMA PROGRESSION
ANALYSIS
● Helps to identify and quantify visual field progression.
● Includes:
- Event Analysis &
- Trend Analysis
● Event analysis assess whether there has been any
statistically significant worsening in the visual field .
● Trend analysis’s goal is to quantify any observed rate
of change.
GPA SUMMARY REPORT
● Preferred report for use in glaucoma
management.Includes-
1)Two baseline fields
2)An event analysis of the most recent test.
3)A trend analysis of all available tests.
GPA Event Analysis
● GPA provides a plain language event analysis
called GPA Alert which displays either of the
following 2 messages:
Possible Progression Likely Progression
•When three or more
test points show
statistically significant
deterioration on two
consecutive follow up
examinations.
•When the same three or
more significantly
deteriorated test points
appear in atleast three
consecutive follow-up
tests.
● GPA change probability maps use triangle
symbols to highlight statistically significant
deterioration from a baseline consisting of the
average of two chosen tests.Each follow up is
compared to baseline and :
● OPEN TRIANGLES:indicate test point locations
with deterioration that is statistically significant
at the 5% level.
● HALF BLACK TRIANGLES:indicate test point
locations that have shown statistically
significant deterioration in two consecutive
follow-up examinations.
● FILLED IN BLACK TRIANGLES :Designate
locations where such deterioration has been
observed in three or more consecutive tests.
GPA TREND ANALYSIS
● The goal of trend analysis is to quantify how
quickly each patient is changing and thereby
identify patients who are progressing at rates that
threaten to cause considerable visual disability
within the patient’s expected lifetime.
● Here we estimate the rate of progression using
linear regression analysis of the Visual Field
Index(VFI) over time.
VISUAL FIELD INDEX (VFI)
● It is the enhancement of Mean Deviation(MD) that
is designed to be less affected by cataract and is
more sensitive to changes near the centre of field
so as to better co-relate with ganglion cell loss.
● VFI is thus a single number that summarizes each
patients visual field status as a % of normal age
corrected sensitivity.
● VFI of 100% implies completely normal visual
field and
● VFI of 0% implies a perimetrically blind visual
field.
The overview
printout:
sequential series of
upto 16 visual fields
(grey scale,
measured thresholds,
TD & PD)
of same patient on a
single sheet of paper.
SELECTIVE PERIMETRY
There are thought to be three subtypes of retinal ganglion cells that
connect the retina to the lateral geniculate nucleus (LGN):
1)The most numerous of these three subtypes, the midget ganglion
cells, connect to the parvocellular layer of the LGN.
2)The parasol cells, which comprise about 10% of the ganglion cell
population, project to the magnocellular layers of the LGN.
3) The blue-yellow ganglion cells, or B-Y cells, project to the koniocellular
layers of the LGN.
SHORT WAVELENGTH AUTOMATED
PERIMETRY(SWAP)
● Also known as “Blue on yellow perimetry”.
● It selectively tests the B-Y ganglion cells that project to the
koniocellular layers of the LGN.
● Sensitivity to blue light (mediated by blue cone photoreceptors)
is adversely affected relatively early in glaucoma.
● SWAP is mostly being used currently to test patients who have
suspicious optic discs but normal SAP fields
● LIMITATIONS-
1) Lengthy test
2) Longer learning curve
3) Influence of nuclear sclerosis
4) Higher test variability.
5) No clinical utility in moderate-advanced glaucoma
FREQUENCY DOUBLING
CONTRAST TEST(FDT)
● FDT relies on what is known as the frequency doubling
illusion.
● It selectively tests cells in the magnocellular
pathway(thought to be damaged first in glaucoma),
perhaps allowing earlier glaucoma diagnosis than
white-on-white perimetry.
Automated perimetry should never
ever be interpreted in isolation
Automated perimetry

Automated perimetry

  • 1.
    Moderators: Prof. H.Ashraf Dr. S M Zakir Presenter Armaan Ahmed INTERPRETATION OF AUTOMATED PERIMETRY
  • 2.
    Automated Perimetry ●Automated thresholdstatic perimetry quantifies the sensitivity of a patient’s central vision using efficient and standardized testing algorithms. ●Perimetry is essential in glaucoma management and also frequently useful in diagnosis and management of some neurological and retinal diseases.
  • 3.
    ● Visual fieldis a 3-D structure akin to a Hill-of-Vision ● Normal field is horizontally oval with a shallow inferonasal depression 50 ˚ superiorly 60 ˚ nasally 70 ˚ inferiorly , and 90 ˚ temporally
  • 4.
    Terminologies ❖ Isopter ● Lineon a visual field representation connecting points with same visible threshold.
  • 5.
    ❖Scotoma ● It isan area of reduced(‘relative’) or total(‘absolute’)loss of vision that is surrounded by a field of normal or a relatively well-preserved vision. ❖Blind spot ● Physiological scotoma corresponding to optic nerve head ● b/w 10-20 ˚ .It is located temporally and slightly inferiorly.
  • 6.
    LUMINANCE • Intensity/brightness ofa light stimulus • measured in apostilb or decibel (logarithmic unit) • The humphrey perimeter presents white light stimuli that can be varied in brightness with maximum brightness of 0dB (10000asb) and minimum brightness of 51dB(0.08asb). • In standardized testing,the dimmest stimulus that can be seen by a young well trained observer is little less than 40dB.
  • 7.
    Visible threshold ● Luminanceof a given stimulus at which it is perceived 50 % of the time when presented statically.
  • 8.
    PERIMETRY VS CAMPIMETRY ❖Perimetry– measurement of visual field by projecting targets onto a curved surface ❖Campimetry – measurement of visual field by projecting targets onto a flat surface
  • 9.
  • 10.
    Why Automation? ● Removessubjectivity of perimetrist ● Improves uniformity and reproducibility ● Computer provides facility of random presentation of targets, estimation of patient reliability and statistical evaluation of data ● Faster ,more accurate and informative
  • 12.
    Zone 1- patientsdata and test data Test Data Fixation monitor: Blind spot Fixation Target: Central Colour of the stimulus: White Back ground illumination: 31.5asb Stimulus size: Goldmann Size III Threshold test pattern: Testing strategy: Patient Data Name of the patient: Date of birth and age: Pupil Diameter: Visual Acuity: Refractive error correction for N.V.
  • 13.
    DOB OF THEPATIENT- Since the interpretation of raw data by STATPAC is age dependent, it is very important to enter the age of the patient accurately. Otherwise the patients raw data will be compared to mean normal threshold value of a wrong age group and thus derived decibel deviations from the normal will form the numerical plot . SIZE OF THE STIMULUS – The Humphrey Perimeter is capable of testing with five standard Goldman stimulus sizes. Size III stimulus is used almost exclusively. Size V stimulus is sometimes employed in advanced field loss. Sizes I,II and IV are almost never used in static visual field testing.
  • 14.
    EFFECT OF SIZEOF PUPIL- . Normal size 3-4 mm. . Constricted pupil is thought to give rise to diffuse visual field defects and edge scotomas . Pupil size less than 2mm is more likely to exert a significant effect on the overall level of the visual field.
  • 15.
  • 16.
  • 17.
    • REFRACTIVE ERROR- •Refractive blur reduces visual sensitivity to perimetric stimuli. • One dioptre of refractive blur in undilated patient will produce a little more than 1dB of depression of field of vision when testing with Goldmann Size III stimulus. • Hence near vision must be properly corrected , otherwise the visual field will show a generalized depression .
  • 18.
    Strategies ● Suprathreshold –Suprathreshold perimetry involves testing with stimuli of luminance above the expected normal threshold levels for an age-matched population to assess whether these are detected; in other words, testing to check that a subject can see stimuli that would be seen by a normal person of the same age. It enables testing to be carried out rapidly to indicate whether function is grossly normal or not. ● However, it is not highly quantitative, and so is usually reserved for screening.
  • 19.
    Threshold perimetry ● Itis used for detailed assessment of the hill of vision by plotting the threshold luminance value in various locations in the visual field and comparing the results with age-matched ‘normal’ values. ● Here the threshold is crossed in one direction with large increments, then crossed again to ‘fine- tune’ the result with smaller increments. ● Threshold testing is quantitatively detailed and is therefore used for monitoring glaucomatous fields.
  • 21.
    SITA (Swedish InteractiveThreshold Algorithm): ● A newer, faster thresholding algorithm ● Shows more abnormal points in PDP than the full-threshold programme. ● Provides shorter testing time with good accuracy & reproducibility by less number of stimuli. Types : a) SITA standard – Average testing time 50% of FTT b) SITA fast - 30% less time than SITA std but less accurate.
  • 22.
    TESTING PATTERNS ● Mostimportant defects in glaucoma occur within the central 30° radius of field, so this is the area most commonly tested. ● The 30-2 test pattern measures visual sensitivity at 76 locations within 30° of fixation. ● The 24-2 test pattern consists of 54 most central test locations of the 30-2 pattern .
  • 23.
    ● The numberafter the dash (–2 or sometimes –1) describes the pattern of the points tested. ● The –2 strategy involves a grid of test points spaced 6° apart, offset from the vertical and horizontal meridia whereas the -1 includes points along the vertical and horizontal meridia.
  • 24.
    Other examples include- 1)10–2 which is used to assess an area of central radius 10° – as defects here may threaten central vision as in macular diseases and 2) FF (‘full field’) – 120 (120°) is used to assess neurological defects
  • 25.
    ZONE 2- FOVEALTHRESHOLD AND RELIABILITY INDICES ●Foveal threshold –it is useful to measure the foveal threshold at the very beginning of the test . If the patient is not properly focused on the bowl ,foveal sensitivity will be reduced along with the remainder of the field. ●Visual Acuity-BCVA should be 6/36 or better for the visual field to be tested.
  • 26.
    Reliability indices- •Fixation losses-Thefixation loss rate measures patients gaze stability.During the test 5% of the stimulus will be presented on the blind spot. The patients response to this stimulus presentation will tell that the patient is not gazing straight or is looking from side to side during test. •fixation losses more than 20% are considered to be of fixation unreliable.
  • 27.
    •False positive response- •These are detected when stimulus is accompanied by a sound.If the sound alone is presented and the patient still responds,a false positive is recorded. - FP >15% is strongly associated with compromised test. -With a high FP score,grey scale appears abnormally pale.
  • 30.
    ● False negative response- ●These are detected by presenting a stimulus much (9dB)brighter than threshold at a location where the threshold has already been determined. If the patient fails to respond a false negative is recorded - In general >30% of FN is considered abnormal
  • 31.
    ZONE-3 RAW DATA ●The raw data is the exact retinal sensitivity in dB units of the selected points calculated by field analyser. ● In raw data 0 dB = absolute scotoma. ● 40 dB is the highest retinal sensitivity. ● In same patient the raw data calculated by different strategies is not exactly similar .
  • 32.
  • 33.
    ZONE-5 TOTAL DEVIATION NUMERICALPLOT • The measured retinal sensitivity is now compared with the mean normal sensitivity of those points of same age groups of the patient and calculates the difference between them at each point and plots them as TDNP.
  • 34.
    • If thereis no field loss – TDNP must have deviation value 0 to -2 Localized field loss- high deviation values at those particular areas. Uniform generalized field loss-all the deviation values will be almost symmetrical and the difference between max and min deviation values will be minimal. In irregular generalized field defects – the deviation values in TDNP will show dissimilar deviation values and the difference between max and min values will be very high .
  • 35.
    Conversion of numericaldata to probability data ● P<5% indicates the retinal sensitivity of that point is seen in < 5% of normal population. ● P<2%, P<1%,P<0.5% ● Probability statements are based on the distribution seen in the normal population . ● Darker the symbol,the greater the probability of abnormality as indicated by P value. ● Higher the P value lesser the chances of field being abnormal
  • 36.
    ZONE-6 TOTAL DEVIATION PROBABILITY PLOT •STATPAC calculates the P value of each dB deviation in the TDNP. • A symbol is given to each P value as shown in the fig. • Each deviation in TDNP is converted to a symbolic form according to its P value and plotted as TDPP. • By seeing TDPP we cannot tell the depth of defect at that point .
  • 37.
    ZONE-7 PATTERN DEVIATION NUMERICAL PLOT PDNPis derived from the total deviation values adjusted for any generalized decrease in sensitivity in the overall field which might be caused by other factors such as lens opacities or miosis. It therefore demonstrates localized defects such as occur in glaucoma.
  • 38.
    ZONE 8 PATTERN DEVIATIONPROBABILITY PLOT ● PDPP is the symbolic representation of P value of each numerical threshold deviation values of PDNP or the symbolic representation of p value of each measured retinal sensitivity corrected for generalized loss. ● In uniform generalized depression we do not see any scotoma in PDPP. ● In irregular generalized depression, the mild and moderate field defects are eliminated and the deep defects are highlighted in the PDPP.
  • 39.
    ZONE-9 GLOBAL INDICES •The basic global field indices are- 1.Mean deviation(MD) 2.Short term fluctuation (SF) 3.Pattern standard deviation(PSD) 4.Corrected pattern standard deviation(CPSD)
  • 40.
    MEAN DEVIATION • MDgives an indication of the overall sensitivity of the field. • The positive value indicates better overall retinal sensitivity than normal observer. • Negative value indicates that the patient’s overall sensitivity is worse than the average normal individual.
  • 41.
    PATTERN STANDARD DEVIATION • Itis a measure of focal loss or variability within the field taking into account any generalized depression in the hill of vision. ● An increased PSD is therefore a more specific indicator of glaucomatous damage than MD.
  • 42.
    SHORT TERM FLUCTUATION • Itis an index of intra test variation. • At 10 preselected points the retinal sensitivity will be calculated twice. • The result of 1st series of the threshold values at these points are compared with the 2nd series of threshold values at these points and the difference between them is calculated . • It is not available for SITA strategy. • A high SF means either decreased reliability or an early finding indicative of glaucoma .
  • 43.
    CORRECTED PATTERN STANDARD DEVIATION(CPSD) ●It is the PSD corrected for short term fluctuations. ● It indicate the variability between adjacent points that may be due to disease rather than due to intra-test variability .
  • 44.
    ZONE-10 GLAUCOMA HEMIFIELD TEST •GHT evaluates 5 zones in the upper field and compares these zones to their mirror image zones in the lower field . • The zones are constructed in the approx patterns of retinal nerve fibres.
  • 45.
    ● Depending uponthe values between upper and lower clusters of points the following five messages may be displayed ; ● Outside normal limit –It is displayed whenever at least one zone pair differs by an amount found in fewer than 1% of normal subjects. ● Border line – It is displayed whenever at least one zone pair differs by an amount found in fewer than 3% but more than 1% of normal subjects. ● General reduction in sensitivity /Abnormally high sensitivity : These messages are presented whenever even the best test point locations are either so low or so high as to be at levels seen in fewer than 0.5% of normal subjects. ● Within normal limit .- if none of the above conditions
  • 46.
  • 47.
    VISUAL FIELD SEVERITYGRADING SYSTEM as proposed by Hodapp, Anderson, and Parrish. Stage 1: Early Defect : Mean deviation (MD) ≤ –6.00 dB and at least one of the following: A) On pattern deviation plot, <25% of the points depressed below the 5% level and less than 15% depressed below 1% level. B) No point within central 5 ˚ with sensitivity <15dB.
  • 48.
    Stage 2: Moderate Defect: MD of –6.01 to –12.00 dB and at least one of the following: A) On pattern deviation plot, greater than or equal to 25% but fewer than 50% of points depressed below the 5% level, and greater than or equal to 15% but fewer than 25% of points depressed below 1% level B) At least 1 point within central 5° with sensitivity of < 15 dB but no point within central 5° with sensitivity of < 0 dB C) Only 1 hemifield containing a point with sensitivity < 15 dB within 5° of fixation
  • 49.
    Stage 3: Advanced Defect: MD of –12.01 dB to –20.00 dB and at least one of the following: A) On pattern deviation plot, greater than or equal to 50% but fewer than 75% of points depressed below the 5% level and greater than or equal to 25% but fewer than 50% of points depressed below 1% level B) Any point within central 5° with sensitivity of < 0 dB C) Both hemifields containing a point(s) with sensitivity < 15 dB within 5° of fixation
  • 50.
    Stage 4: SevereDefect : MD of –20.00 dB and at least one of the following: A) On pattern deviation plot, greater than or equal to 75% of points depressed below the 5% level and greater than or equal to 50% of points depressed below 1% level B )At least 50% of points within central 5° with sensitivity of < 0 dB C )Both hemifields containing greater than 50% of points with sensitivity < 15 dB within 5° of fixation
  • 51.
    Stage 5: End-StageDisease - Unable to perform Humphrey visual fields in “worst eye” due to central scotoma or “worst eye” visual acuity of 6/60 or worse due to primary open-angle glaucoma. “Best eye” may be any stage
  • 52.
  • 53.
  • 55.
  • 56.
  • 57.
    Measurement of visualfield progression
  • 58.
    GLAUCOMA PROGRESSION ANALYSIS ● Helpsto identify and quantify visual field progression. ● Includes: - Event Analysis & - Trend Analysis ● Event analysis assess whether there has been any statistically significant worsening in the visual field . ● Trend analysis’s goal is to quantify any observed rate of change.
  • 59.
    GPA SUMMARY REPORT ●Preferred report for use in glaucoma management.Includes- 1)Two baseline fields 2)An event analysis of the most recent test. 3)A trend analysis of all available tests.
  • 60.
    GPA Event Analysis ●GPA provides a plain language event analysis called GPA Alert which displays either of the following 2 messages: Possible Progression Likely Progression •When three or more test points show statistically significant deterioration on two consecutive follow up examinations. •When the same three or more significantly deteriorated test points appear in atleast three consecutive follow-up tests.
  • 61.
    ● GPA changeprobability maps use triangle symbols to highlight statistically significant deterioration from a baseline consisting of the average of two chosen tests.Each follow up is compared to baseline and : ● OPEN TRIANGLES:indicate test point locations with deterioration that is statistically significant at the 5% level. ● HALF BLACK TRIANGLES:indicate test point locations that have shown statistically significant deterioration in two consecutive follow-up examinations. ● FILLED IN BLACK TRIANGLES :Designate locations where such deterioration has been observed in three or more consecutive tests.
  • 62.
    GPA TREND ANALYSIS ●The goal of trend analysis is to quantify how quickly each patient is changing and thereby identify patients who are progressing at rates that threaten to cause considerable visual disability within the patient’s expected lifetime. ● Here we estimate the rate of progression using linear regression analysis of the Visual Field Index(VFI) over time.
  • 63.
    VISUAL FIELD INDEX(VFI) ● It is the enhancement of Mean Deviation(MD) that is designed to be less affected by cataract and is more sensitive to changes near the centre of field so as to better co-relate with ganglion cell loss. ● VFI is thus a single number that summarizes each patients visual field status as a % of normal age corrected sensitivity. ● VFI of 100% implies completely normal visual field and ● VFI of 0% implies a perimetrically blind visual field.
  • 66.
    The overview printout: sequential seriesof upto 16 visual fields (grey scale, measured thresholds, TD & PD) of same patient on a single sheet of paper.
  • 67.
    SELECTIVE PERIMETRY There arethought to be three subtypes of retinal ganglion cells that connect the retina to the lateral geniculate nucleus (LGN): 1)The most numerous of these three subtypes, the midget ganglion cells, connect to the parvocellular layer of the LGN. 2)The parasol cells, which comprise about 10% of the ganglion cell population, project to the magnocellular layers of the LGN. 3) The blue-yellow ganglion cells, or B-Y cells, project to the koniocellular layers of the LGN.
  • 68.
    SHORT WAVELENGTH AUTOMATED PERIMETRY(SWAP) ●Also known as “Blue on yellow perimetry”. ● It selectively tests the B-Y ganglion cells that project to the koniocellular layers of the LGN. ● Sensitivity to blue light (mediated by blue cone photoreceptors) is adversely affected relatively early in glaucoma. ● SWAP is mostly being used currently to test patients who have suspicious optic discs but normal SAP fields ● LIMITATIONS- 1) Lengthy test 2) Longer learning curve 3) Influence of nuclear sclerosis 4) Higher test variability. 5) No clinical utility in moderate-advanced glaucoma
  • 69.
    FREQUENCY DOUBLING CONTRAST TEST(FDT) ●FDT relies on what is known as the frequency doubling illusion. ● It selectively tests cells in the magnocellular pathway(thought to be damaged first in glaucoma), perhaps allowing earlier glaucoma diagnosis than white-on-white perimetry.
  • 70.
    Automated perimetry shouldnever ever be interpreted in isolation