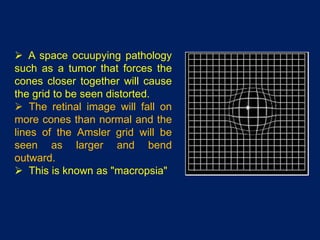
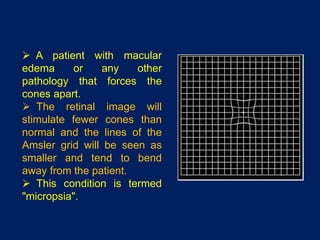
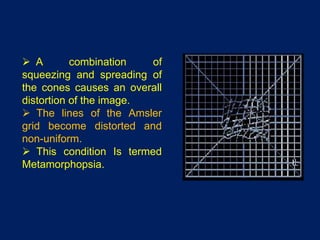
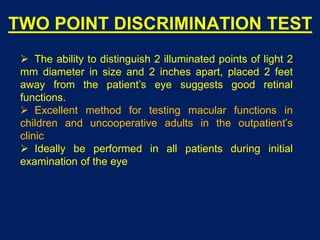
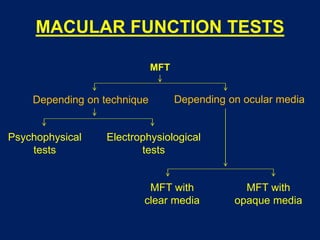
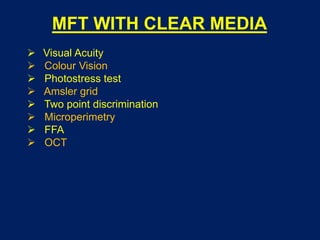
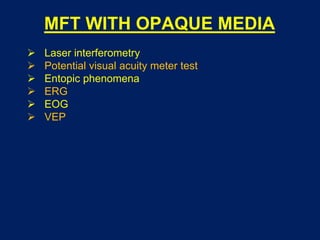
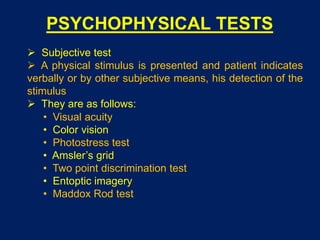
This document discusses various tests used to evaluate macular function, including psychophysical and electrophysiological tests. Psychophysical tests include visual acuity tests, Amsler grid, photostress testing, and two-point discrimination. Electrophysiological tests include ERG, EOG, and VEP. Special tests are used to evaluate macular function in eyes with opaque media, such as laser interferometry, potential visual acuity meter, and entoptic phenomena observation. Microperimetry allows precise correlation of retinal sensitivity with fundus details. No single test evaluates all aspects of macular function, so multiple tests are often used.
This presentation gives a brief idea about angle of anterior chamber along with its structures and diagnostic methods to grade and visualize the structures.
MACULAR FUNCTION TEST PRESENTATION VERY IMPVidhiMadrecha
The macular function test is very important test... To understand the maula dis function and amount of disfunction. It is very useful for Central and colour vision.
MANAGEMENT OF ATRIOVENTRICULAR CONDUCTION BLOCK.pdfJim Jacob Roy
Cardiac conduction defects can occur due to various causes.
Atrioventricular conduction blocks ( AV blocks ) are classified into 3 types.
This document describes the acute management of AV block.
Flu Vaccine Alert in Bangalore Karnatakaaddon Scans
As flu season approaches, health officials in Bangalore, Karnataka, are urging residents to get their flu vaccinations. The seasonal flu, while common, can lead to severe health complications, particularly for vulnerable populations such as young children, the elderly, and those with underlying health conditions.
Dr. Vidisha Kumari, a leading epidemiologist in Bangalore, emphasizes the importance of getting vaccinated. "The flu vaccine is our best defense against the influenza virus. It not only protects individuals but also helps prevent the spread of the virus in our communities," he says.
This year, the flu season is expected to coincide with a potential increase in other respiratory illnesses. The Karnataka Health Department has launched an awareness campaign highlighting the significance of flu vaccinations. They have set up multiple vaccination centers across Bangalore, making it convenient for residents to receive their shots.
To encourage widespread vaccination, the government is also collaborating with local schools, workplaces, and community centers to facilitate vaccination drives. Special attention is being given to ensuring that the vaccine is accessible to all, including marginalized communities who may have limited access to healthcare.
Residents are reminded that the flu vaccine is safe and effective. Common side effects are mild and may include soreness at the injection site, mild fever, or muscle aches. These side effects are generally short-lived and far less severe than the flu itself.
Healthcare providers are also stressing the importance of continuing COVID-19 precautions. Wearing masks, practicing good hand hygiene, and maintaining social distancing are still crucial, especially in crowded places.
Protect yourself and your loved ones by getting vaccinated. Together, we can help keep Bangalore healthy and safe this flu season. For more information on vaccination centers and schedules, residents can visit the Karnataka Health Department’s official website or follow their social media pages.
Stay informed, stay safe, and get your flu shot today!
Title: Sense of Smell
Presenter: Dr. Faiza, Assistant Professor of Physiology
Qualifications:
MBBS (Best Graduate, AIMC Lahore)
FCPS Physiology
ICMT, CHPE, DHPE (STMU)
MPH (GC University, Faisalabad)
MBA (Virtual University of Pakistan)
Learning Objectives:
Describe the primary categories of smells and the concept of odor blindness.
Explain the structure and location of the olfactory membrane and mucosa, including the types and roles of cells involved in olfaction.
Describe the pathway and mechanisms of olfactory signal transmission from the olfactory receptors to the brain.
Illustrate the biochemical cascade triggered by odorant binding to olfactory receptors, including the role of G-proteins and second messengers in generating an action potential.
Identify different types of olfactory disorders such as anosmia, hyposmia, hyperosmia, and dysosmia, including their potential causes.
Key Topics:
Olfactory Genes:
3% of the human genome accounts for olfactory genes.
400 genes for odorant receptors.
Olfactory Membrane:
Located in the superior part of the nasal cavity.
Medially: Folds downward along the superior septum.
Laterally: Folds over the superior turbinate and upper surface of the middle turbinate.
Total surface area: 5-10 square centimeters.
Olfactory Mucosa:
Olfactory Cells: Bipolar nerve cells derived from the CNS (100 million), with 4-25 olfactory cilia per cell.
Sustentacular Cells: Produce mucus and maintain ionic and molecular environment.
Basal Cells: Replace worn-out olfactory cells with an average lifespan of 1-2 months.
Bowman’s Gland: Secretes mucus.
Stimulation of Olfactory Cells:
Odorant dissolves in mucus and attaches to receptors on olfactory cilia.
Involves a cascade effect through G-proteins and second messengers, leading to depolarization and action potential generation in the olfactory nerve.
Quality of a Good Odorant:
Small (3-20 Carbon atoms), volatile, water-soluble, and lipid-soluble.
Facilitated by odorant-binding proteins in mucus.
Membrane Potential and Action Potential:
Resting membrane potential: -55mV.
Action potential frequency in the olfactory nerve increases with odorant strength.
Adaptation Towards the Sense of Smell:
Rapid adaptation within the first second, with further slow adaptation.
Psychological adaptation greater than receptor adaptation, involving feedback inhibition from the central nervous system.
Primary Sensations of Smell:
Camphoraceous, Musky, Floral, Pepperminty, Ethereal, Pungent, Putrid.
Odor Detection Threshold:
Examples: Hydrogen sulfide (0.0005 ppm), Methyl-mercaptan (0.002 ppm).
Some toxic substances are odorless at lethal concentrations.
Characteristics of Smell:
Odor blindness for single substances due to lack of appropriate receptor protein.
Behavioral and emotional influences of smell.
Transmission of Olfactory Signals:
From olfactory cells to glomeruli in the olfactory bulb, involving lateral inhibition.
Primitive, less old, and new olfactory systems with different path
Title: Sense of Taste
Presenter: Dr. Faiza, Assistant Professor of Physiology
Qualifications:
MBBS (Best Graduate, AIMC Lahore)
FCPS Physiology
ICMT, CHPE, DHPE (STMU)
MPH (GC University, Faisalabad)
MBA (Virtual University of Pakistan)
Learning Objectives:
Describe the structure and function of taste buds.
Describe the relationship between the taste threshold and taste index of common substances.
Explain the chemical basis and signal transduction of taste perception for each type of primary taste sensation.
Recognize different abnormalities of taste perception and their causes.
Key Topics:
Significance of Taste Sensation:
Differentiation between pleasant and harmful food
Influence on behavior
Selection of food based on metabolic needs
Receptors of Taste:
Taste buds on the tongue
Influence of sense of smell, texture of food, and pain stimulation (e.g., by pepper)
Primary and Secondary Taste Sensations:
Primary taste sensations: Sweet, Sour, Salty, Bitter, Umami
Chemical basis and signal transduction mechanisms for each taste
Taste Threshold and Index:
Taste threshold values for Sweet (sucrose), Salty (NaCl), Sour (HCl), and Bitter (Quinine)
Taste index relationship: Inversely proportional to taste threshold
Taste Blindness:
Inability to taste certain substances, particularly thiourea compounds
Example: Phenylthiocarbamide
Structure and Function of Taste Buds:
Composition: Epithelial cells, Sustentacular/Supporting cells, Taste cells, Basal cells
Features: Taste pores, Taste hairs/microvilli, and Taste nerve fibers
Location of Taste Buds:
Found in papillae of the tongue (Fungiform, Circumvallate, Foliate)
Also present on the palate, tonsillar pillars, epiglottis, and proximal esophagus
Mechanism of Taste Stimulation:
Interaction of taste substances with receptors on microvilli
Signal transduction pathways for Umami, Sweet, Bitter, Sour, and Salty tastes
Taste Sensitivity and Adaptation:
Decrease in sensitivity with age
Rapid adaptation of taste sensation
Role of Saliva in Taste:
Dissolution of tastants to reach receptors
Washing away the stimulus
Taste Preferences and Aversions:
Mechanisms behind taste preference and aversion
Influence of receptors and neural pathways
Impact of Sensory Nerve Damage:
Degeneration of taste buds if the sensory nerve fiber is cut
Abnormalities of Taste Detection:
Conditions: Ageusia, Hypogeusia, Dysgeusia (parageusia)
Causes: Nerve damage, neurological disorders, infections, poor oral hygiene, adverse drug effects, deficiencies, aging, tobacco use, altered neurotransmitter levels
Neurotransmitters and Taste Threshold:
Effects of serotonin (5-HT) and norepinephrine (NE) on taste sensitivity
Supertasters:
25% of the population with heightened sensitivity to taste, especially bitterness
Increased number of fungiform papillae
Ethanol (CH3CH2OH), or beverage alcohol, is a two-carbon alcohol
that is rapidly distributed in the body and brain. Ethanol alters many
neurochemical systems and has rewarding and addictive properties. It
is the oldest recreational drug and likely contributes to more morbidity,
mortality, and public health costs than all illicit drugs combined. The
5th edition of the Diagnostic and Statistical Manual of Mental Disorders
(DSM-5) integrates alcohol abuse and alcohol dependence into a single
disorder called alcohol use disorder (AUD), with mild, moderate,
and severe subclassifications (American Psychiatric Association, 2013).
In the DSM-5, all types of substance abuse and dependence have been
combined into a single substance use disorder (SUD) on a continuum
from mild to severe. A diagnosis of AUD requires that at least two of
the 11 DSM-5 behaviors be present within a 12-month period (mild
AUD: 2–3 criteria; moderate AUD: 4–5 criteria; severe AUD: 6–11 criteria).
The four main behavioral effects of AUD are impaired control over
drinking, negative social consequences, risky use, and altered physiological
effects (tolerance, withdrawal). This chapter presents an overview
of the prevalence and harmful consequences of AUD in the U.S.,
the systemic nature of the disease, neurocircuitry and stages of AUD,
comorbidities, fetal alcohol spectrum disorders, genetic risk factors, and
pharmacotherapies for AUD.
The prostate is an exocrine gland of the male mammalian reproductive system
It is a walnut-sized gland that forms part of the male reproductive system and is located in front of the rectum and just below the urinary bladder
Function is to store and secrete a clear, slightly alkaline fluid that constitutes 10-30% of the volume of the seminal fluid that along with the spermatozoa, constitutes semen
A healthy human prostate measures (4cm-vertical, by 3cm-horizontal, 2cm ant-post ).
It surrounds the urethra just below the urinary bladder. It has anterior, median, posterior and two lateral lobes
It’s work is regulated by androgens which are responsible for male sex characteristics
Generalised disease of the prostate due to hormonal derangement which leads to non malignant enlargement of the gland (increase in the number of epithelial cells and stromal tissue)to cause compression of the urethra leading to symptoms (LUTS
These lecture slides, by Dr Sidra Arshad, offer a quick overview of physiological basis of a normal electrocardiogram.
Learning objectives:
1. Define an electrocardiogram (ECG) and electrocardiography
2. Describe how dipoles generated by the heart produce the waveforms of the ECG
3. Describe the components of a normal electrocardiogram of a typical bipolar leads (limb II)
4. Differentiate between intervals and segments
5. Enlist some common indications for obtaining an ECG
Study Resources:
1. Chapter 11, Guyton and Hall Textbook of Medical Physiology, 14th edition
2. Chapter 9, Human Physiology - From Cells to Systems, Lauralee Sherwood, 9th edition
3. Chapter 29, Ganong’s Review of Medical Physiology, 26th edition
4. Electrocardiogram, StatPearls - https://www.ncbi.nlm.nih.gov/books/NBK549803/
5. ECG in Medical Practice by ABM Abdullah, 4th edition
6. ECG Basics, http://www.nataliescasebook.com/tag/e-c-g-basics
Factory Supply Best Quality Pmk Oil CAS 28578–16–7 PMK Powder in Stockrebeccabio
Factory Supply Best Quality Pmk Oil CAS 28578–16–7 PMK Powder in Stock
Telegram: bmksupplier
signal: +85264872720
threema: TUD4A6YC
You can contact me on Telegram or Threema
Communicate promptly and reply
Free of customs clearance, Double Clearance 100% pass delivery to USA, Canada, Spain, Germany, Netherland, Poland, Italy, Sweden, UK, Czech Republic, Australia, Mexico, Russia, Ukraine, Kazakhstan.Door to door service
Hot Selling Organic intermediates
Ozempic: Preoperative Management of Patients on GLP-1 Receptor Agonists Saeid Safari
Preoperative Management of Patients on GLP-1 Receptor Agonists like Ozempic and Semiglutide
ASA GUIDELINE
NYSORA Guideline
2 Case Reports of Gastric Ultrasound
micro teaching on communication m.sc nursing.pdfAnurag Sharma
Microteaching is a unique model of practice teaching. It is a viable instrument for the. desired change in the teaching behavior or the behavior potential which, in specified types of real. classroom situations, tends to facilitate the achievement of specified types of objectives.
2. SCOPE
Macular function tests - uses and classification
Photostress test
Amsler grid
Two point discrimination test
Maddox rod test
Entoptic phenomena
Laser Interferometry
Microperimetry
3. MACULAR FUNCTION TESTS
Uses:
• For diagnosing
• For follow up of macular diseases
• For evaluating the potential macular function in eyes
with opaque media such as cataract and dense vitreous
hemorrhage.
• As a prelude to surgery, in order to provide a
preoperative prognosis for the condition.
4. CLINICAL ASSESSMENT
OF THE MACULA
Symptoms:
• Blurred vision and difficulty with close work
• Scotoma
• Metamorphopsia (distortion of perceived images)
• Micropsia (decrease in image size)
• Macropsia (increase in image size)
• Colour discrimination may be disturbed, but is generally
less evident than in even relatively mild optic neuropathy.
• Difficulties related to dark adaptation, such as poor vision
in dim light and persistence of after-images
5. MACULAR FUNCTION TESTS
MFT
MFT with
clear media
MFT with
opaque media
Depending on ocular media
Electrophysiological
tests
Psychophysical
tests
Depending on technique
6. MFT WITH CLEAR MEDIA
Visual Acuity
Colour Vision
Photostress test
Amsler grid
Two point discrimination
Microperimetry
FFA
OCT
7. MFT WITH OPAQUE MEDIA
Laser interferometry
Potential visual acuity meter test
Entopic phenomena
ERG
EOG
VEP
8. PSYCHOPHYSICAL TESTS
Subjective test
A physical stimulus is presented and patient indicates
verbally or by other subjective means, his detection of the
stimulus
They are as follows:
• Visual acuity
• Color vision
• Photostress test
• Amsler’s grid
• Two point discrimination test
• Entoptic imagery
• Maddox Rod test
9. ELECTROPHYSIOLOGICAL TESTS
Objective tests
A stimulus is presented and a response parameter is
measured by electrophysiological means
One of the most effective modes of testing for macular
functions in eyes with total media opacities
They are as follows:
• Electroretinogram (ERG)
• Electrooculogram (EOG)
• Visual evoked potential (VEP)
10. PHOTOSTRESS TEST
Differentiates visual loss caused by macular disease
from that caused by an optic nerve lesion
Principle:
• The visual pigments are bleached by light which
causes a temporary state of retinal insensitivity,
perceived by the patient as a scotoma.
• The recovery of vision is dependent on the ability of
the photoreceptors to re-synthesize visual pigments.
11. The test is performed as follows:
• BCVA is determined
• Pt is asked to fixate on the light of a pen torch or an
indirect ophthalmoscope held about 3 cm away for
about 10 seconds.
• Photostress recovery time (PSRT) is measured by
the time taken to read any 03 letters of the pre-test
acuity line.
• Test is performed on the other, presumably normal
eye and the results are compared.
• In a patient with macular lesion, the PSRT will be
longer (50 seconds or more) as compared with the
normal eye whereas in a patient with an optic nerve
lesion there will be no difference.
12. AMSLER GRID
The grid was developed by Marc Amsler, a Swiss
ophthalmologist.
It is a grid of horizontal and vertical lines used to
evaluate the 20 degrees of visual field centered on fixation.
There are 07 charts, each chart consisting of 10 cm
square.
It is a diagnostic tool that aids in the detection of visual
disturbances caused by changes in the retina, particularly
the macula as well as the optic nerve and the visual
pathway to the brain.
Presence of abnormalities like blurred areas, holes,
distortions, or blank spots are noted
13. Chart 1
• First grid is standard grid that tests for any general
subjective patient responses to faults or distortions in
the pattern.
• White lines on a black background and a central white
dot on which the patient fixates.
• Grid encloses 400 small squares, each square
measures 5 mm
• When grid is held at 30 cm from the patient, each
square subtends 1 degree on the retina.
• If pt reports on the first chart that
he cannot see the central white spot,
this indicates a scotoma.
14. Chart 2
• This chart has diagonal lines which help maintain
central fixation.
• If pt reports on the first chart that he cannot see the
central white spot, this indicates a positive scotoma.
• This helps them point out the limits of the scotoma.
Chart 3
• It has red lines on a black background
• Helpful in detecting color scotomas and
desaturation, that may occur in optic nerve, chiasmal or
toxic amblyopia related problems.
15. Chart 4
• This chart comprises random dots only
• used to differentiate scotoma from metamorphopsia
Chart 5
• This chart has horizontal lines
• helps detect metamorphopsia along specific meridians
16. Chart 6
• This chart is similar to chart 5 but has white
background and central lines are oriented closer for
detailed evaluation
Chart 7
• This chart has fine central grid
• Each square subtends an angle of half a degree
when the chart is held at 30 cm from the patient
17. Central scotoma as
seen by a patient
For example this
might be secondary to
central areolar choroidal
dystrophy or congenital
toxoplasmosis .
18. A space ocuupying pathology
such as a tumor that forces the
cones closer together will cause
the grid to be seen distorted.
The retinal image will fall on
more cones than normal and the
lines of the Amsler grid will be
seen as larger and bend
outward.
This is known as "macropsia"
19. A patient with macular
edema or any other
pathology that forces the
cones apart.
The retinal image will
stimulate fewer cones than
normal and the lines of the
Amsler grid will be seen as
smaller and tend to bend
away from the patient.
This condition is termed
"micropsia".
20. A combination of
squeezing and spreading of
the cones causes an overall
distortion of the image.
The lines of the Amsler
grid become distorted and
non-uniform.
This condition Is termed
Metamorphopsia.
21. TWO POINT DISCRIMINATION TEST
The ability to distinguish 2 illuminated points of light 2
mm diameter in size and 2 inches apart, placed 2 feet
away from the patient’s eye suggests good retinal
functions.
Excellent method for testing macular functions in
children and uncooperative adults in the outpatient’s
clinic
Ideally be performed in all patients during initial
examination of the eye
22. MADDOX ROD TEST
It is a high power cylindrical lens used to form a line
image perpendicular to the axis of the parallel cylinders
from a point source of light.
The light source placed between 33 cm to 40 cm in front
of each eye to get appropriate objective results.
Any breaks/ holes; discoloration/ distortion in this line
indicates a macular lesion
This is a very sensitive test that can be performed in the
outpatient clinic without requirement of any specific
equipment.
23. ENTOPTIC PHENOMENON
Entoptic phenomenon is referred to visual perceptions
that are produced or influenced by the native structures of
one’s own eye.
Illumination of the fundus by parallel light rays allows
visualization of small opacities located close to the retina.
Since the columns of blood contained within retinal
blood vessels are linear opacities situated in front of the
retinal photoreceptors, this makes retinal blood vessels
visible.
If a focal source of light (such as small penlight) is
pressed firmly against the exterior of the eye through
closed lids, the arborizing pattern of retinal blood vessels
can be briefly made visible. This test is used as test of
retinal function.
25. The blue field entoptic phenomenon (flying spots)
perception is performed in the following manner:
• If one looks at a bright and diffusely illuminated surface
with no contrasting features, a series of fast moving,
luminous points are seen which tend to move in a generally
curved pattern, with trailing short, tapering segments behind
them.
• The spots are best seen if the background is illuminated
by blue light in the spectral region of 350 to 450 nm.
• Since this region contains the spectral absorption peak of
hemoglobin, the moving particles represent red blood cells
passing through the retinal capillaries.
• Normally - 15 or more of moving corpuscles are seen.
• Abnormal blue field entoptic phenomenon - failure to see
any corpuscles or partial loss of corpuscles in one part of
the field, visibility of less number of corpuscles and slow
corpuscular movement.
26. HAIDINGER’S BRUSHES
If one views a diffusely illuminated source of plane
polarized white or blue light, brushes radiating from the
point of fixation in the form of Maltese cross can be seen.
The brushes have contrasting yellow and blue hues.
The darker portions of the Maltese pattern are yellow,
whereas the brighter portions are blue.
27. This phenomenon is caused by variations in
absorption of plane polarized light by oriented molecules
of xanthophyll pigment in the foveal retina.
If the yellow pigment arrangement in the fovea is
disrupted by pathology in the inner retinal layers, the
brushes will not be seen.
Commonly used as a screening test for retinal
pathology in strabismus patients with amblyopia.
28. LASER INTERFEROMETRY
The resolving power of the macula is tested by using two
coherent beams of light, which create a three-dimensional
fringe pattern on the retina.
The beams produce two point sources behind the lens
opacity; the light waves emitted from these two points
overlap.
Where the crest of one wave overlaps the trough of the
other, the effect is cancelled and a black band is produced.
Where crests or troughs coincide with one another, the
enhancement produces bright bands of light.
Laser interferometry can thus be used in eyes with
immature cataracts.
29. The test is performed as follows:
• Pupils are widely dilated and light beam is directed into
the centre of the pupil in the plane of the iris.
• The pupil is scanned until the fringe pattern is seen and
patient indicates the orientation of the bands of light.
• Initially, large gratings are used and then gradually
diminished until patient is unable to detect correct
orientation
• The potential visual acuity is estimated from the width of
the gratings resolved.
• Laser generated fringes are not dependent on the optical
components of the eye for focusing. Therefore, ametropia
has little influence on the patterns produced by retina.
• It also over-predicts the visual potential in amblyopic
eyes because laser fringe vision is better than the letter
acuity.
30. POTENTIAL VISUAL ACUITY
METER
The potential acuity meter (PAM) projects standard
Snellen chart through a small clear area of an immature
cataract
Main components of PAM are a bright light source,
miniature transilluminated Snellen chart and a +12D lens.
Most accurate with visual acuities of 6/60 or better.
In performing the test, the pupils should be
widely dilated and the patient is asked to read
the letters on the chart and the level recorded.
31. MICROPERIMETRY
Also k/as fundus perimetry, it allows for exact
topographic correlation between fundus details and its light
sensitivity.
The principle rests on the possibility to see, in real time,
the retina under examination (by infrared light) and to
project a defined light stimulus over an individually selected
location.
Because light projection is just related to previously
selected anatomical landmarks and is independent of
fixation and any other eye movement, the examiner obtains
the functional response of the selected area.
The characteristics of fixation (location and stability) are
easily and exactly quantified with microperimetry.
32. Automatic follow-up examination quantifies retinal
threshold exactly over the same retinal points tested during
baseline examination (even if fixation changes during
follow-up time).
Static microperimetry is more commonly used, but a
kinetic test is also available.
33. CONCLUSION
Evaluation of the macular function of a patient with
opaque media is a commonly faced challenging problem
No single test is impeccable