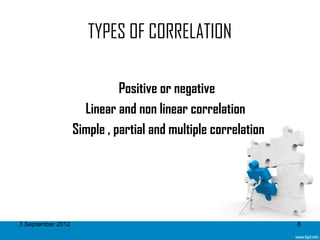
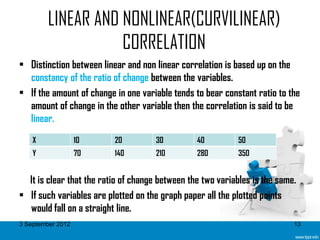
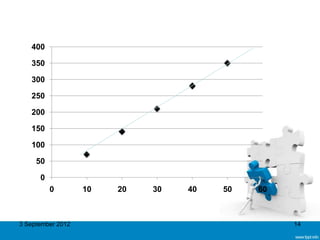
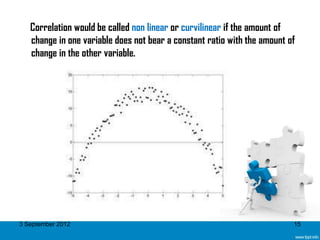
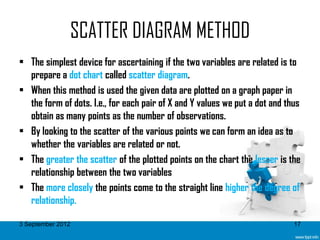
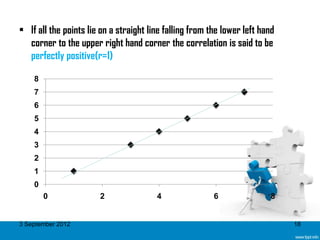
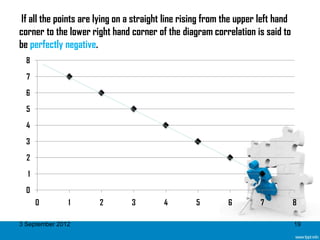
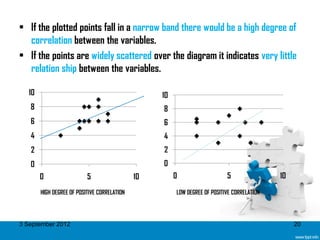
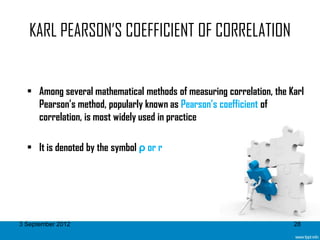
SlideShare a Scribd company logo
CORRELATION
                     (LINEAR)


3 September 2012                 1
CORRELATION
 If two quantities vary in such a way that movements of one are
  accompanied by movements of others then these quantities are said to
  be correlated.
 Ex: relationship between price of commodity and amount demanded,
  Increased in amount of the rainfall and the production of rice
 The degree of relationship between variables under consideration is
  measured through the correlation analysis.
 The measure of correlation is called the correlation coefficient or
  correlation index ( usually denoted by r or ρ )
 The correlation analysis refers to the techniques used in measuring the
  closeness of the relationship between the variables.

3 September 2012                                                            2
DEFINITIONS
• Correlation analysis deals with the association between two or more
  variables.
                                                  Simpson and Kafka
• Correlation is an analysis of co variation between two or more variables.

                                                   A.M.Tuttle
• If two or more quantities were in sympathy so that the movement of one
  tend to be accompanied by the corresponding movements in the other
  then they are said to be correlated
                                                   L.R.Conner

3 September 2012                                                              3
ANALYSIS

• The problem of analyzing the relation between different series should be
  broken down in to three steps

      1. Determining whether a relation exists and if it does, measuring it.
      2. Testing whether it is significant.
      3. Establishing the cause and effect relation if any.


3 September 2012                                                               4
SIGNIFICANCE OF THE STUDY OF CORRELATION

 Most of the variables show some kind of relationship

 Once we know that two variables are closely related we can estimate
  the value of one variable given the value of another.

 Correlation analysis contributes to the understanding of the economic
  behavior

      The effect of correlation is to reduce the range of uncertainty


3 September 2012                                                          5
CORRELATION AND CAUSATION
1. The correlation may be due to pure chance especially in a small sample.


    Income(rs)     500    600         700         800        900
    Weight(lbs)    120    140         160         180        200


   The above data show a perfect positive relationship between income and
   weight i.e., as the income is increasing the weight is increasing and the
   rate of change between two variables is the same.


3 September 2012                                                               6
2. Both the correlated variables may be influenced by one or more other
   variables.

3. Both the variables may be mututally influencing each other so that neither
   can be designated as the cause and the other the effect.

    Correlation observed between variables that cannot conceivably be
    casually related is called spurious or nonsense correlation


3 September 2012                                                            7
TYPES OF CORRELATION

                             Positive or negative
                     Linear and non linear correlation
                   Simple , partial and multiple correlation


3 September 2012                                               8
POSITIVE OR NEGATIVE CORRELATION
• Whether the correlation is positive or negative would depend up on the
  direction of the change of the variable.

• If both the variables are varying in the same direction , then the
  correlation is said to be positive.

• If the variables are varying in opposite direction the correlation is said to
  be negative


3 September 2012                                                              9
Positive correlation
   X               10       12        15         18        20
   Y               15       20        22         25        37

                                 Y-Values
   40
   35
   30
   25
   20
   15
   10
    5
    0
        0               5        10         15        20        25

3 September 2012                                                     10
Negative correlation
    X              20        30        40         60        80
    Y              40        30        22         15        10

                                  Y-Values
   45
   40
   35
   30
   25
   20
   15
   10
    5
    0
        0               20        40         60        80        100
3 September 2012                                                       11
SIMPLE PARTIAL AND MULTIPLE CORRELATION
• The distinction between simple partial and multiple correlation is based
  up on the number of variables studied.
• When only two variables are studied it is a problem of simple correlation
• When three or more variable are studied it is problem of either multiple
  or partial correlation.
• In multiple correlation three or more variables are studied
  simultaneously.
• On the other hand in partial correlation we recognize more than two
  variables but consider only two variables to be influencing each other the
  effect of other influencing variable kept constant.

3 September 2012                                                          12
LINEAR AND NONLINEAR(CURVILINEAR)
                    CORRELATION
• Distinction between linear and non linear correlation is based up on the
  constancy of the ratio of change between the variables.
• If the amount of change in one variable tends to bear constant ratio to the
  amount of change in the other variable then the correlation is said to be
  linear.
    X              10     20          30         40         50
    Y              70     140         210        280        350


  It is clear that the ratio of change between the two variables is the same.
• If such variables are plotted on the graph paper all the plotted points
  would fall on a straight line.
3 September 2012                                                            13
400

   350

   300

   250

   200

   150

   100

     50

      0
          0        10   20   30   40   50   60


3 September 2012                                 14
Correlation would be called non linear or curvilinear if the amount of
   change in one variable does not bear a constant ratio with the amount of
   change in the other variable.


3 September 2012                                                          15
METHODS OF STUDYING CORRELATION

              1. Scatter diagram
              2. Graphic method
              3. Karl Pearson’s coefficient of correlation.
              4. Concurrent Deviation Method
              5. Method of least squares


3 September 2012                                              16
SCATTER DIAGRAM METHOD
• The simplest device for ascertaining if the two variables are related is to
  prepare a dot chart called scatter diagram.
• When this method is used the given data are plotted on a graph paper in
  the form of dots. I.e., for each pair of X and Y values we put a dot and thus
  obtain as many points as the number of observations.
• By looking to the scatter of the various points we can form an idea as to
  whether the variables are related or not.
• The greater the scatter of the plotted points on the chart the lesser is the
  relationship between the two variables
• The more closely the points come to the straight line higher the degree of
  relationship.

3 September 2012                                                             17
• If all the points lie on a straight line falling from the lower left hand
  corner to the upper right hand corner the correlation is said to be
  perfectly positive(r=1)

    8
    7
    6
    5
    4
    3
    2
    1
    0
        0              2                4                6               8


3 September 2012                                                              18
If all the points are lying on a straight line rising from the upper left hand
corner to the lower right hand corner of the diagram correlation is said to
be perfectly negative.
  8

  7

  6

  5

  4

  3

  2

  1

  0
      0        1       2        3         4        5        6         7           8

3 September 2012                                                                  19
• If the plotted points fall in a narrow band there would be a high degree of
  correlation between the variables.
• If the points are widely scattered over the diagram it indicates very little
  relation ship between the variables.

   10                                              10
   8                                               8
   6                                               6
   4                                               4
   2                                               2
   0                                               0
        0                  5                  10        0                   5                10

        HIGH DEGREE OF POSITIVE CORRELATION             LOW DEGREE OF POSITIVE CORRELATION


3 September 2012                                                                                  20
If the plotted points lie in a haphazard manner it shows the absence of any
  relationship between the variables

     8
     7
     6
     5
     4
     3
     2
      1
     0
          0        2     4        6         8        10       12       14


3 September 2012                                                            21
EXAMPLE:
       X            2       3        5       6       8
       Y            6       5        7       8       12

           14
           12
           10
           8
           6
           4
           2
           0
                0       2        4       6       8        10
3 September 2012                                               22
• By looking at the scattered diagram we can say that the variables x and y
  are correlated. Further the correlation is positive because the trend of
  the points is upward rising from the lower left hand corner to the upper
  right hand corner of the diagram.

• It also indicates that the degree of relationship is higher because the
  plotted points are near to the line which shows perfect relationship
  between the variables.


3 September 2012                                                            23
MERITS AND LIMITATIONS
MERITS
• It is a simple and non mathematical method of studying correlation
   between variables.
• As such it can be easily understood and a rough idea can very quickly be
   formed as to whether or the variables are related.
• It is the first step in investigating relationship between 2 variables.
LIMITATIONS:
• By applying this method we can get an idea about the direction of
   correlation and also whether it is high or low
• But we cannot establish the exact degree of correlation between the
   variables as is possible by applying the mathematical methods.

3 September 2012                                                         24
GRAPHIC METHOD
• When this method is used the individual values of the two variables are
  plotted on the graph paper.
• We thus obtain 2 curves. One for x variable and another for y variable.
• By examining the direction and closeness of the two curves so drawn we
  can infer if the variables are related or not.
• If both the curves drawn on the graph are moving in the same direction
  (either upward or downward)then the correlation is said to be positive.
• On the other hand if the curves are moving in the opposite direction
  correlation is said to be negative.


3 September 2012                                                        25
Year     Average income   Average
                                    expenditure
          1979     100              90

          1980     102              91

          1981     105              93

          1982     105              95

          1983     101              92

          1984     112              94


3 September 2012                                  26
120
                                          INCOME
   100
                                 EXPENDITURE
   80

   60                                                        Series 1
                                                             Series 2
   40

   20

    0
           1979    1980   1981     1982        1983   1984


3 September 2012                                                        27
KARL PEARSON’S COEFFICIENT OF CORRELATION


  • Among several mathematical methods of measuring correlation, the Karl
    Pearson’s method, popularly known as Pearson’s coefficient of
    correlation, is most widely used in practice

  • It is denoted by the symbol ρ or r


3 September 2012                                                      28
CORRELATION COEFFICIENT
• If [X,Y] is a two dimensional random variable, the correlation coefficient, denoted
   r, is
                   ρ=Cov(X,Y) ∕ Var(X) . Var(Y)          = σXY ∕ σX σY

• This is also called as PEARSON CORRELATION COEFFICIENT

                     ρ= ∑xy ∕ √ (∑x2 * ∑y2) = ∑xy ∕ N σX σY               , where

                     x=(X-X’) ; y=(Y-Y’)
                     σX = Standard Deviation of X and
                     σY = Standard Deviation of Y
                     N = no of pairs of observation
3 September 2012     ρ = correlation coefficient                                    29
STEPS TO CALCULATE CORRELATION COEFFICIENT
• Take the deviations of X from the mean of X and denote by x

• Square these deviations and obtain the total i.e., Σx2

• Take the deviations of Y from the mean of Y and denote by y

• Square these deviations and obtain the total i.e., Σy2

• Multiply the deviations of X and Y and obtain the total i.e., Σxy

• Substitute the values in the formula
3 September 2012                                                      30
EXAMPLE
• Calculate the Karl Pearson’s Correlation Coefficient from the following
  data and interpret it’s value
   Roll no of students:       1  2         3        4        5
   Marks in Accountancy : 48 35            17       23       47
   Marks in Statistics:      45 20         40       25       45

SOLUTION:
    Let marks in Accountancy be denoted by X and Statistics by Y


3 September 2012                                                            31
Roll no        X      (X-34)   x2         Y     (Y-35)      y2        xy
                        x                         y
   1          48       14      196       45      10        100      140


   2          35        1      1         20      -15       225      -15


    3         17        -17    289       40      5         25       -85


    4         23        -11    121       25      -10       100       110


    5         47        13      169      45      10        100       130


             ∑X=170    ∑x=0    ∑x2=776 ∑Y=175   ∑y=0     ∑y2=550   ∑xy=280


3 September 2012                                                           32
• The Pearson’s coefficient of correlation is
                   ρ= ∑xy ∕ √(∑x2 *∑y2)
             where x=(X-X’); y=(Y-Y’) , X'= ∑X ∕ N; Y’=∑Y ∕ N

           ∑xy=280 ∑x2=776        ∑y2=550

           ρ = 280 ∕ √ (776 * 550)
             = 0.496


3 September 2012                                                33
DEGREE OF CORRELATION
• The value of ρ always lies between -1 and 1.

• If ρ lies between 0 and 1, it is positive. Else, if it lies between -1 and 0, it is
  negative

• If ρ=1, then the two variables are said to be perfect positively correlated

• If ρ=-1, then the two variables are said to be perfect negatively
  correlated

• If ρ=0, then the two variables are not correlated
3 September 2012                                                                  34
3 September 2012   35

More Related Content

What's hot

Linear Correlation
Linear Correlation Linear Correlation
Linear Correlation
Tarek Tawfik Amin
 
correlation and regression
correlation and regressioncorrelation and regression
correlation and regression
Unsa Shakir
 
Skewness & Kurtosis
Skewness & KurtosisSkewness & Kurtosis
Skewness & KurtosisNavin Bafna
 
Simple linear regression (final)
Simple linear regression (final)Simple linear regression (final)
Simple linear regression (final)Harsh Upadhyay
 
Correlation analysis
Correlation analysis Correlation analysis
Correlation analysis
Misab P.T
 
Correlation and regression
Correlation and regressionCorrelation and regression
Correlation and regression
Mohit Asija
 
Correlation Analysis
Correlation AnalysisCorrelation Analysis
Correlation Analysis
Birinder Singh Gulati
 
Regression analysis ppt
Regression analysis pptRegression analysis ppt
Regression analysis pptElkana Rorio
 
What is a partial correlation?
What is a partial correlation?What is a partial correlation?
What is a partial correlation?
Ken Plummer
 
Partial correlation
Partial correlationPartial correlation
Partial correlation
DwaitiRoy
 
Skewness
SkewnessSkewness
Skewness
Raj Teotia
 
Multiple Correlation - Thiyagu
Multiple Correlation - ThiyaguMultiple Correlation - Thiyagu
Multiple Correlation - Thiyagu
Thiyagu K
 
Correlation and Regression
Correlation and RegressionCorrelation and Regression
Correlation and Regression
Sir Parashurambhau College, Pune
 
Skewness.ppt
Skewness.pptSkewness.ppt
Skewness.ppt
KrishnaVamsiMuthinen
 
F test and ANOVA
F test and ANOVAF test and ANOVA
F test and ANOVA
MEENURANJI
 
Normal distribution
Normal distributionNormal distribution
Normal distribution
SonamWadhwa3
 

What's hot (20)

Correlation ppt...
Correlation ppt...Correlation ppt...
Correlation ppt...
 
Linear Correlation
Linear Correlation Linear Correlation
Linear Correlation
 
correlation and regression
correlation and regressioncorrelation and regression
correlation and regression
 
Skewness & Kurtosis
Skewness & KurtosisSkewness & Kurtosis
Skewness & Kurtosis
 
Correlation analysis
Correlation analysisCorrelation analysis
Correlation analysis
 
Simple linear regression (final)
Simple linear regression (final)Simple linear regression (final)
Simple linear regression (final)
 
Correlation analysis
Correlation analysis Correlation analysis
Correlation analysis
 
PEARSON'CORRELATION
PEARSON'CORRELATION PEARSON'CORRELATION
PEARSON'CORRELATION
 
Correlation and regression
Correlation and regressionCorrelation and regression
Correlation and regression
 
Correlation Analysis
Correlation AnalysisCorrelation Analysis
Correlation Analysis
 
Regression analysis ppt
Regression analysis pptRegression analysis ppt
Regression analysis ppt
 
What is a partial correlation?
What is a partial correlation?What is a partial correlation?
What is a partial correlation?
 
Partial correlation
Partial correlationPartial correlation
Partial correlation
 
Regression
RegressionRegression
Regression
 
Skewness
SkewnessSkewness
Skewness
 
Multiple Correlation - Thiyagu
Multiple Correlation - ThiyaguMultiple Correlation - Thiyagu
Multiple Correlation - Thiyagu
 
Correlation and Regression
Correlation and RegressionCorrelation and Regression
Correlation and Regression
 
Skewness.ppt
Skewness.pptSkewness.ppt
Skewness.ppt
 
F test and ANOVA
F test and ANOVAF test and ANOVA
F test and ANOVA
 
Normal distribution
Normal distributionNormal distribution
Normal distribution
 

Viewers also liked

correlation_and_covariance
correlation_and_covariancecorrelation_and_covariance
correlation_and_covarianceEkta Doger
 
Correlation
CorrelationCorrelation
CorrelationTech_MX
 
Student t-test
Student t-testStudent t-test
Student t-test
Steve Bishop
 
Correlation and regression
Correlation and regressionCorrelation and regression
Correlation and regressionKhalid Aziz
 
Tests of significance
Tests of significanceTests of significance
Tests of significance
Shubhanshu Gupta
 
Basic Statistical Concepts and Methods
Basic Statistical Concepts and MethodsBasic Statistical Concepts and Methods
Basic Statistical Concepts and Methods
Ahmed-Refat Refat
 
Regression analysis
Regression analysisRegression analysis
Regression analysisRavi shankar
 

Viewers also liked (9)

correlation_and_covariance
correlation_and_covariancecorrelation_and_covariance
correlation_and_covariance
 
Correlation continued
Correlation continuedCorrelation continued
Correlation continued
 
Stat
StatStat
Stat
 
Correlation
CorrelationCorrelation
Correlation
 
Student t-test
Student t-testStudent t-test
Student t-test
 
Correlation and regression
Correlation and regressionCorrelation and regression
Correlation and regression
 
Tests of significance
Tests of significanceTests of significance
Tests of significance
 
Basic Statistical Concepts and Methods
Basic Statistical Concepts and MethodsBasic Statistical Concepts and Methods
Basic Statistical Concepts and Methods
 
Regression analysis
Regression analysisRegression analysis
Regression analysis
 

Similar to Linear correlation

MCA_UNIT-4_Computer Oriented Numerical Statistical Methods
MCA_UNIT-4_Computer Oriented Numerical Statistical MethodsMCA_UNIT-4_Computer Oriented Numerical Statistical Methods
MCA_UNIT-4_Computer Oriented Numerical Statistical Methods
Rai University
 
correlation and regression
correlation and regressioncorrelation and regression
correlation and regression
Keyur Tejani
 
Correlation and Regression Analysis.pptx
Correlation and Regression Analysis.pptxCorrelation and Regression Analysis.pptx
Correlation and Regression Analysis.pptx
nugaidole
 
Business methmitcs
Business methmitcsBusiness methmitcs
Business methmitcsAltyeb Sayf
 
Business methmitcs
Business methmitcsBusiness methmitcs
Business methmitcsAhmed_Saif
 
correlationandregression1-200905162711.pdf
correlationandregression1-200905162711.pdfcorrelationandregression1-200905162711.pdf
correlationandregression1-200905162711.pdf
MuhammadAftab89
 
Correlation Studies - Descriptive Studies
Correlation Studies - Descriptive StudiesCorrelation Studies - Descriptive Studies
Correlation Studies - Descriptive Studies
SalmaAsghar4
 
correlation and regression.pptx
correlation and regression.pptxcorrelation and regression.pptx
correlation and regression.pptx
vidyasagarsharma0001
 
Correlation analysis
Correlation analysisCorrelation analysis
Correlation analysis
Awais Salman
 
Dependance Technique, Regression & Correlation
Dependance Technique, Regression & Correlation Dependance Technique, Regression & Correlation
Dependance Technique, Regression & Correlation Qasim Raza
 
01 psychological statistics 1
01 psychological statistics 101 psychological statistics 1
01 psychological statistics 1
Noushad Feroke
 
Correlationanalysis
CorrelationanalysisCorrelationanalysis
Correlationanalysis
Libu Thomas
 
Module - 2 correlation and regression.pptx
Module - 2 correlation and regression.pptxModule - 2 correlation and regression.pptx
Module - 2 correlation and regression.pptx
jayvee73
 
Module - 2 correlation and regression.pptx
Module - 2 correlation and regression.pptxModule - 2 correlation and regression.pptx
Module - 2 correlation and regression.pptx
jayvee73
 
CORRELATION.ppt
CORRELATION.pptCORRELATION.ppt
CORRELATION.ppt
sadiakhan783184
 
Correlation and regression
Correlation and regressionCorrelation and regression
Correlation and regression
MOHIT PANCHAL
 
03 correlation analysis
03 correlation analysis03 correlation analysis
03 correlation analysis
Noushad Feroke
 
Simple regressionand correlation (2).pdf
Simple regressionand correlation (2).pdfSimple regressionand correlation (2).pdf
Simple regressionand correlation (2).pdf
yadavrahulrahul799
 
Correlation.pptx
Correlation.pptxCorrelation.pptx
Correlation.pptx
Gauravchaudhary214677
 
Mba i qt unit-3_correlation
Mba i qt unit-3_correlationMba i qt unit-3_correlation
Mba i qt unit-3_correlation
Rai University
 

Similar to Linear correlation (20)

MCA_UNIT-4_Computer Oriented Numerical Statistical Methods
MCA_UNIT-4_Computer Oriented Numerical Statistical MethodsMCA_UNIT-4_Computer Oriented Numerical Statistical Methods
MCA_UNIT-4_Computer Oriented Numerical Statistical Methods
 
correlation and regression
correlation and regressioncorrelation and regression
correlation and regression
 
Correlation and Regression Analysis.pptx
Correlation and Regression Analysis.pptxCorrelation and Regression Analysis.pptx
Correlation and Regression Analysis.pptx
 
Business methmitcs
Business methmitcsBusiness methmitcs
Business methmitcs
 
Business methmitcs
Business methmitcsBusiness methmitcs
Business methmitcs
 
correlationandregression1-200905162711.pdf
correlationandregression1-200905162711.pdfcorrelationandregression1-200905162711.pdf
correlationandregression1-200905162711.pdf
 
Correlation Studies - Descriptive Studies
Correlation Studies - Descriptive StudiesCorrelation Studies - Descriptive Studies
Correlation Studies - Descriptive Studies
 
correlation and regression.pptx
correlation and regression.pptxcorrelation and regression.pptx
correlation and regression.pptx
 
Correlation analysis
Correlation analysisCorrelation analysis
Correlation analysis
 
Dependance Technique, Regression & Correlation
Dependance Technique, Regression & Correlation Dependance Technique, Regression & Correlation
Dependance Technique, Regression & Correlation
 
01 psychological statistics 1
01 psychological statistics 101 psychological statistics 1
01 psychological statistics 1
 
Correlationanalysis
CorrelationanalysisCorrelationanalysis
Correlationanalysis
 
Module - 2 correlation and regression.pptx
Module - 2 correlation and regression.pptxModule - 2 correlation and regression.pptx
Module - 2 correlation and regression.pptx
 
Module - 2 correlation and regression.pptx
Module - 2 correlation and regression.pptxModule - 2 correlation and regression.pptx
Module - 2 correlation and regression.pptx
 
CORRELATION.ppt
CORRELATION.pptCORRELATION.ppt
CORRELATION.ppt
 
Correlation and regression
Correlation and regressionCorrelation and regression
Correlation and regression
 
03 correlation analysis
03 correlation analysis03 correlation analysis
03 correlation analysis
 
Simple regressionand correlation (2).pdf
Simple regressionand correlation (2).pdfSimple regressionand correlation (2).pdf
Simple regressionand correlation (2).pdf
 
Correlation.pptx
Correlation.pptxCorrelation.pptx
Correlation.pptx
 
Mba i qt unit-3_correlation
Mba i qt unit-3_correlationMba i qt unit-3_correlation
Mba i qt unit-3_correlation
 

More from Tech_MX

Virtual base class
Virtual base classVirtual base class
Virtual base classTech_MX
 
Theory of estimation
Theory of estimationTheory of estimation
Theory of estimationTech_MX
 
Templates in C++
Templates in C++Templates in C++
Templates in C++Tech_MX
 
String & its application
String & its applicationString & its application
String & its applicationTech_MX
 
Statistical quality__control_2
Statistical  quality__control_2Statistical  quality__control_2
Statistical quality__control_2Tech_MX
 
Stack data structure
Stack data structureStack data structure
Stack data structureTech_MX
 
Stack Data Structure & It's Application
Stack Data Structure & It's Application Stack Data Structure & It's Application
Stack Data Structure & It's Application Tech_MX
 
Spanning trees & applications
Spanning trees & applicationsSpanning trees & applications
Spanning trees & applicationsTech_MX
 
Set data structure 2
Set data structure 2Set data structure 2
Set data structure 2Tech_MX
 
Set data structure
Set data structure Set data structure
Set data structure Tech_MX
 
Real time Operating System
Real time Operating SystemReal time Operating System
Real time Operating SystemTech_MX
 
Mouse interrupts (Assembly Language & C)
Mouse interrupts (Assembly Language & C)Mouse interrupts (Assembly Language & C)
Mouse interrupts (Assembly Language & C)Tech_MX
 
Motherboard of a pc
Motherboard of a pcMotherboard of a pc
Motherboard of a pcTech_MX
 
More on Lex
More on LexMore on Lex
More on LexTech_MX
 
MultiMedia dbms
MultiMedia dbmsMultiMedia dbms
MultiMedia dbmsTech_MX
 
Merging files (Data Structure)
Merging files (Data Structure)Merging files (Data Structure)
Merging files (Data Structure)Tech_MX
 
Memory dbms
Memory dbmsMemory dbms
Memory dbmsTech_MX
 

More from Tech_MX (20)

Virtual base class
Virtual base classVirtual base class
Virtual base class
 
Uid
UidUid
Uid
 
Theory of estimation
Theory of estimationTheory of estimation
Theory of estimation
 
Templates in C++
Templates in C++Templates in C++
Templates in C++
 
String & its application
String & its applicationString & its application
String & its application
 
Statistical quality__control_2
Statistical  quality__control_2Statistical  quality__control_2
Statistical quality__control_2
 
Stack data structure
Stack data structureStack data structure
Stack data structure
 
Stack Data Structure & It's Application
Stack Data Structure & It's Application Stack Data Structure & It's Application
Stack Data Structure & It's Application
 
Spss
SpssSpss
Spss
 
Spanning trees & applications
Spanning trees & applicationsSpanning trees & applications
Spanning trees & applications
 
Set data structure 2
Set data structure 2Set data structure 2
Set data structure 2
 
Set data structure
Set data structure Set data structure
Set data structure
 
Real time Operating System
Real time Operating SystemReal time Operating System
Real time Operating System
 
Parsing
ParsingParsing
Parsing
 
Mouse interrupts (Assembly Language & C)
Mouse interrupts (Assembly Language & C)Mouse interrupts (Assembly Language & C)
Mouse interrupts (Assembly Language & C)
 
Motherboard of a pc
Motherboard of a pcMotherboard of a pc
Motherboard of a pc
 
More on Lex
More on LexMore on Lex
More on Lex
 
MultiMedia dbms
MultiMedia dbmsMultiMedia dbms
MultiMedia dbms
 
Merging files (Data Structure)
Merging files (Data Structure)Merging files (Data Structure)
Merging files (Data Structure)
 
Memory dbms
Memory dbmsMemory dbms
Memory dbms
 

Recently uploaded

zkStudyClub - Reef: Fast Succinct Non-Interactive Zero-Knowledge Regex Proofs
zkStudyClub - Reef: Fast Succinct Non-Interactive Zero-Knowledge Regex ProofszkStudyClub - Reef: Fast Succinct Non-Interactive Zero-Knowledge Regex Proofs
zkStudyClub - Reef: Fast Succinct Non-Interactive Zero-Knowledge Regex Proofs
Alex Pruden
 
PCI PIN Basics Webinar from the Controlcase Team
PCI PIN Basics Webinar from the Controlcase TeamPCI PIN Basics Webinar from the Controlcase Team
PCI PIN Basics Webinar from the Controlcase Team
ControlCase
 
Smart TV Buyer Insights Survey 2024 by 91mobiles.pdf
Smart TV Buyer Insights Survey 2024 by 91mobiles.pdfSmart TV Buyer Insights Survey 2024 by 91mobiles.pdf
Smart TV Buyer Insights Survey 2024 by 91mobiles.pdf
91mobiles
 
FIDO Alliance Osaka Seminar: The WebAuthn API and Discoverable Credentials.pdf
FIDO Alliance Osaka Seminar: The WebAuthn API and Discoverable Credentials.pdfFIDO Alliance Osaka Seminar: The WebAuthn API and Discoverable Credentials.pdf
FIDO Alliance Osaka Seminar: The WebAuthn API and Discoverable Credentials.pdf
FIDO Alliance
 
Free Complete Python - A step towards Data Science
Free Complete Python - A step towards Data ScienceFree Complete Python - A step towards Data Science
Free Complete Python - A step towards Data Science
RinaMondal9
 
RESUME BUILDER APPLICATION Project for students
RESUME BUILDER APPLICATION Project for studentsRESUME BUILDER APPLICATION Project for students
RESUME BUILDER APPLICATION Project for students
KAMESHS29
 
PHP Frameworks: I want to break free (IPC Berlin 2024)
PHP Frameworks: I want to break free (IPC Berlin 2024)PHP Frameworks: I want to break free (IPC Berlin 2024)
PHP Frameworks: I want to break free (IPC Berlin 2024)
Ralf Eggert
 
SAP Sapphire 2024 - ASUG301 building better apps with SAP Fiori.pdf
SAP Sapphire 2024 - ASUG301 building better apps with SAP Fiori.pdfSAP Sapphire 2024 - ASUG301 building better apps with SAP Fiori.pdf
SAP Sapphire 2024 - ASUG301 building better apps with SAP Fiori.pdf
Peter Spielvogel
 
State of ICS and IoT Cyber Threat Landscape Report 2024 preview
State of ICS and IoT Cyber Threat Landscape Report 2024 previewState of ICS and IoT Cyber Threat Landscape Report 2024 preview
State of ICS and IoT Cyber Threat Landscape Report 2024 preview
Prayukth K V
 
GenAISummit 2024 May 28 Sri Ambati Keynote: AGI Belongs to The Community in O...
GenAISummit 2024 May 28 Sri Ambati Keynote: AGI Belongs to The Community in O...GenAISummit 2024 May 28 Sri Ambati Keynote: AGI Belongs to The Community in O...
GenAISummit 2024 May 28 Sri Ambati Keynote: AGI Belongs to The Community in O...
Sri Ambati
 
LF Energy Webinar: Electrical Grid Modelling and Simulation Through PowSyBl -...
LF Energy Webinar: Electrical Grid Modelling and Simulation Through PowSyBl -...LF Energy Webinar: Electrical Grid Modelling and Simulation Through PowSyBl -...
LF Energy Webinar: Electrical Grid Modelling and Simulation Through PowSyBl -...
DanBrown980551
 
Monitoring Java Application Security with JDK Tools and JFR Events
Monitoring Java Application Security with JDK Tools and JFR EventsMonitoring Java Application Security with JDK Tools and JFR Events
Monitoring Java Application Security with JDK Tools and JFR Events
Ana-Maria Mihalceanu
 
Epistemic Interaction - tuning interfaces to provide information for AI support
Epistemic Interaction - tuning interfaces to provide information for AI supportEpistemic Interaction - tuning interfaces to provide information for AI support
Epistemic Interaction - tuning interfaces to provide information for AI support
Alan Dix
 
The Art of the Pitch: WordPress Relationships and Sales
The Art of the Pitch: WordPress Relationships and SalesThe Art of the Pitch: WordPress Relationships and Sales
The Art of the Pitch: WordPress Relationships and Sales
Laura Byrne
 
Pushing the limits of ePRTC: 100ns holdover for 100 days
Pushing the limits of ePRTC: 100ns holdover for 100 daysPushing the limits of ePRTC: 100ns holdover for 100 days
Pushing the limits of ePRTC: 100ns holdover for 100 days
Adtran
 
Quantum Computing: Current Landscape and the Future Role of APIs
Quantum Computing: Current Landscape and the Future Role of APIsQuantum Computing: Current Landscape and the Future Role of APIs
Quantum Computing: Current Landscape and the Future Role of APIs
Vlad Stirbu
 
UiPath Community Day Dubai: AI at Work..
UiPath Community Day Dubai: AI at Work..UiPath Community Day Dubai: AI at Work..
UiPath Community Day Dubai: AI at Work..
UiPathCommunity
 
Removing Uninteresting Bytes in Software Fuzzing
Removing Uninteresting Bytes in Software FuzzingRemoving Uninteresting Bytes in Software Fuzzing
Removing Uninteresting Bytes in Software Fuzzing
Aftab Hussain
 
Le nuove frontiere dell'AI nell'RPA con UiPath Autopilot™
Le nuove frontiere dell'AI nell'RPA con UiPath Autopilot™Le nuove frontiere dell'AI nell'RPA con UiPath Autopilot™
Le nuove frontiere dell'AI nell'RPA con UiPath Autopilot™
UiPathCommunity
 
Why You Should Replace Windows 11 with Nitrux Linux 3.5.0 for enhanced perfor...
Why You Should Replace Windows 11 with Nitrux Linux 3.5.0 for enhanced perfor...Why You Should Replace Windows 11 with Nitrux Linux 3.5.0 for enhanced perfor...
Why You Should Replace Windows 11 with Nitrux Linux 3.5.0 for enhanced perfor...
SOFTTECHHUB
 

Recently uploaded (20)

zkStudyClub - Reef: Fast Succinct Non-Interactive Zero-Knowledge Regex Proofs
zkStudyClub - Reef: Fast Succinct Non-Interactive Zero-Knowledge Regex ProofszkStudyClub - Reef: Fast Succinct Non-Interactive Zero-Knowledge Regex Proofs
zkStudyClub - Reef: Fast Succinct Non-Interactive Zero-Knowledge Regex Proofs
 
PCI PIN Basics Webinar from the Controlcase Team
PCI PIN Basics Webinar from the Controlcase TeamPCI PIN Basics Webinar from the Controlcase Team
PCI PIN Basics Webinar from the Controlcase Team
 
Smart TV Buyer Insights Survey 2024 by 91mobiles.pdf
Smart TV Buyer Insights Survey 2024 by 91mobiles.pdfSmart TV Buyer Insights Survey 2024 by 91mobiles.pdf
Smart TV Buyer Insights Survey 2024 by 91mobiles.pdf
 
FIDO Alliance Osaka Seminar: The WebAuthn API and Discoverable Credentials.pdf
FIDO Alliance Osaka Seminar: The WebAuthn API and Discoverable Credentials.pdfFIDO Alliance Osaka Seminar: The WebAuthn API and Discoverable Credentials.pdf
FIDO Alliance Osaka Seminar: The WebAuthn API and Discoverable Credentials.pdf
 
Free Complete Python - A step towards Data Science
Free Complete Python - A step towards Data ScienceFree Complete Python - A step towards Data Science
Free Complete Python - A step towards Data Science
 
RESUME BUILDER APPLICATION Project for students
RESUME BUILDER APPLICATION Project for studentsRESUME BUILDER APPLICATION Project for students
RESUME BUILDER APPLICATION Project for students
 
PHP Frameworks: I want to break free (IPC Berlin 2024)
PHP Frameworks: I want to break free (IPC Berlin 2024)PHP Frameworks: I want to break free (IPC Berlin 2024)
PHP Frameworks: I want to break free (IPC Berlin 2024)
 
SAP Sapphire 2024 - ASUG301 building better apps with SAP Fiori.pdf
SAP Sapphire 2024 - ASUG301 building better apps with SAP Fiori.pdfSAP Sapphire 2024 - ASUG301 building better apps with SAP Fiori.pdf
SAP Sapphire 2024 - ASUG301 building better apps with SAP Fiori.pdf
 
State of ICS and IoT Cyber Threat Landscape Report 2024 preview
State of ICS and IoT Cyber Threat Landscape Report 2024 previewState of ICS and IoT Cyber Threat Landscape Report 2024 preview
State of ICS and IoT Cyber Threat Landscape Report 2024 preview
 
GenAISummit 2024 May 28 Sri Ambati Keynote: AGI Belongs to The Community in O...
GenAISummit 2024 May 28 Sri Ambati Keynote: AGI Belongs to The Community in O...GenAISummit 2024 May 28 Sri Ambati Keynote: AGI Belongs to The Community in O...
GenAISummit 2024 May 28 Sri Ambati Keynote: AGI Belongs to The Community in O...
 
LF Energy Webinar: Electrical Grid Modelling and Simulation Through PowSyBl -...
LF Energy Webinar: Electrical Grid Modelling and Simulation Through PowSyBl -...LF Energy Webinar: Electrical Grid Modelling and Simulation Through PowSyBl -...
LF Energy Webinar: Electrical Grid Modelling and Simulation Through PowSyBl -...
 
Monitoring Java Application Security with JDK Tools and JFR Events
Monitoring Java Application Security with JDK Tools and JFR EventsMonitoring Java Application Security with JDK Tools and JFR Events
Monitoring Java Application Security with JDK Tools and JFR Events
 
Epistemic Interaction - tuning interfaces to provide information for AI support
Epistemic Interaction - tuning interfaces to provide information for AI supportEpistemic Interaction - tuning interfaces to provide information for AI support
Epistemic Interaction - tuning interfaces to provide information for AI support
 
The Art of the Pitch: WordPress Relationships and Sales
The Art of the Pitch: WordPress Relationships and SalesThe Art of the Pitch: WordPress Relationships and Sales
The Art of the Pitch: WordPress Relationships and Sales
 
Pushing the limits of ePRTC: 100ns holdover for 100 days
Pushing the limits of ePRTC: 100ns holdover for 100 daysPushing the limits of ePRTC: 100ns holdover for 100 days
Pushing the limits of ePRTC: 100ns holdover for 100 days
 
Quantum Computing: Current Landscape and the Future Role of APIs
Quantum Computing: Current Landscape and the Future Role of APIsQuantum Computing: Current Landscape and the Future Role of APIs
Quantum Computing: Current Landscape and the Future Role of APIs
 
UiPath Community Day Dubai: AI at Work..
UiPath Community Day Dubai: AI at Work..UiPath Community Day Dubai: AI at Work..
UiPath Community Day Dubai: AI at Work..
 
Removing Uninteresting Bytes in Software Fuzzing
Removing Uninteresting Bytes in Software FuzzingRemoving Uninteresting Bytes in Software Fuzzing
Removing Uninteresting Bytes in Software Fuzzing
 
Le nuove frontiere dell'AI nell'RPA con UiPath Autopilot™
Le nuove frontiere dell'AI nell'RPA con UiPath Autopilot™Le nuove frontiere dell'AI nell'RPA con UiPath Autopilot™
Le nuove frontiere dell'AI nell'RPA con UiPath Autopilot™
 
Why You Should Replace Windows 11 with Nitrux Linux 3.5.0 for enhanced perfor...
Why You Should Replace Windows 11 with Nitrux Linux 3.5.0 for enhanced perfor...Why You Should Replace Windows 11 with Nitrux Linux 3.5.0 for enhanced perfor...
Why You Should Replace Windows 11 with Nitrux Linux 3.5.0 for enhanced perfor...
 

Linear correlation

  • 1. CORRELATION (LINEAR) 3 September 2012 1
  • 2. CORRELATION  If two quantities vary in such a way that movements of one are accompanied by movements of others then these quantities are said to be correlated.  Ex: relationship between price of commodity and amount demanded, Increased in amount of the rainfall and the production of rice  The degree of relationship between variables under consideration is measured through the correlation analysis.  The measure of correlation is called the correlation coefficient or correlation index ( usually denoted by r or ρ )  The correlation analysis refers to the techniques used in measuring the closeness of the relationship between the variables. 3 September 2012 2
  • 3. DEFINITIONS • Correlation analysis deals with the association between two or more variables. Simpson and Kafka • Correlation is an analysis of co variation between two or more variables. A.M.Tuttle • If two or more quantities were in sympathy so that the movement of one tend to be accompanied by the corresponding movements in the other then they are said to be correlated L.R.Conner 3 September 2012 3
  • 4. ANALYSIS • The problem of analyzing the relation between different series should be broken down in to three steps 1. Determining whether a relation exists and if it does, measuring it. 2. Testing whether it is significant. 3. Establishing the cause and effect relation if any. 3 September 2012 4
  • 5. SIGNIFICANCE OF THE STUDY OF CORRELATION  Most of the variables show some kind of relationship  Once we know that two variables are closely related we can estimate the value of one variable given the value of another.  Correlation analysis contributes to the understanding of the economic behavior  The effect of correlation is to reduce the range of uncertainty 3 September 2012 5
  • 6. CORRELATION AND CAUSATION 1. The correlation may be due to pure chance especially in a small sample. Income(rs) 500 600 700 800 900 Weight(lbs) 120 140 160 180 200 The above data show a perfect positive relationship between income and weight i.e., as the income is increasing the weight is increasing and the rate of change between two variables is the same. 3 September 2012 6
  • 7. 2. Both the correlated variables may be influenced by one or more other variables. 3. Both the variables may be mututally influencing each other so that neither can be designated as the cause and the other the effect. Correlation observed between variables that cannot conceivably be casually related is called spurious or nonsense correlation 3 September 2012 7
  • 8. TYPES OF CORRELATION Positive or negative Linear and non linear correlation Simple , partial and multiple correlation 3 September 2012 8
  • 9. POSITIVE OR NEGATIVE CORRELATION • Whether the correlation is positive or negative would depend up on the direction of the change of the variable. • If both the variables are varying in the same direction , then the correlation is said to be positive. • If the variables are varying in opposite direction the correlation is said to be negative 3 September 2012 9
  • 10. Positive correlation X 10 12 15 18 20 Y 15 20 22 25 37 Y-Values 40 35 30 25 20 15 10 5 0 0 5 10 15 20 25 3 September 2012 10
  • 11. Negative correlation X 20 30 40 60 80 Y 40 30 22 15 10 Y-Values 45 40 35 30 25 20 15 10 5 0 0 20 40 60 80 100 3 September 2012 11
  • 12. SIMPLE PARTIAL AND MULTIPLE CORRELATION • The distinction between simple partial and multiple correlation is based up on the number of variables studied. • When only two variables are studied it is a problem of simple correlation • When three or more variable are studied it is problem of either multiple or partial correlation. • In multiple correlation three or more variables are studied simultaneously. • On the other hand in partial correlation we recognize more than two variables but consider only two variables to be influencing each other the effect of other influencing variable kept constant. 3 September 2012 12
  • 13. LINEAR AND NONLINEAR(CURVILINEAR) CORRELATION • Distinction between linear and non linear correlation is based up on the constancy of the ratio of change between the variables. • If the amount of change in one variable tends to bear constant ratio to the amount of change in the other variable then the correlation is said to be linear. X 10 20 30 40 50 Y 70 140 210 280 350 It is clear that the ratio of change between the two variables is the same. • If such variables are plotted on the graph paper all the plotted points would fall on a straight line. 3 September 2012 13
  • 14. 400 350 300 250 200 150 100 50 0 0 10 20 30 40 50 60 3 September 2012 14
  • 15. Correlation would be called non linear or curvilinear if the amount of change in one variable does not bear a constant ratio with the amount of change in the other variable. 3 September 2012 15
  • 16. METHODS OF STUDYING CORRELATION 1. Scatter diagram 2. Graphic method 3. Karl Pearson’s coefficient of correlation. 4. Concurrent Deviation Method 5. Method of least squares 3 September 2012 16
  • 17. SCATTER DIAGRAM METHOD • The simplest device for ascertaining if the two variables are related is to prepare a dot chart called scatter diagram. • When this method is used the given data are plotted on a graph paper in the form of dots. I.e., for each pair of X and Y values we put a dot and thus obtain as many points as the number of observations. • By looking to the scatter of the various points we can form an idea as to whether the variables are related or not. • The greater the scatter of the plotted points on the chart the lesser is the relationship between the two variables • The more closely the points come to the straight line higher the degree of relationship. 3 September 2012 17
  • 18. • If all the points lie on a straight line falling from the lower left hand corner to the upper right hand corner the correlation is said to be perfectly positive(r=1) 8 7 6 5 4 3 2 1 0 0 2 4 6 8 3 September 2012 18
  • 19. If all the points are lying on a straight line rising from the upper left hand corner to the lower right hand corner of the diagram correlation is said to be perfectly negative. 8 7 6 5 4 3 2 1 0 0 1 2 3 4 5 6 7 8 3 September 2012 19
  • 20. • If the plotted points fall in a narrow band there would be a high degree of correlation between the variables. • If the points are widely scattered over the diagram it indicates very little relation ship between the variables. 10 10 8 8 6 6 4 4 2 2 0 0 0 5 10 0 5 10 HIGH DEGREE OF POSITIVE CORRELATION LOW DEGREE OF POSITIVE CORRELATION 3 September 2012 20
  • 21. If the plotted points lie in a haphazard manner it shows the absence of any relationship between the variables 8 7 6 5 4 3 2 1 0 0 2 4 6 8 10 12 14 3 September 2012 21
  • 22. EXAMPLE: X 2 3 5 6 8 Y 6 5 7 8 12 14 12 10 8 6 4 2 0 0 2 4 6 8 10 3 September 2012 22
  • 23. • By looking at the scattered diagram we can say that the variables x and y are correlated. Further the correlation is positive because the trend of the points is upward rising from the lower left hand corner to the upper right hand corner of the diagram. • It also indicates that the degree of relationship is higher because the plotted points are near to the line which shows perfect relationship between the variables. 3 September 2012 23
  • 24. MERITS AND LIMITATIONS MERITS • It is a simple and non mathematical method of studying correlation between variables. • As such it can be easily understood and a rough idea can very quickly be formed as to whether or the variables are related. • It is the first step in investigating relationship between 2 variables. LIMITATIONS: • By applying this method we can get an idea about the direction of correlation and also whether it is high or low • But we cannot establish the exact degree of correlation between the variables as is possible by applying the mathematical methods. 3 September 2012 24
  • 25. GRAPHIC METHOD • When this method is used the individual values of the two variables are plotted on the graph paper. • We thus obtain 2 curves. One for x variable and another for y variable. • By examining the direction and closeness of the two curves so drawn we can infer if the variables are related or not. • If both the curves drawn on the graph are moving in the same direction (either upward or downward)then the correlation is said to be positive. • On the other hand if the curves are moving in the opposite direction correlation is said to be negative. 3 September 2012 25
  • 26. Year Average income Average expenditure 1979 100 90 1980 102 91 1981 105 93 1982 105 95 1983 101 92 1984 112 94 3 September 2012 26
  • 27. 120 INCOME 100 EXPENDITURE 80 60 Series 1 Series 2 40 20 0 1979 1980 1981 1982 1983 1984 3 September 2012 27
  • 28. KARL PEARSON’S COEFFICIENT OF CORRELATION • Among several mathematical methods of measuring correlation, the Karl Pearson’s method, popularly known as Pearson’s coefficient of correlation, is most widely used in practice • It is denoted by the symbol ρ or r 3 September 2012 28
  • 29. CORRELATION COEFFICIENT • If [X,Y] is a two dimensional random variable, the correlation coefficient, denoted r, is ρ=Cov(X,Y) ∕ Var(X) . Var(Y) = σXY ∕ σX σY • This is also called as PEARSON CORRELATION COEFFICIENT ρ= ∑xy ∕ √ (∑x2 * ∑y2) = ∑xy ∕ N σX σY , where x=(X-X’) ; y=(Y-Y’) σX = Standard Deviation of X and σY = Standard Deviation of Y N = no of pairs of observation 3 September 2012 ρ = correlation coefficient 29
  • 30. STEPS TO CALCULATE CORRELATION COEFFICIENT • Take the deviations of X from the mean of X and denote by x • Square these deviations and obtain the total i.e., Σx2 • Take the deviations of Y from the mean of Y and denote by y • Square these deviations and obtain the total i.e., Σy2 • Multiply the deviations of X and Y and obtain the total i.e., Σxy • Substitute the values in the formula 3 September 2012 30
  • 31. EXAMPLE • Calculate the Karl Pearson’s Correlation Coefficient from the following data and interpret it’s value Roll no of students: 1 2 3 4 5 Marks in Accountancy : 48 35 17 23 47 Marks in Statistics: 45 20 40 25 45 SOLUTION: Let marks in Accountancy be denoted by X and Statistics by Y 3 September 2012 31
  • 32. Roll no X (X-34) x2 Y (Y-35) y2 xy x y 1 48 14 196 45 10 100 140 2 35 1 1 20 -15 225 -15 3 17 -17 289 40 5 25 -85 4 23 -11 121 25 -10 100 110 5 47 13 169 45 10 100 130 ∑X=170 ∑x=0 ∑x2=776 ∑Y=175 ∑y=0 ∑y2=550 ∑xy=280 3 September 2012 32
  • 33. • The Pearson’s coefficient of correlation is ρ= ∑xy ∕ √(∑x2 *∑y2) where x=(X-X’); y=(Y-Y’) , X'= ∑X ∕ N; Y’=∑Y ∕ N ∑xy=280 ∑x2=776 ∑y2=550 ρ = 280 ∕ √ (776 * 550) = 0.496 3 September 2012 33
  • 34. DEGREE OF CORRELATION • The value of ρ always lies between -1 and 1. • If ρ lies between 0 and 1, it is positive. Else, if it lies between -1 and 0, it is negative • If ρ=1, then the two variables are said to be perfect positively correlated • If ρ=-1, then the two variables are said to be perfect negatively correlated • If ρ=0, then the two variables are not correlated 3 September 2012 34