Download to read offline

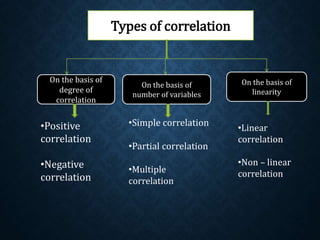
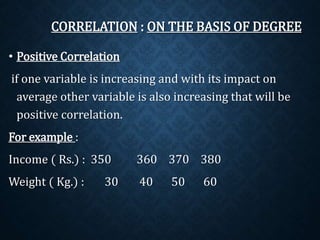
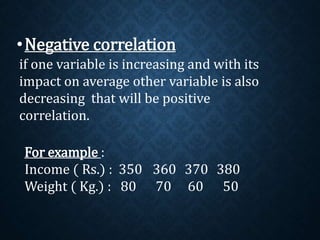
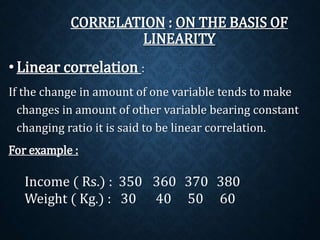
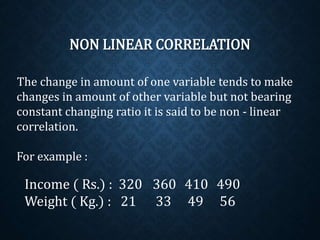
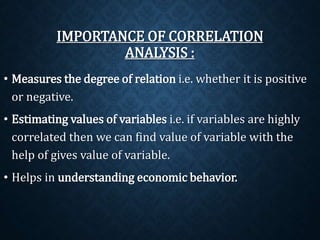
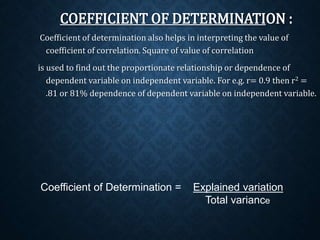


Correlation analysis is used to determine the relationship between two or more variables. It can analyze the degree, direction, and type of relationship. The key types of correlation are positive (variables increase together), negative (variables change inversely), simple (two variables), partial (three+ variables with some held constant), and multiple (three+ variables together). Correlation can also be linear (constant ratio of changes) or non-linear (varying ratio of changes). It is useful for understanding variable behavior, estimating values, and interpreting results with measures like the correlation coefficient and coefficient of determination.