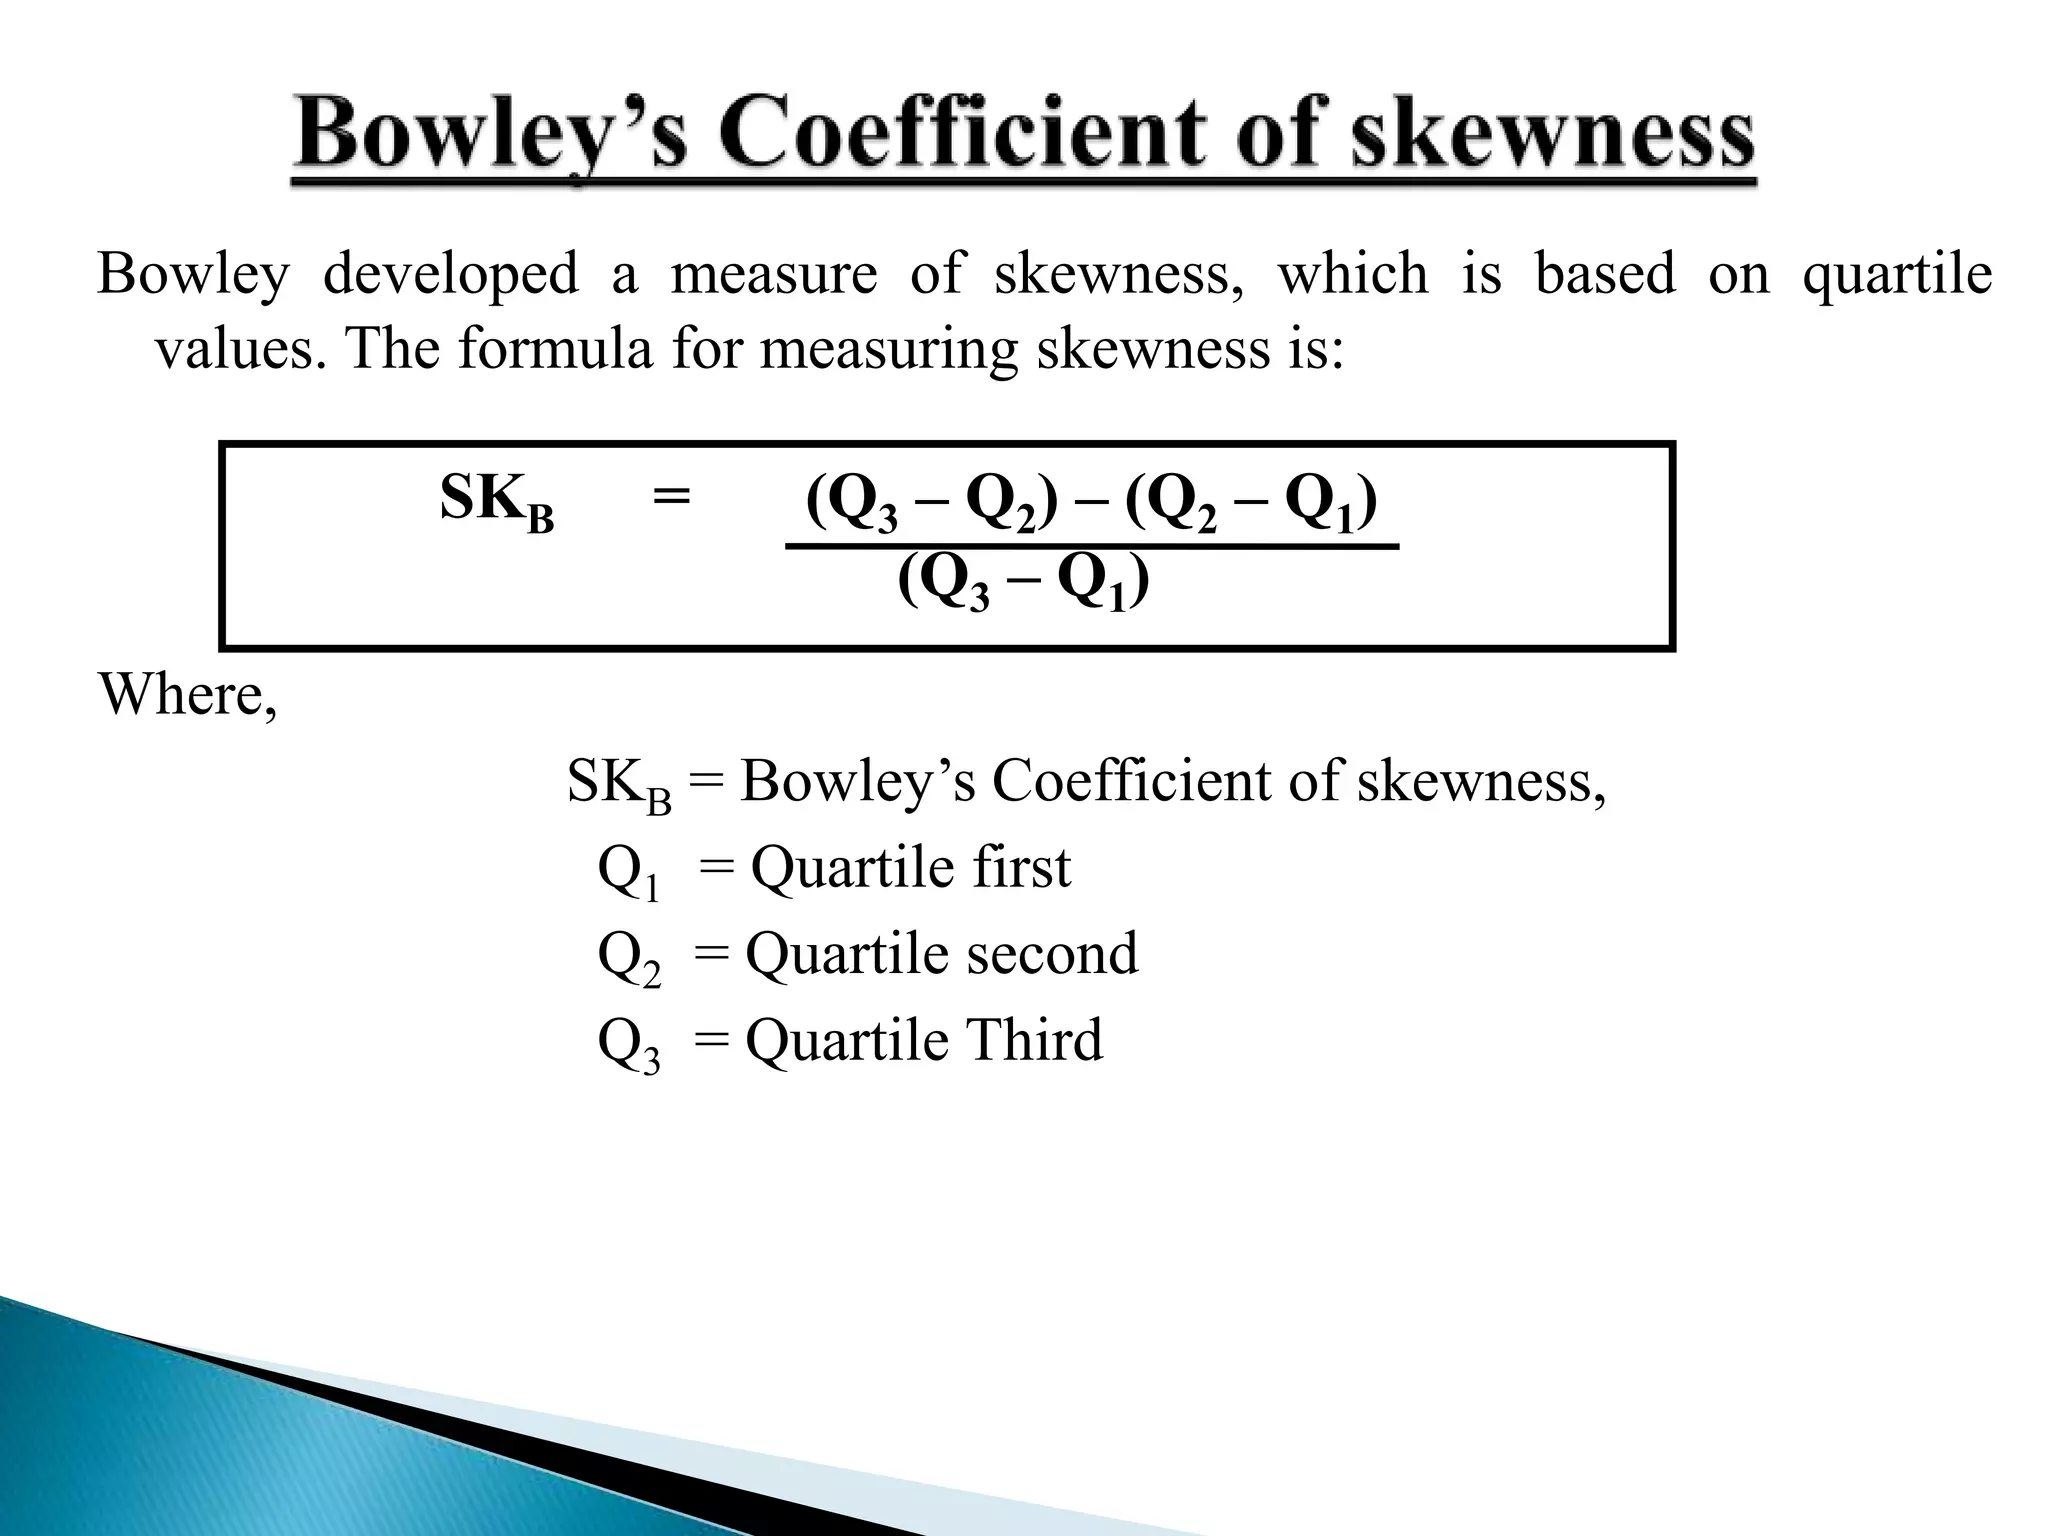
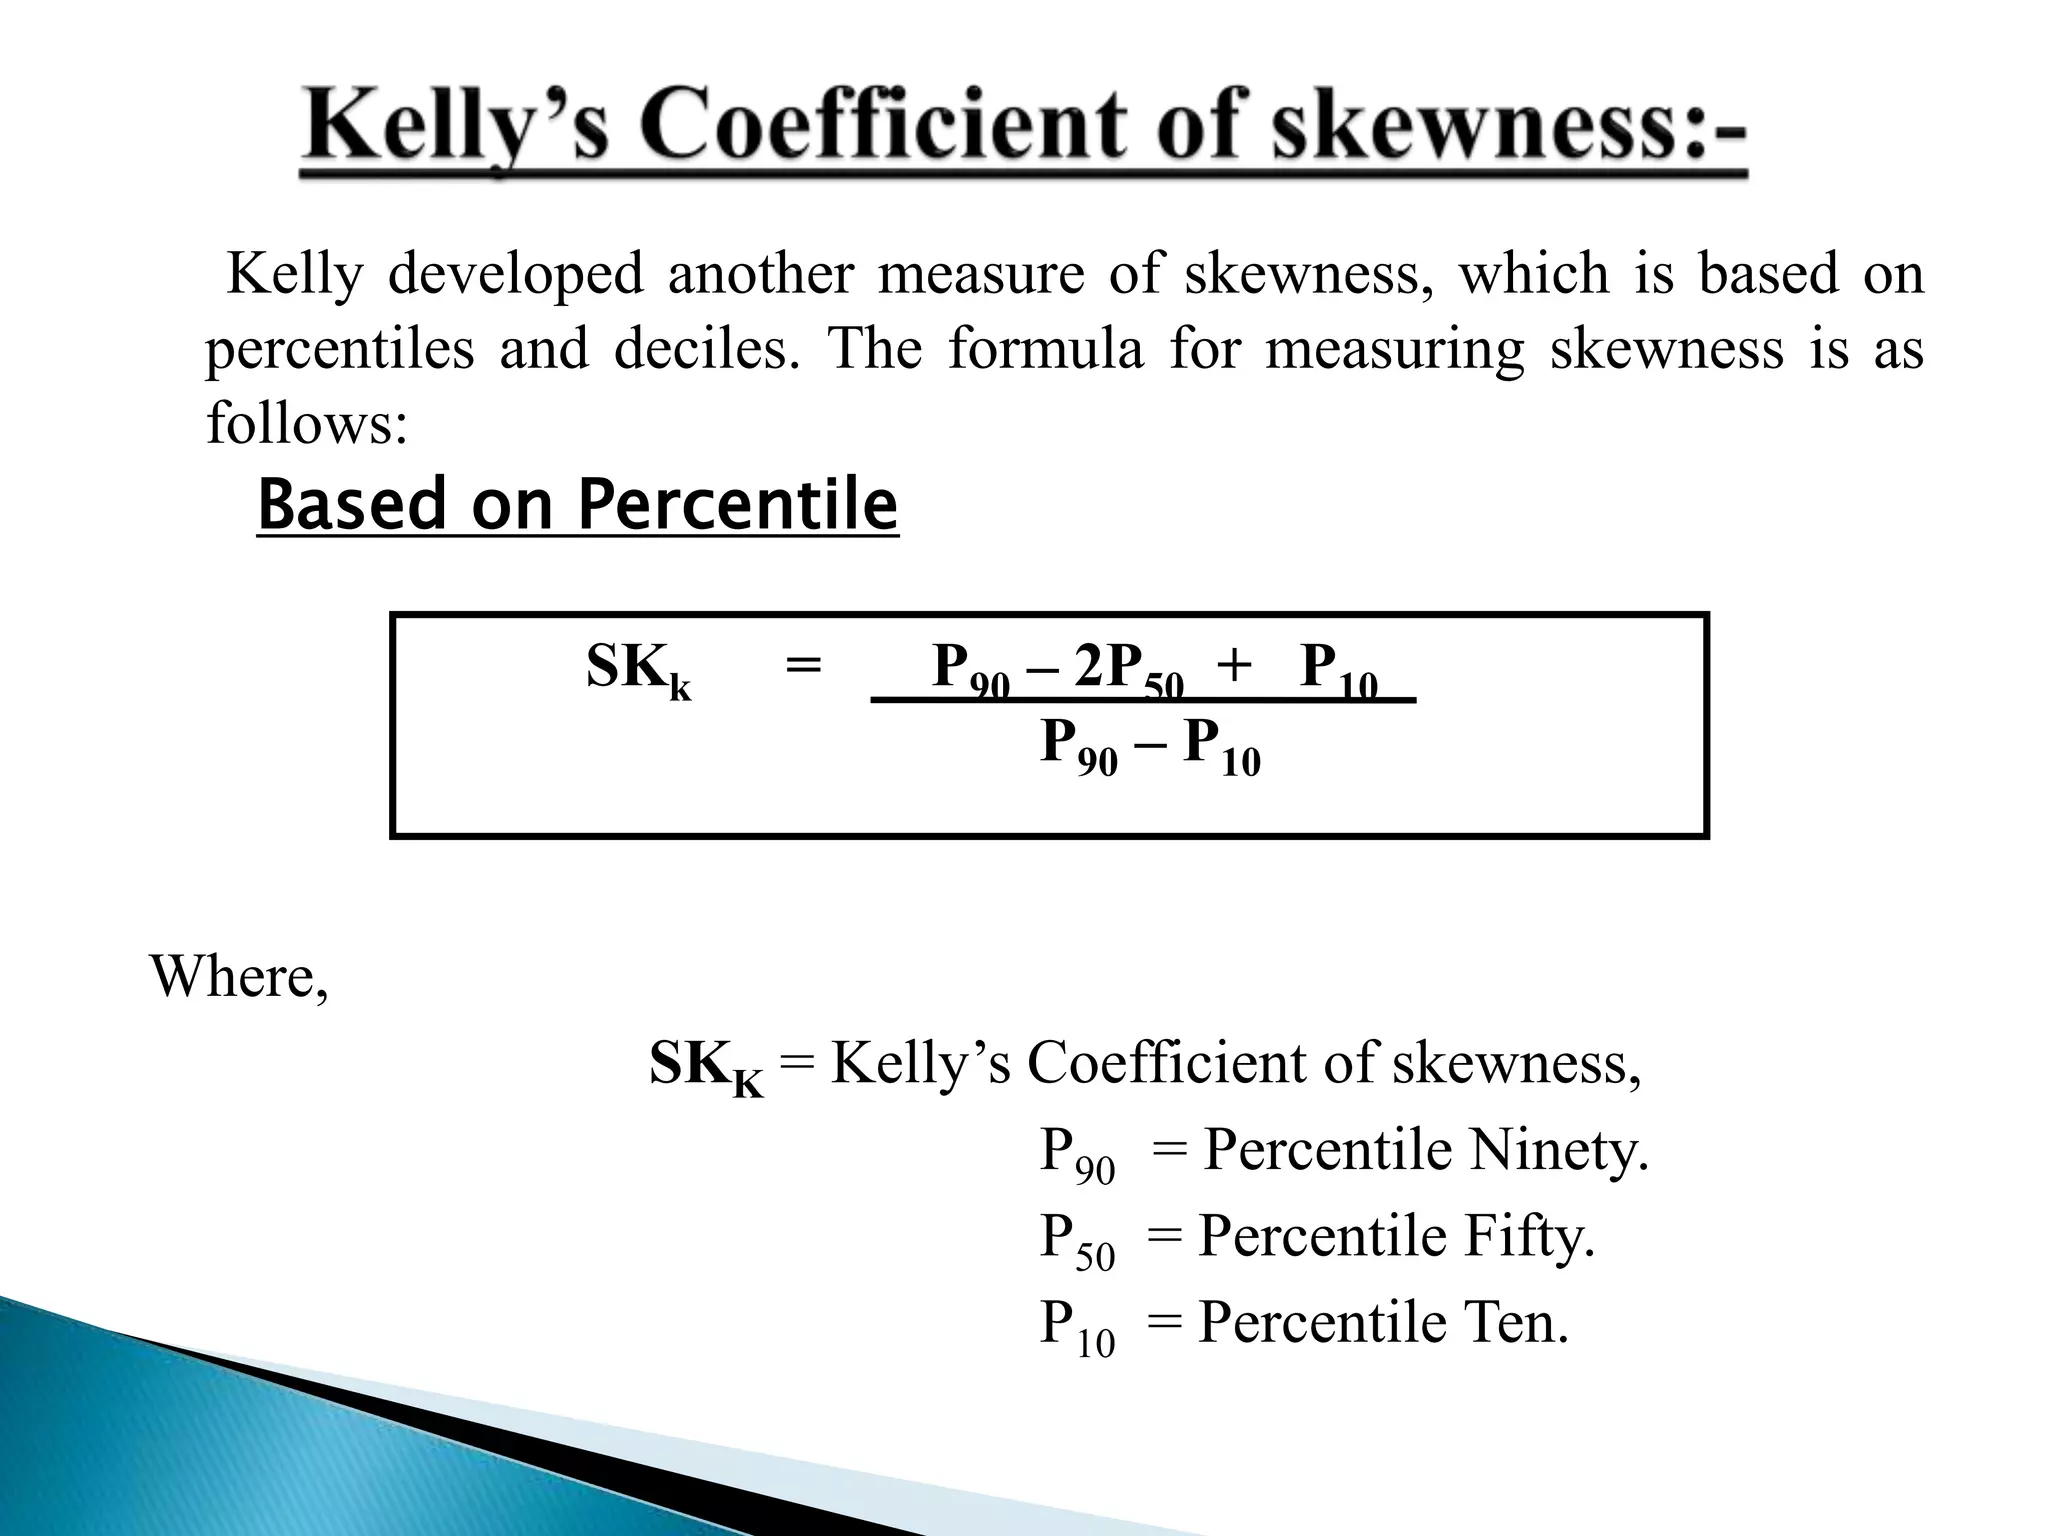
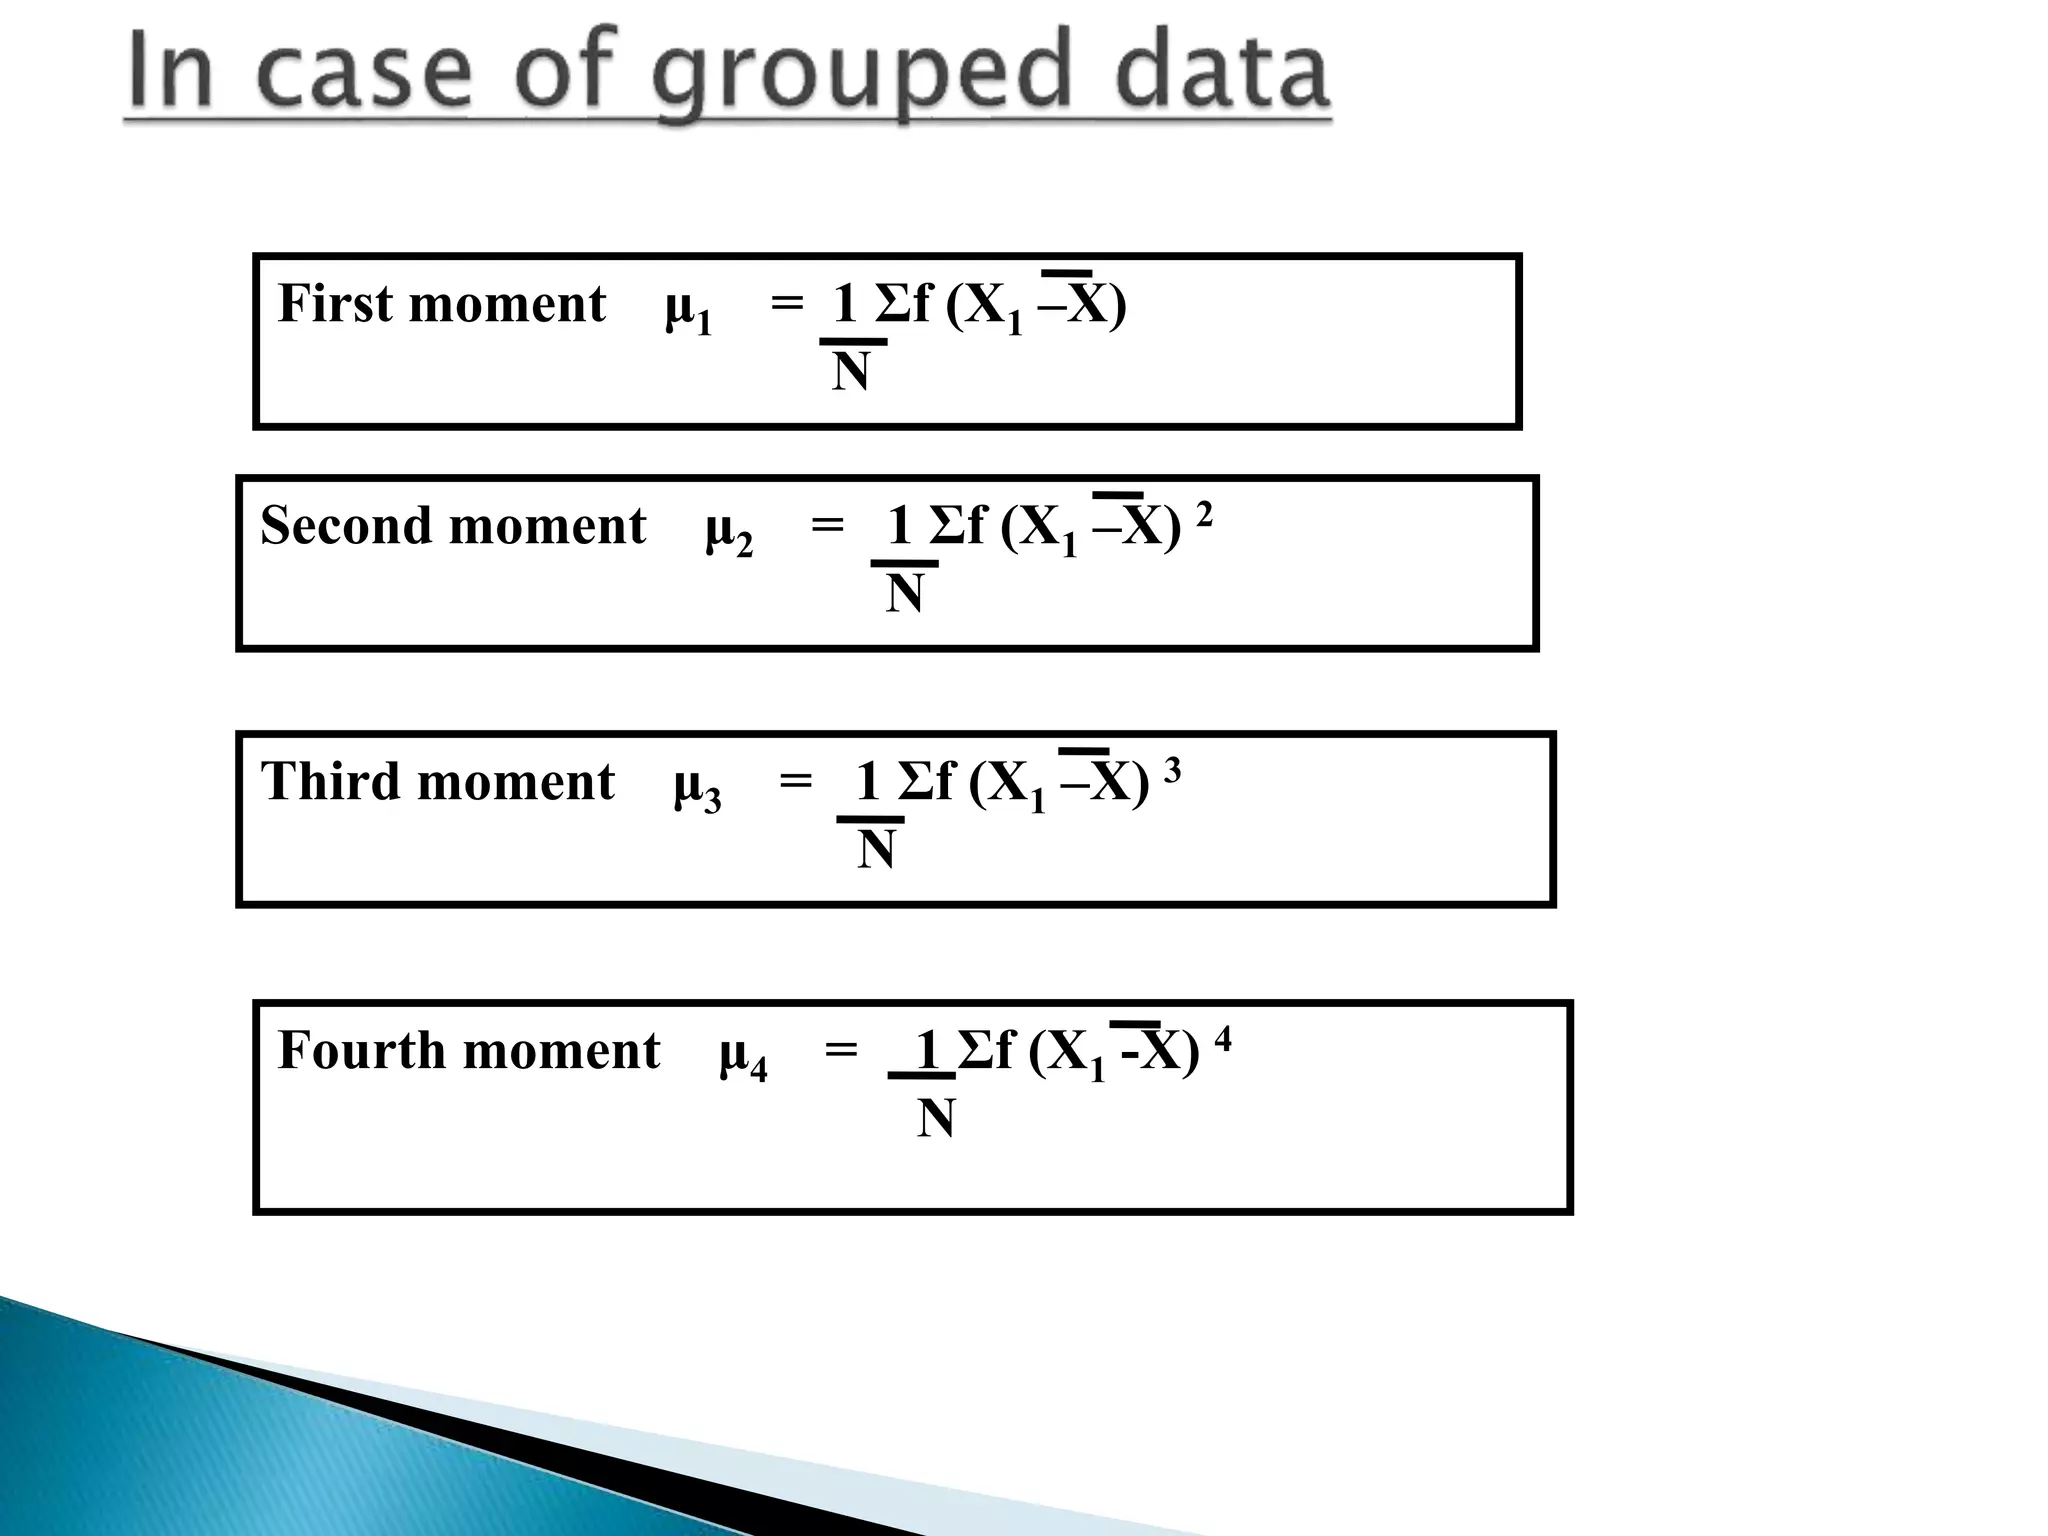
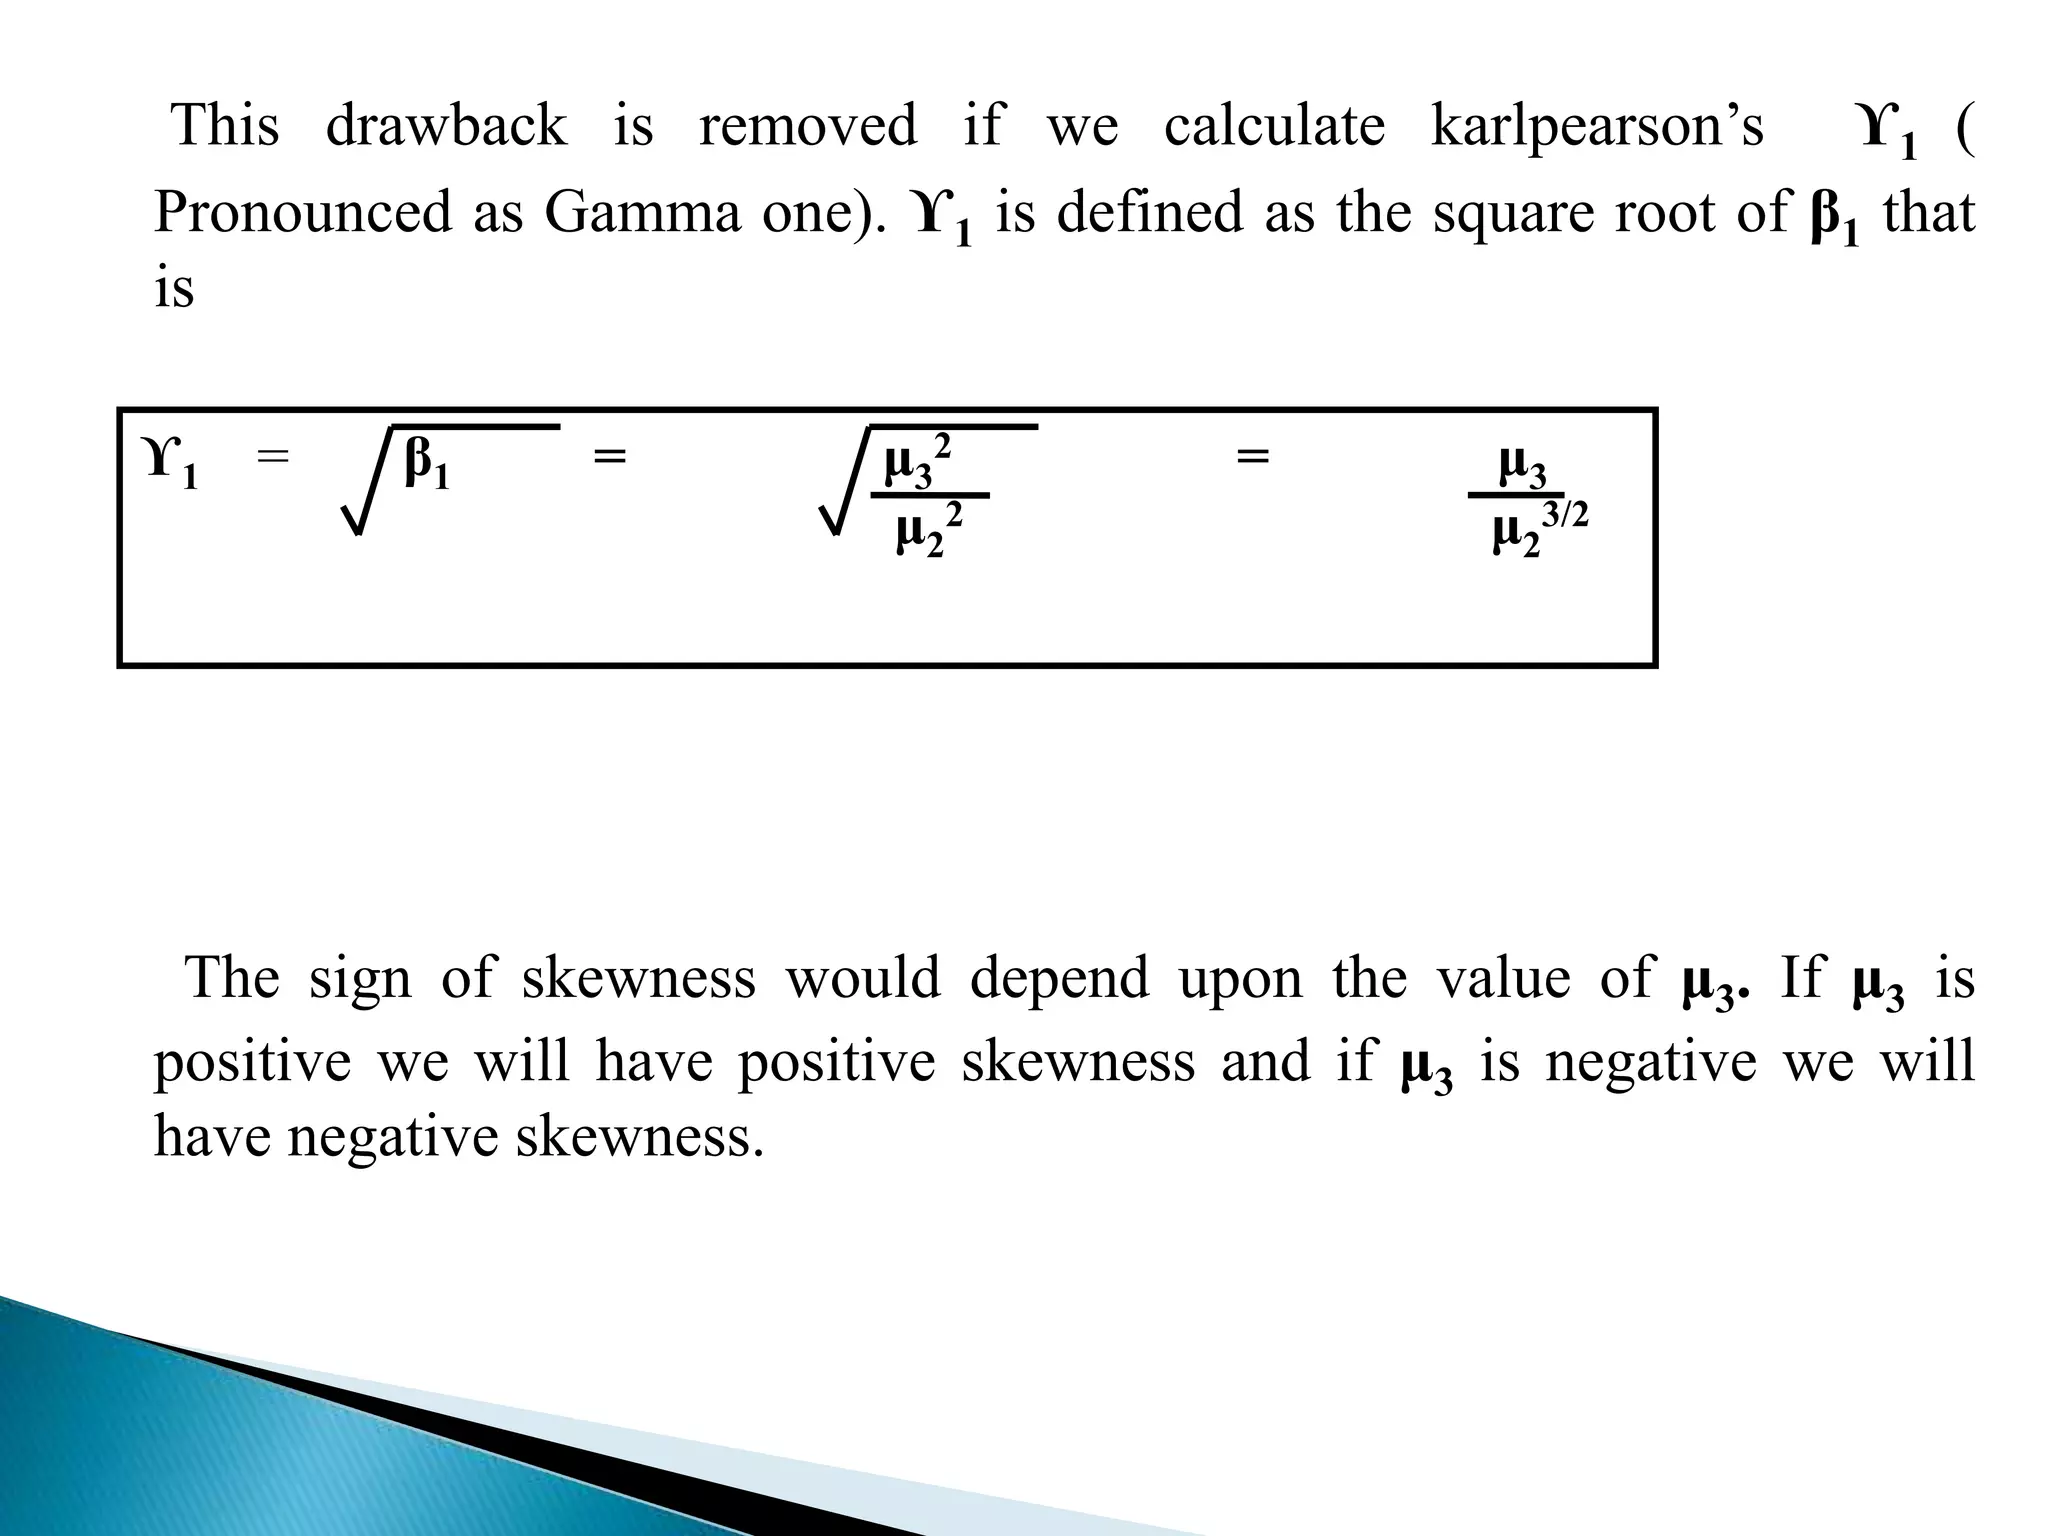
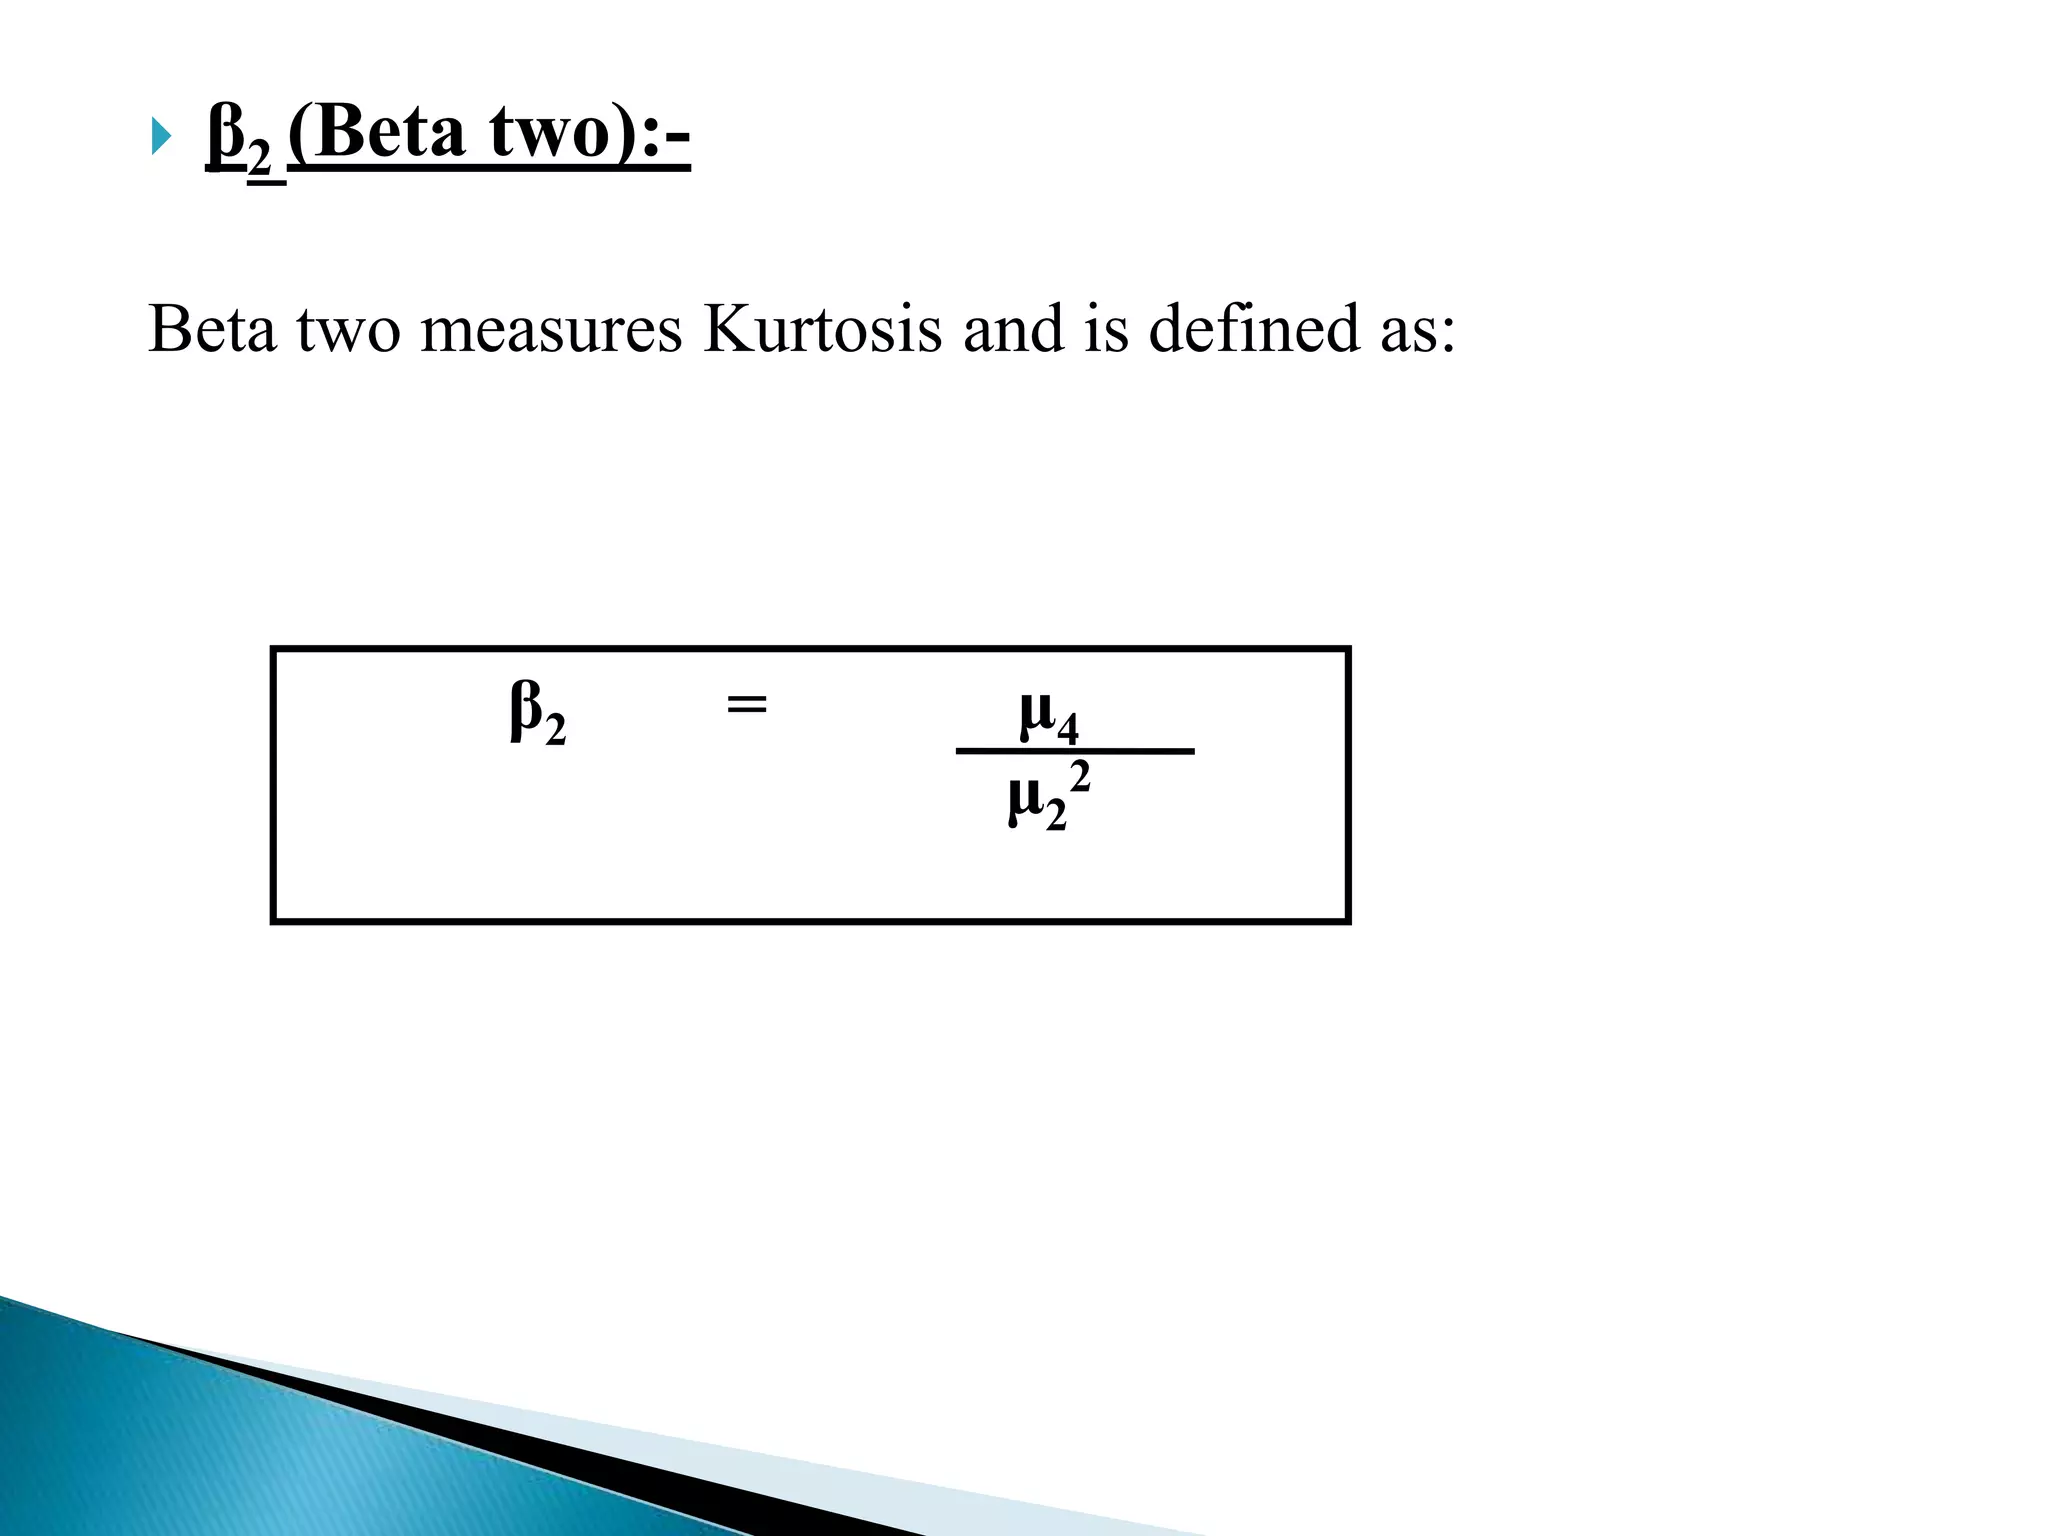
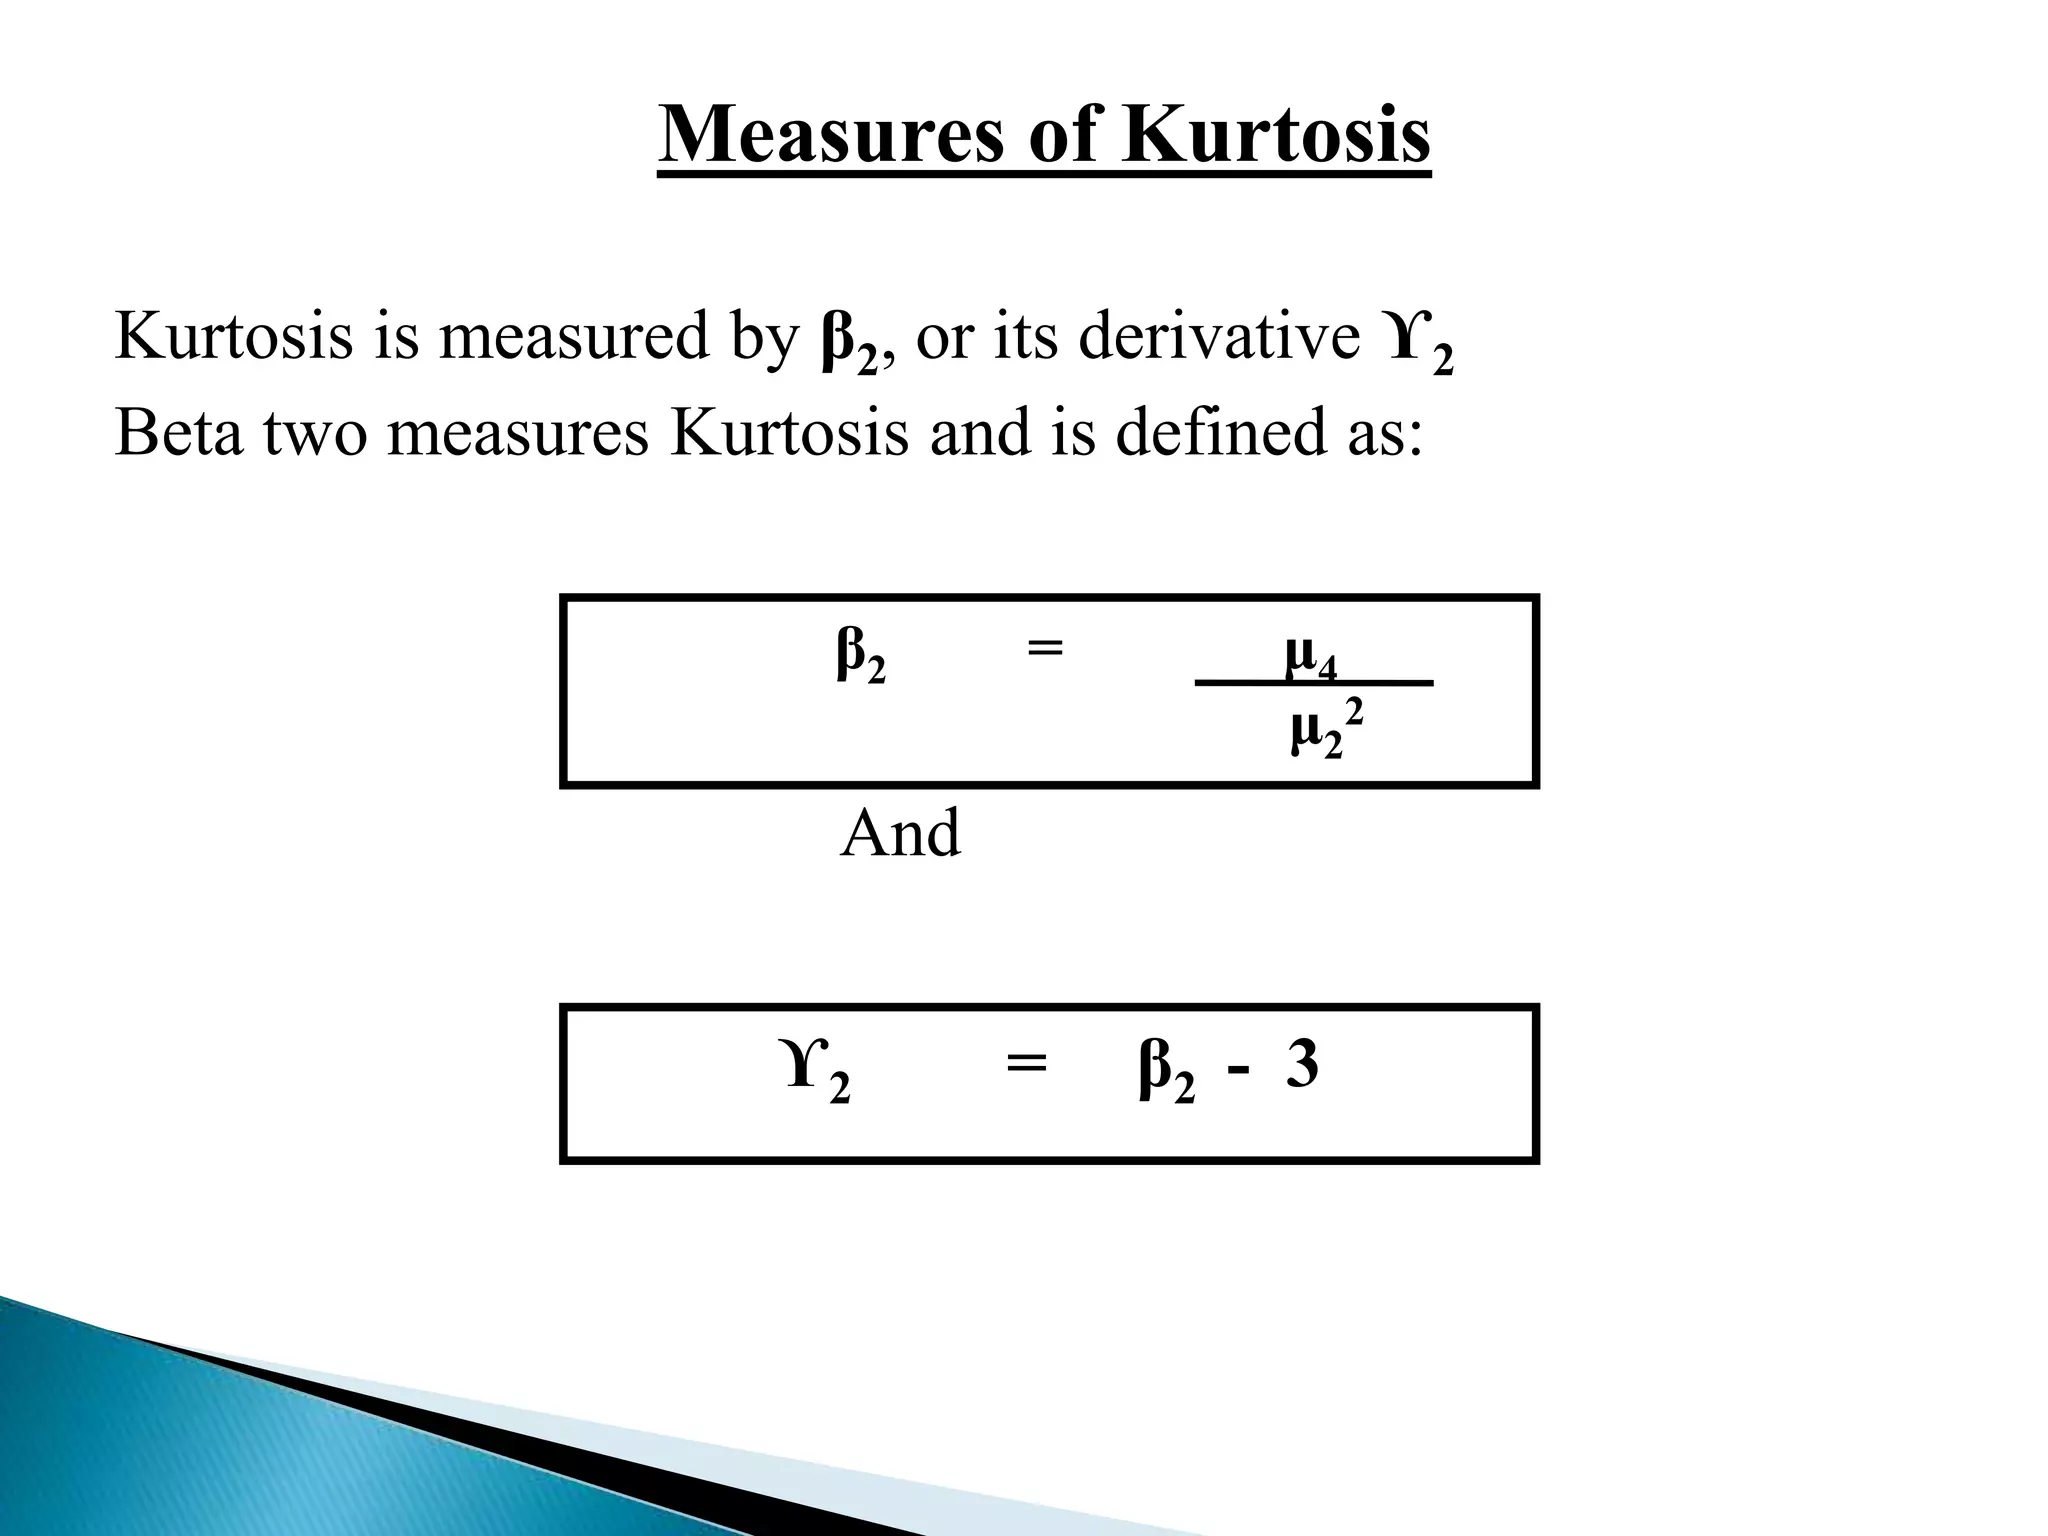
SlideShare a Scribd company logo
1 of 27
Prof. Rajkumar Teotia 
Institute of Advanced Management and Research (IAMR) 
Address: 9th Km Stone, NH-58, Delhi-Meerut Road, Duhai,Ghaziabad (U.P) 
- 201206 
Ph:0120-2675904/905 Mob:9999052997 Fax: 0120-2679145 
e mail: rajkumarteotia@iamrindia.com
A distribution is said to be 'skewed' when the mean and the 
median fall at different points in the distribution, and the 
balance (or centre of gravity) is shifted to one side or the 
other-to left or right. 
Measures of skewness tell us the direction and the extent of 
Skewness. In symmetrical distribution the mean, median and 
mode are identical. The more the mean moves away from the 
mode, the larger the asymmetry or skewness
A frequency distribution is said to be symmetrical if the frequencies are 
equally distributed on both the sides of central value. A symmetrical 
distribution may be either bell – shaped or U shaped. 
1- Bell – shaped or unimodel Symmetrical Distribution 
A symmetrical distribution is bell – shaped if the frequencies are first 
steadily rise and then steadily fall. There is only one mode and the values 
of mean, median and mode are equal. 
Mean = Median = Mode
A frequency distribution is said to be skewed if the 
frequencies are not equally distributed on both the sides 
of the central value. A skewed distribution may be 
• Positively Skewed 
• Negatively Skewed 
• ‘L’ shaped positively skewed 
• ‘J’ shaped negatively skewed
Positively skewed 
Mean ˃ Median ˃ Mode
Negatively skewed 
Mean ˂ Median ˂ Mode
‘L’ Shaped Positively skewed 
Mean ˂ Mode 
Mean ˂ Median
‘J’ Shaped Negatively Skewed 
Mean ˃ Mode 
Mean ˃ Median
In order to ascertain whether a distribution is skewed or not the 
following tests may be applied. Skewness is present if: 
 The values of mean, median and mode do not coincide. 
 When the data are plotted on a graph they do not give the normal bell 
shaped form i.e. when cut along a vertical line through the centre the 
two halves are not equal. 
 The sum of the positive deviations from the median is not equal to the 
sum of the negative deviations. 
 Quartiles are not equidistant from the median. 
 Frequencies are not equally distributed at points of equal deviation 
from the mode.
There are four measures of skewness. The measures of skewness are: 
 Karl Pearson's Coefficient of skewness 
 Bowley’s Coefficient of skewness 
 Kelly’s Coefficient of skewness
The formula for measuring skewness as given by Karl Pearson is as follows 
Where, 
SKP = Mean – Mode 
σ 
SKP = Karl Pearson's Coefficient of skewness, 
σ = standard deviation
In case the mode is indeterminate, the coefficient of skewness is: 
SKP = Mean – (3 Median - 2 Mean) 
Now this formula is equal to 
σ 
SKP = 3(Mean - Median) 
σ 
The value of coefficient of skewness is zero, when the distribution is 
symmetrical. 
Normally, this coefficient of skewness lies between +1. If the mean is 
greater than the mode, then the coefficient of skewness will be positive, 
otherwise negative.
Bowley developed a measure of skewness, which is based on quartile 
values. The formula for measuring skewness is: 
Where, 
SKB = (Q3 – Q2) – (Q2 – Q1) 
(Q3 – Q1) 
SKB = Bowley’s Coefficient of skewness, 
Q1 = Quartile first 
Q2 = Quartile second 
Q3 = Quartile Third
The above formula can be converted to 
SKB = Q3 + Q1 – 2Median 
(Q3 – Q1) 
The value of coefficient of skewness is zero, if it is a symmetrical 
distribution. 
if the value is greater than zero, it is positively skewed and if the value 
is less than zero, it is negatively skewed distribution.
Kelly developed another measure of skewness, which is based on 
percentiles and deciles. The formula for measuring skewness is as 
follows: 
Based on Percentile 
Where, 
SKk = P90 – 2P50 + P10 
P90 – P10 
SKK = Kelly’s Coefficient of skewness, 
P90 = Percentile Ninety. 
P50 = Percentile Fifty. 
P10 = Percentile Ten.
Based on Deciles 
Where, 
SKk = D9 – 2D5 + D1 
SKK = Kelly’s Coefficient of skewness, 
D9 = Deciles Nine. 
D5 = Deciles Five. 
D1 = Deciles one. 
D9 – D1
In mechanics, the term moment is used to denote the rotating effect of 
a force. In Statistics, it is used to indicate peculiarities of a frequency 
distribution. The utility of moments lies in the sense that they indicate 
different aspects of a given distribution. Thus, by using moments, we 
can measure the central tendency of a series, dispersion or variability, 
skewness and the peakedness of the curve. The moments about the 
actual arithmetic mean are denoted by μ. The first four moments about 
mean or central moments are as follows:
First moment μ1 = 1 Σ (X1 –X) 
N 
Second moment μ2 = 1 Σ (X1 –X) 2 
N 
Third moment μ3 = 1 Σ (X1 –X) 3 
N 
Fourth moment μ4 = 1 Σ (X1 -X) 4 
N
First moment μ1 = 1 Σf (X1 –X) 
N 
Second moment μ2 = 1 Σf (X1 –X) 2 
N 
Third moment μ3 = 1 Σf (X1 –X) 3 
N 
Fourth moment μ4 = 1 Σf (X1 -X) 4 
N
Two important constants calculated from μ2, μ3 and μ4 
are:- 
 β1 (read as beta one) 
 β2 (read as beta two) 
β1 (Beta one):- Beta one is defined as 
βis used to measures of skewness. In symmetrical distribution β1 1 
shall be zero. However, the coefficient βas a measure of skewness 
1 has serious limitations. βas a measure of skewness cannot tell us 
1 about the direction of skewness that is whether it is positive or 
negative. 
This is for the simple reason that μbeing the sum of the cubes of 
3 the deviation from the mean may be positive or negative but μ2 is 
3 
always positive. Also μ2 being the variance is always positive. 
Hence β= μ2 / μ2 is always positive. 
1 3 
2
This drawback is removed if we calculate karlpearson’s ϒ1 ( 
Pronounced as Gamma one). ϒ1 is defined as the square root of β1 that 
is 
2 = μ3 
μ2 
ϒ1 = β1 = μ3 
2 μ2 
3/2 
The sign of skewness would depend upon the value of μ3. If μ3 is 
positive we will have positive skewness and if μ3 is negative we will 
have negative skewness.
 β2 (Beta two):- 
Beta two measures Kurtosis and is defined as: 
β2 = μ4 
μ2 
2
Kurtosis is another measure of the shape of a frequency curve. 
It is a Greek word, which means bulginess. 
While skewness signifies the extent of asymmetry, kurtosis 
measures the degree of peakedness of a frequency distribution. 
Karl Pearson classified curves into three types on the basis of 
the shape of their peaks. 
These are Mesokurtic, leptokurtic and platykurtic. These three 
types of curves are shown in figure below:
Measures of Kurtosis 
Kurtosis is measured by β2, or its derivative ϒ2 
Beta two measures Kurtosis and is defined as: 
β2 = μ4 
And 
μ2 
2 
ϒ2 = β2 - 3
 In case of a normal distribution, that is, mesokurtic curve, the value 
of β2 = 3. 
 If β2 turn out to be greater than 3, the curve is called a leptokurtic 
curve and is more peaked than the normal curve. 
 When β2 is less than 3, the curve is called a platykurtic curve and is 
less peaked than the normal curve. 
 The measure of kurtosis is very helpful in the selection of an 
appropriate average. For example, for normal distribution, mean is 
most appropriate; for a leptokurtic distribution, median is most 
appropriate; and for platykurtic distribution, the quartile range is 
most appropriate

More Related Content

What's hot

What's hot (20)

Skewness
SkewnessSkewness
Skewness
 
Introduction to kurtosis
Introduction to kurtosisIntroduction to kurtosis
Introduction to kurtosis
 
Population vs sample
Population vs samplePopulation vs sample
Population vs sample
 
Sampling distribution
Sampling distributionSampling distribution
Sampling distribution
 
Skewness and Kurtosis presentation
Skewness  and Kurtosis  presentationSkewness  and Kurtosis  presentation
Skewness and Kurtosis presentation
 
Probability Theory
Probability TheoryProbability Theory
Probability Theory
 
Correlation ppt...
Correlation ppt...Correlation ppt...
Correlation ppt...
 
Skewness and kurtosis
Skewness and kurtosisSkewness and kurtosis
Skewness and kurtosis
 
Hypothesis Testing
Hypothesis TestingHypothesis Testing
Hypothesis Testing
 
Binomial distribution
Binomial distributionBinomial distribution
Binomial distribution
 
Statistics-Measures of dispersions
Statistics-Measures of dispersionsStatistics-Measures of dispersions
Statistics-Measures of dispersions
 
Skewness
Skewness Skewness
Skewness
 
Poisson distribution
Poisson distributionPoisson distribution
Poisson distribution
 
quartile deviation: An introduction
quartile deviation: An introductionquartile deviation: An introduction
quartile deviation: An introduction
 
Measures of central tendency
Measures of central tendencyMeasures of central tendency
Measures of central tendency
 
Laws of probability
Laws of probabilityLaws of probability
Laws of probability
 
Correlation analysis
Correlation analysisCorrelation analysis
Correlation analysis
 
Testing of hypothesis
Testing of hypothesisTesting of hypothesis
Testing of hypothesis
 
Binomial distribution
Binomial distributionBinomial distribution
Binomial distribution
 
Skewness
SkewnessSkewness
Skewness
 

Similar to Skewness

skewness-141018135304-conversion-gate01-converted.pptx
skewness-141018135304-conversion-gate01-converted.pptxskewness-141018135304-conversion-gate01-converted.pptx
skewness-141018135304-conversion-gate01-converted.pptxanjaliagarwal93
 
Skewness and Kurtosis via Graphical Representation.pptx
Skewness and Kurtosis via Graphical Representation.pptxSkewness and Kurtosis via Graphical Representation.pptx
Skewness and Kurtosis via Graphical Representation.pptxCHIRANTANMONDAL2
 
Thiyagu normal probability curve
Thiyagu   normal probability curveThiyagu   normal probability curve
Thiyagu normal probability curveThiyagu K
 
Npc, skewness and kurtosis
Npc, skewness and kurtosisNpc, skewness and kurtosis
Npc, skewness and kurtosisThiyagu K
 
Moments, Kurtosis N Skewness
Moments, Kurtosis N SkewnessMoments, Kurtosis N Skewness
Moments, Kurtosis N SkewnessNISHITAKALYANI
 
Measure of skewness
Measure of skewnessMeasure of skewness
Measure of skewnessathul cs
 
Normal curve in Biostatistics data inference and applications
Normal curve in Biostatistics data inference and applicationsNormal curve in Biostatistics data inference and applications
Normal curve in Biostatistics data inference and applicationsBala Vidyadhar
 
skewness and kurtosis.ppt
skewness and kurtosis.pptskewness and kurtosis.ppt
skewness and kurtosis.ppttulsiekamar
 
State presentation2
State presentation2State presentation2
State presentation2Lata Bhatta
 
Moments and its applications in environmental sciences
Moments and its applications in environmental sciencesMoments and its applications in environmental sciences
Moments and its applications in environmental sciencesAtif Nauman
 
stats-171224152124.pdf
stats-171224152124.pdfstats-171224152124.pdf
stats-171224152124.pdfssuserb5c9841
 
MOMENTS, MOMENT RATIO AND SKEWNESS
MOMENTS, MOMENT RATIO AND SKEWNESSMOMENTS, MOMENT RATIO AND SKEWNESS
MOMENTS, MOMENT RATIO AND SKEWNESSAYESHA KABEER
 

Similar to Skewness (20)

skewness-141018135304-conversion-gate01-converted.pptx
skewness-141018135304-conversion-gate01-converted.pptxskewness-141018135304-conversion-gate01-converted.pptx
skewness-141018135304-conversion-gate01-converted.pptx
 
Skewness and Kurtosis via Graphical Representation.pptx
Skewness and Kurtosis via Graphical Representation.pptxSkewness and Kurtosis via Graphical Representation.pptx
Skewness and Kurtosis via Graphical Representation.pptx
 
BS PPT.ppt
BS PPT.pptBS PPT.ppt
BS PPT.ppt
 
Skewness.pdf
Skewness.pdfSkewness.pdf
Skewness.pdf
 
Thiyagu normal probability curve
Thiyagu   normal probability curveThiyagu   normal probability curve
Thiyagu normal probability curve
 
Npc, skewness and kurtosis
Npc, skewness and kurtosisNpc, skewness and kurtosis
Npc, skewness and kurtosis
 
Moments, Kurtosis N Skewness
Moments, Kurtosis N SkewnessMoments, Kurtosis N Skewness
Moments, Kurtosis N Skewness
 
statistics
statisticsstatistics
statistics
 
Measure of skewness
Measure of skewnessMeasure of skewness
Measure of skewness
 
Measures of Skewness.pptx
Measures of Skewness.pptxMeasures of Skewness.pptx
Measures of Skewness.pptx
 
Normal curve in Biostatistics data inference and applications
Normal curve in Biostatistics data inference and applicationsNormal curve in Biostatistics data inference and applications
Normal curve in Biostatistics data inference and applications
 
skewness and kurtosis.ppt
skewness and kurtosis.pptskewness and kurtosis.ppt
skewness and kurtosis.ppt
 
State presentation2
State presentation2State presentation2
State presentation2
 
Moments and its applications in environmental sciences
Moments and its applications in environmental sciencesMoments and its applications in environmental sciences
Moments and its applications in environmental sciences
 
Qm 4 20100905
Qm 4 20100905Qm 4 20100905
Qm 4 20100905
 
stats-171224152124.pdf
stats-171224152124.pdfstats-171224152124.pdf
stats-171224152124.pdf
 
wk-2.pptx
wk-2.pptxwk-2.pptx
wk-2.pptx
 
MOMENTS, MOMENT RATIO AND SKEWNESS
MOMENTS, MOMENT RATIO AND SKEWNESSMOMENTS, MOMENT RATIO AND SKEWNESS
MOMENTS, MOMENT RATIO AND SKEWNESS
 
Dispersion
DispersionDispersion
Dispersion
 
measures of asymmetry.pdf
measures of asymmetry.pdfmeasures of asymmetry.pdf
measures of asymmetry.pdf
 

Recently uploaded

ECONOMIC CONTEXT - LONG FORM TV DRAMA - PPT
ECONOMIC CONTEXT - LONG FORM TV DRAMA - PPTECONOMIC CONTEXT - LONG FORM TV DRAMA - PPT
ECONOMIC CONTEXT - LONG FORM TV DRAMA - PPTiammrhaywood
 
Capitol Tech U Doctoral Presentation - April 2024.pptx
Capitol Tech U Doctoral Presentation - April 2024.pptxCapitol Tech U Doctoral Presentation - April 2024.pptx
Capitol Tech U Doctoral Presentation - April 2024.pptxCapitolTechU
 
18-04-UA_REPORT_MEDIALITERAСY_INDEX-DM_23-1-final-eng.pdf
18-04-UA_REPORT_MEDIALITERAСY_INDEX-DM_23-1-final-eng.pdf18-04-UA_REPORT_MEDIALITERAСY_INDEX-DM_23-1-final-eng.pdf
18-04-UA_REPORT_MEDIALITERAСY_INDEX-DM_23-1-final-eng.pdfssuser54595a
 
Final demo Grade 9 for demo Plan dessert.pptx
Final demo Grade 9 for demo Plan dessert.pptxFinal demo Grade 9 for demo Plan dessert.pptx
Final demo Grade 9 for demo Plan dessert.pptxAvyJaneVismanos
 
Introduction to ArtificiaI Intelligence in Higher Education
Introduction to ArtificiaI Intelligence in Higher EducationIntroduction to ArtificiaI Intelligence in Higher Education
Introduction to ArtificiaI Intelligence in Higher Educationpboyjonauth
 
Proudly South Africa powerpoint Thorisha.pptx
Proudly South Africa powerpoint Thorisha.pptxProudly South Africa powerpoint Thorisha.pptx
Proudly South Africa powerpoint Thorisha.pptxthorishapillay1
 
Framing an Appropriate Research Question 6b9b26d93da94caf993c038d9efcdedb.pdf
Framing an Appropriate Research Question 6b9b26d93da94caf993c038d9efcdedb.pdfFraming an Appropriate Research Question 6b9b26d93da94caf993c038d9efcdedb.pdf
Framing an Appropriate Research Question 6b9b26d93da94caf993c038d9efcdedb.pdfUjwalaBharambe
 
CELL CYCLE Division Science 8 quarter IV.pptx
CELL CYCLE Division Science 8 quarter IV.pptxCELL CYCLE Division Science 8 quarter IV.pptx
CELL CYCLE Division Science 8 quarter IV.pptxJiesonDelaCerna
 
Meghan Sutherland In Media Res Media Component
Meghan Sutherland In Media Res Media ComponentMeghan Sutherland In Media Res Media Component
Meghan Sutherland In Media Res Media ComponentInMediaRes1
 
Like-prefer-love -hate+verb+ing & silent letters & citizenship text.pdf
Like-prefer-love -hate+verb+ing & silent letters & citizenship text.pdfLike-prefer-love -hate+verb+ing & silent letters & citizenship text.pdf
Like-prefer-love -hate+verb+ing & silent letters & citizenship text.pdfMr Bounab Samir
 
AmericanHighSchoolsprezentacijaoskolama.
AmericanHighSchoolsprezentacijaoskolama.AmericanHighSchoolsprezentacijaoskolama.
AmericanHighSchoolsprezentacijaoskolama.arsicmarija21
 
Painted Grey Ware.pptx, PGW Culture of India
Painted Grey Ware.pptx, PGW Culture of IndiaPainted Grey Ware.pptx, PGW Culture of India
Painted Grey Ware.pptx, PGW Culture of IndiaVirag Sontakke
 
MICROBIOLOGY biochemical test detailed.pptx
MICROBIOLOGY biochemical test detailed.pptxMICROBIOLOGY biochemical test detailed.pptx
MICROBIOLOGY biochemical test detailed.pptxabhijeetpadhi001
 
How to Configure Email Server in Odoo 17
How to Configure Email Server in Odoo 17How to Configure Email Server in Odoo 17
How to Configure Email Server in Odoo 17Celine George
 
Roles & Responsibilities in Pharmacovigilance
Roles & Responsibilities in PharmacovigilanceRoles & Responsibilities in Pharmacovigilance
Roles & Responsibilities in PharmacovigilanceSamikshaHamane
 
Difference Between Search & Browse Methods in Odoo 17
Difference Between Search & Browse Methods in Odoo 17Difference Between Search & Browse Methods in Odoo 17
Difference Between Search & Browse Methods in Odoo 17Celine George
 
Solving Puzzles Benefits Everyone (English).pptx
Solving Puzzles Benefits Everyone (English).pptxSolving Puzzles Benefits Everyone (English).pptx
Solving Puzzles Benefits Everyone (English).pptxOH TEIK BIN
 
MARGINALIZATION (Different learners in Marginalized Group
MARGINALIZATION (Different learners in Marginalized GroupMARGINALIZATION (Different learners in Marginalized Group
MARGINALIZATION (Different learners in Marginalized GroupJonathanParaisoCruz
 

Recently uploaded (20)

ECONOMIC CONTEXT - LONG FORM TV DRAMA - PPT
ECONOMIC CONTEXT - LONG FORM TV DRAMA - PPTECONOMIC CONTEXT - LONG FORM TV DRAMA - PPT
ECONOMIC CONTEXT - LONG FORM TV DRAMA - PPT
 
9953330565 Low Rate Call Girls In Rohini Delhi NCR
9953330565 Low Rate Call Girls In Rohini  Delhi NCR9953330565 Low Rate Call Girls In Rohini  Delhi NCR
9953330565 Low Rate Call Girls In Rohini Delhi NCR
 
Capitol Tech U Doctoral Presentation - April 2024.pptx
Capitol Tech U Doctoral Presentation - April 2024.pptxCapitol Tech U Doctoral Presentation - April 2024.pptx
Capitol Tech U Doctoral Presentation - April 2024.pptx
 
18-04-UA_REPORT_MEDIALITERAСY_INDEX-DM_23-1-final-eng.pdf
18-04-UA_REPORT_MEDIALITERAСY_INDEX-DM_23-1-final-eng.pdf18-04-UA_REPORT_MEDIALITERAСY_INDEX-DM_23-1-final-eng.pdf
18-04-UA_REPORT_MEDIALITERAСY_INDEX-DM_23-1-final-eng.pdf
 
Final demo Grade 9 for demo Plan dessert.pptx
Final demo Grade 9 for demo Plan dessert.pptxFinal demo Grade 9 for demo Plan dessert.pptx
Final demo Grade 9 for demo Plan dessert.pptx
 
Introduction to ArtificiaI Intelligence in Higher Education
Introduction to ArtificiaI Intelligence in Higher EducationIntroduction to ArtificiaI Intelligence in Higher Education
Introduction to ArtificiaI Intelligence in Higher Education
 
Proudly South Africa powerpoint Thorisha.pptx
Proudly South Africa powerpoint Thorisha.pptxProudly South Africa powerpoint Thorisha.pptx
Proudly South Africa powerpoint Thorisha.pptx
 
Framing an Appropriate Research Question 6b9b26d93da94caf993c038d9efcdedb.pdf
Framing an Appropriate Research Question 6b9b26d93da94caf993c038d9efcdedb.pdfFraming an Appropriate Research Question 6b9b26d93da94caf993c038d9efcdedb.pdf
Framing an Appropriate Research Question 6b9b26d93da94caf993c038d9efcdedb.pdf
 
CELL CYCLE Division Science 8 quarter IV.pptx
CELL CYCLE Division Science 8 quarter IV.pptxCELL CYCLE Division Science 8 quarter IV.pptx
CELL CYCLE Division Science 8 quarter IV.pptx
 
Meghan Sutherland In Media Res Media Component
Meghan Sutherland In Media Res Media ComponentMeghan Sutherland In Media Res Media Component
Meghan Sutherland In Media Res Media Component
 
Like-prefer-love -hate+verb+ing & silent letters & citizenship text.pdf
Like-prefer-love -hate+verb+ing & silent letters & citizenship text.pdfLike-prefer-love -hate+verb+ing & silent letters & citizenship text.pdf
Like-prefer-love -hate+verb+ing & silent letters & citizenship text.pdf
 
AmericanHighSchoolsprezentacijaoskolama.
AmericanHighSchoolsprezentacijaoskolama.AmericanHighSchoolsprezentacijaoskolama.
AmericanHighSchoolsprezentacijaoskolama.
 
Painted Grey Ware.pptx, PGW Culture of India
Painted Grey Ware.pptx, PGW Culture of IndiaPainted Grey Ware.pptx, PGW Culture of India
Painted Grey Ware.pptx, PGW Culture of India
 
MICROBIOLOGY biochemical test detailed.pptx
MICROBIOLOGY biochemical test detailed.pptxMICROBIOLOGY biochemical test detailed.pptx
MICROBIOLOGY biochemical test detailed.pptx
 
Model Call Girl in Bikash Puri Delhi reach out to us at 🔝9953056974🔝
Model Call Girl in Bikash Puri  Delhi reach out to us at 🔝9953056974🔝Model Call Girl in Bikash Puri  Delhi reach out to us at 🔝9953056974🔝
Model Call Girl in Bikash Puri Delhi reach out to us at 🔝9953056974🔝
 
How to Configure Email Server in Odoo 17
How to Configure Email Server in Odoo 17How to Configure Email Server in Odoo 17
How to Configure Email Server in Odoo 17
 
Roles & Responsibilities in Pharmacovigilance
Roles & Responsibilities in PharmacovigilanceRoles & Responsibilities in Pharmacovigilance
Roles & Responsibilities in Pharmacovigilance
 
Difference Between Search & Browse Methods in Odoo 17
Difference Between Search & Browse Methods in Odoo 17Difference Between Search & Browse Methods in Odoo 17
Difference Between Search & Browse Methods in Odoo 17
 
Solving Puzzles Benefits Everyone (English).pptx
Solving Puzzles Benefits Everyone (English).pptxSolving Puzzles Benefits Everyone (English).pptx
Solving Puzzles Benefits Everyone (English).pptx
 
MARGINALIZATION (Different learners in Marginalized Group
MARGINALIZATION (Different learners in Marginalized GroupMARGINALIZATION (Different learners in Marginalized Group
MARGINALIZATION (Different learners in Marginalized Group
 

Skewness

  • 1. Prof. Rajkumar Teotia Institute of Advanced Management and Research (IAMR) Address: 9th Km Stone, NH-58, Delhi-Meerut Road, Duhai,Ghaziabad (U.P) - 201206 Ph:0120-2675904/905 Mob:9999052997 Fax: 0120-2679145 e mail: rajkumarteotia@iamrindia.com
  • 2.
  • 3. A distribution is said to be 'skewed' when the mean and the median fall at different points in the distribution, and the balance (or centre of gravity) is shifted to one side or the other-to left or right. Measures of skewness tell us the direction and the extent of Skewness. In symmetrical distribution the mean, median and mode are identical. The more the mean moves away from the mode, the larger the asymmetry or skewness
  • 4. A frequency distribution is said to be symmetrical if the frequencies are equally distributed on both the sides of central value. A symmetrical distribution may be either bell – shaped or U shaped. 1- Bell – shaped or unimodel Symmetrical Distribution A symmetrical distribution is bell – shaped if the frequencies are first steadily rise and then steadily fall. There is only one mode and the values of mean, median and mode are equal. Mean = Median = Mode
  • 5. A frequency distribution is said to be skewed if the frequencies are not equally distributed on both the sides of the central value. A skewed distribution may be • Positively Skewed • Negatively Skewed • ‘L’ shaped positively skewed • ‘J’ shaped negatively skewed
  • 6. Positively skewed Mean ˃ Median ˃ Mode
  • 7. Negatively skewed Mean ˂ Median ˂ Mode
  • 8. ‘L’ Shaped Positively skewed Mean ˂ Mode Mean ˂ Median
  • 9. ‘J’ Shaped Negatively Skewed Mean ˃ Mode Mean ˃ Median
  • 10. In order to ascertain whether a distribution is skewed or not the following tests may be applied. Skewness is present if:  The values of mean, median and mode do not coincide.  When the data are plotted on a graph they do not give the normal bell shaped form i.e. when cut along a vertical line through the centre the two halves are not equal.  The sum of the positive deviations from the median is not equal to the sum of the negative deviations.  Quartiles are not equidistant from the median.  Frequencies are not equally distributed at points of equal deviation from the mode.
  • 11. There are four measures of skewness. The measures of skewness are:  Karl Pearson's Coefficient of skewness  Bowley’s Coefficient of skewness  Kelly’s Coefficient of skewness
  • 12. The formula for measuring skewness as given by Karl Pearson is as follows Where, SKP = Mean – Mode σ SKP = Karl Pearson's Coefficient of skewness, σ = standard deviation
  • 13. In case the mode is indeterminate, the coefficient of skewness is: SKP = Mean – (3 Median - 2 Mean) Now this formula is equal to σ SKP = 3(Mean - Median) σ The value of coefficient of skewness is zero, when the distribution is symmetrical. Normally, this coefficient of skewness lies between +1. If the mean is greater than the mode, then the coefficient of skewness will be positive, otherwise negative.
  • 14. Bowley developed a measure of skewness, which is based on quartile values. The formula for measuring skewness is: Where, SKB = (Q3 – Q2) – (Q2 – Q1) (Q3 – Q1) SKB = Bowley’s Coefficient of skewness, Q1 = Quartile first Q2 = Quartile second Q3 = Quartile Third
  • 15. The above formula can be converted to SKB = Q3 + Q1 – 2Median (Q3 – Q1) The value of coefficient of skewness is zero, if it is a symmetrical distribution. if the value is greater than zero, it is positively skewed and if the value is less than zero, it is negatively skewed distribution.
  • 16. Kelly developed another measure of skewness, which is based on percentiles and deciles. The formula for measuring skewness is as follows: Based on Percentile Where, SKk = P90 – 2P50 + P10 P90 – P10 SKK = Kelly’s Coefficient of skewness, P90 = Percentile Ninety. P50 = Percentile Fifty. P10 = Percentile Ten.
  • 17. Based on Deciles Where, SKk = D9 – 2D5 + D1 SKK = Kelly’s Coefficient of skewness, D9 = Deciles Nine. D5 = Deciles Five. D1 = Deciles one. D9 – D1
  • 18. In mechanics, the term moment is used to denote the rotating effect of a force. In Statistics, it is used to indicate peculiarities of a frequency distribution. The utility of moments lies in the sense that they indicate different aspects of a given distribution. Thus, by using moments, we can measure the central tendency of a series, dispersion or variability, skewness and the peakedness of the curve. The moments about the actual arithmetic mean are denoted by μ. The first four moments about mean or central moments are as follows:
  • 19. First moment μ1 = 1 Σ (X1 –X) N Second moment μ2 = 1 Σ (X1 –X) 2 N Third moment μ3 = 1 Σ (X1 –X) 3 N Fourth moment μ4 = 1 Σ (X1 -X) 4 N
  • 20. First moment μ1 = 1 Σf (X1 –X) N Second moment μ2 = 1 Σf (X1 –X) 2 N Third moment μ3 = 1 Σf (X1 –X) 3 N Fourth moment μ4 = 1 Σf (X1 -X) 4 N
  • 21. Two important constants calculated from μ2, μ3 and μ4 are:-  β1 (read as beta one)  β2 (read as beta two) β1 (Beta one):- Beta one is defined as βis used to measures of skewness. In symmetrical distribution β1 1 shall be zero. However, the coefficient βas a measure of skewness 1 has serious limitations. βas a measure of skewness cannot tell us 1 about the direction of skewness that is whether it is positive or negative. This is for the simple reason that μbeing the sum of the cubes of 3 the deviation from the mean may be positive or negative but μ2 is 3 always positive. Also μ2 being the variance is always positive. Hence β= μ2 / μ2 is always positive. 1 3 2
  • 22. This drawback is removed if we calculate karlpearson’s ϒ1 ( Pronounced as Gamma one). ϒ1 is defined as the square root of β1 that is 2 = μ3 μ2 ϒ1 = β1 = μ3 2 μ2 3/2 The sign of skewness would depend upon the value of μ3. If μ3 is positive we will have positive skewness and if μ3 is negative we will have negative skewness.
  • 23.  β2 (Beta two):- Beta two measures Kurtosis and is defined as: β2 = μ4 μ2 2
  • 24. Kurtosis is another measure of the shape of a frequency curve. It is a Greek word, which means bulginess. While skewness signifies the extent of asymmetry, kurtosis measures the degree of peakedness of a frequency distribution. Karl Pearson classified curves into three types on the basis of the shape of their peaks. These are Mesokurtic, leptokurtic and platykurtic. These three types of curves are shown in figure below:
  • 25.
  • 26. Measures of Kurtosis Kurtosis is measured by β2, or its derivative ϒ2 Beta two measures Kurtosis and is defined as: β2 = μ4 And μ2 2 ϒ2 = β2 - 3
  • 27.  In case of a normal distribution, that is, mesokurtic curve, the value of β2 = 3.  If β2 turn out to be greater than 3, the curve is called a leptokurtic curve and is more peaked than the normal curve.  When β2 is less than 3, the curve is called a platykurtic curve and is less peaked than the normal curve.  The measure of kurtosis is very helpful in the selection of an appropriate average. For example, for normal distribution, mean is most appropriate; for a leptokurtic distribution, median is most appropriate; and for platykurtic distribution, the quartile range is most appropriate