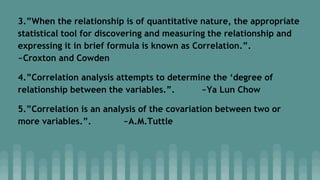
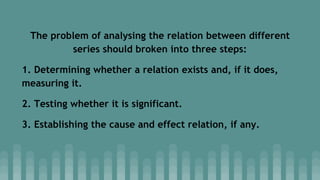
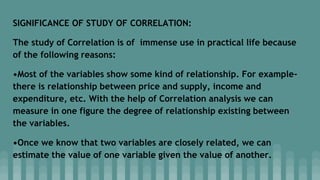
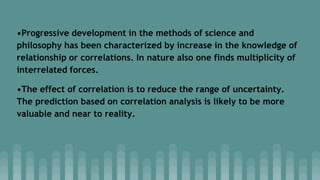
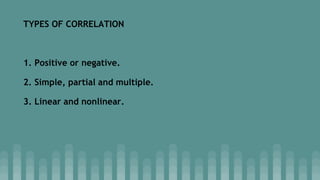
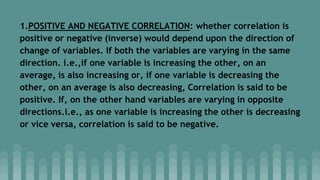
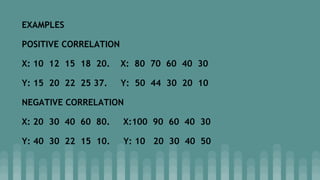
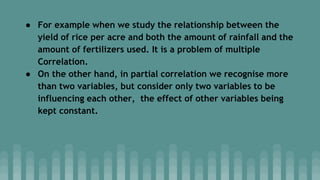
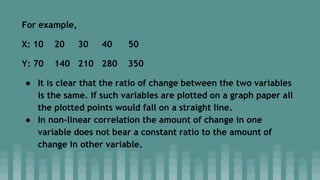
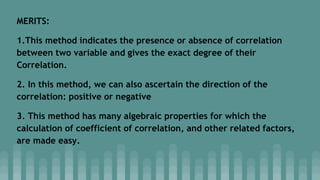
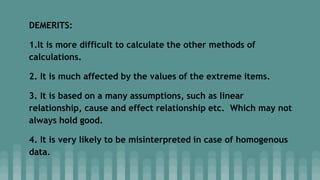
DESCRIPTIVE STUDIES-
CORRELATION STUDIES
SALMA ASGHAR
M.Sc (Nutrition and Dietetics)
RESEARCH METHODOLOGY
DESCRIPTIVE STUDIES
Meaning: Descriptive study is a fact-finding investigation with
adequate interpretation.
•It type of research.
•It is more specific than an exploratory study, as it has on
particular aspects or dimensions of the problem studied.
•It is designed to gather descriptive information and provides
information for formulating more sophisticated studies.
•Data are collected by using one or more appropriate methods.
Objective: A descriptive study aims at
identifying the various characteristics of a
community or institution or problem under
study, but it does not deal with the testing of
proposition or hypothesis.
CORRELATION STUDIES-
INTRODUCTION: The correlation analysis refers to the techniques
used in measuring the closeness of the relationship between the
variables.
DEFINITION:
1.”Correlation analysis deals with the association between two or
more variables.”. ~Simpson and Kafka
2.”If two or more quantities vary in sympathy so that movements
in one tend to be accompanied by corresponding movements in the
others, then they are said to be correlated.”. ~L.R.Conner
3.”When the relationship is of quantitative nature, the appropriate
statistical tool for discovering and measuring the relationship and
expressing it in brief formula is known as Correlation.”.
~Croxton and Cowden
4.”Correlation analysis attempts to determine the ‘degree of
relationship between the variables.”. ~Ya Lun Chow
5.”Correlation is an analysis of the covariation between two or
more variables.”. ~A.M.Tuttle
The problem of analysing the relation between different
series should broken into three steps:
1. Determining whether a relation exists and, if it does,
measuring it.
2. Testing whether it is significant.
3. Establishing the cause and effect relation, if any.
SIGNIFICANCE OF STUDY OF CORRELATION:
The study of Correlation is of immense use in practical life because
of the following reasons:
•Most of the variables show some kind of relationship. For example-
there is relationship between price and supply, income and
expenditure, etc. With the help of Correlation analysis we can
measure in one figure the degree of relationship existing between
the variables.
•Once we know that two variables are closely related, we can
estimate the value of one variable given the value of another.
•Progressive development in the methods of science and
philosophy has been characterized by increase in the knowledge of
relationship or correlations. In nature also one finds multiplicity of
interrelated forces.
•The effect of correlation is to reduce the range of uncertainty.
The prediction based on correlation analysis is likely to be more
valuable and near to reality.
TYPES OF CORRELATION
1. Positive or negative.
2. Simple, partial and multiple.
3. Linear and nonlinear.
1.POSITIVE AND NEGATIVE CORRELATION: whether correlation is
positive or negative (inverse) would depend upon the direction of
change of variables. If both the variables are varying in the same
direction. i.e.,if one variable is increasing the other, on an
average, is also increasing or, if one variable is decreasing the
other, on an average is also decreasing, Correlation is said to be
positive. If, on the other hand variables are varying in opposite
directions.i.e., as one variable is increasing the other is decreasing
or vice versa, correlation is said to be negative.
EXAMPLES
POSITIVE CORRELATION
X: 10 12 15 18 20. X: 80 70 60 40 30
Y: 15 20 22 25 37. Y: 50 44 30 20 10
NEGATIVE CORRELATION
X: 20 30 40 60 80. X:100 90 60 40 30
Y: 40 30 22 15 10. Y: 10 20 30 40 50
2. SIMPLE, PARTIAL AND MULTIPLE CORRELATION: The distinction
between simple, partial and multiple Correlation is based upon
the number of variables studied. When only two variables are
studied it is a problem of simple correlation. When three or more
variables are studied it is a problem of multiple or partial
correlation.
● In multiple Correlation three or more variables are studied
simultaneously.
● For example when we study the relationship between the
yield of rice per acre and both the amount of rainfall and the
amount of fertilizers used. It is a problem of multiple
Correlation.
● On the other hand, in partial correlation we recognise more
than two variables, but consider only two variables to be
influencing each other, the effect of other variables being
kept constant.
LINEAR AND NONLINEAR (CURVILINEAR) CORRELATION: The
distinction between linear and nonlinear correlation is
based upon the constancy of the ratio of change between
the variables. If the amount of change in one variable tends
to bear constant ratio to the amount of change in the other
variable then the correlation is said to be linear.
For example,
X: 10 20 30 40 50
Y: 70 140 210 280 350
● It is clear that the ratio of change between the two variables
is the same. If such variables are plotted on a graph paper all
the plotted points would fall on a straight line.
● In non-linear correlation the amount of change in one
variable does not bear a constant ratio to the amount of
change in other variable.
METHODS OF STUDYING CORRELATION
The various methods of ascertaining whether two variables are
correlated or not are:
•Scatter Diagram Method
•Graphic Method
•Karl Pearson's Coefficient of Correlation
•Concurrent Deviation Method
•Method of Least Squares..
MERITS:
1.This method indicates the presence or absence of correlation
between two variable and gives the exact degree of their
Correlation.
2. In this method, we can also ascertain the direction of the
correlation: positive or negative
3. This method has many algebraic properties for which the
calculation of coefficient of correlation, and other related factors,
are made easy.
DEMERITS:
1.It is more difficult to calculate the other methods of
calculations.
2. It is much affected by the values of the extreme items.
3. It is based on a many assumptions, such as linear
relationship, cause and effect relationship etc. Which may not
always hold good.
4. It is very likely to be misinterpreted in case of homogenous
data.
Reference:
•statistical method by S.P Gupta
•Research Methodology- methods and
techniques by C.R. Kothari
THANK YOU

Correlation Studies - Descriptive Studies

  • 1.
    DESCRIPTIVE STUDIES- CORRELATION STUDIES SALMAASGHAR M.Sc (Nutrition and Dietetics) RESEARCH METHODOLOGY
  • 2.
    DESCRIPTIVE STUDIES Meaning: Descriptivestudy is a fact-finding investigation with adequate interpretation. •It type of research. •It is more specific than an exploratory study, as it has on particular aspects or dimensions of the problem studied. •It is designed to gather descriptive information and provides information for formulating more sophisticated studies. •Data are collected by using one or more appropriate methods.
  • 3.
    Objective: A descriptivestudy aims at identifying the various characteristics of a community or institution or problem under study, but it does not deal with the testing of proposition or hypothesis.
  • 4.
    CORRELATION STUDIES- INTRODUCTION: Thecorrelation analysis refers to the techniques used in measuring the closeness of the relationship between the variables. DEFINITION: 1.”Correlation analysis deals with the association between two or more variables.”. ~Simpson and Kafka 2.”If two or more quantities vary in sympathy so that movements in one tend to be accompanied by corresponding movements in the others, then they are said to be correlated.”. ~L.R.Conner
  • 5.
    3.”When the relationshipis of quantitative nature, the appropriate statistical tool for discovering and measuring the relationship and expressing it in brief formula is known as Correlation.”. ~Croxton and Cowden 4.”Correlation analysis attempts to determine the ‘degree of relationship between the variables.”. ~Ya Lun Chow 5.”Correlation is an analysis of the covariation between two or more variables.”. ~A.M.Tuttle
  • 6.
    The problem ofanalysing the relation between different series should broken into three steps: 1. Determining whether a relation exists and, if it does, measuring it. 2. Testing whether it is significant. 3. Establishing the cause and effect relation, if any.
  • 7.
    SIGNIFICANCE OF STUDYOF CORRELATION: The study of Correlation is of immense use in practical life because of the following reasons: •Most of the variables show some kind of relationship. For example- there is relationship between price and supply, income and expenditure, etc. With the help of Correlation analysis we can measure in one figure the degree of relationship existing between the variables. •Once we know that two variables are closely related, we can estimate the value of one variable given the value of another.
  • 8.
    •Progressive development inthe methods of science and philosophy has been characterized by increase in the knowledge of relationship or correlations. In nature also one finds multiplicity of interrelated forces. •The effect of correlation is to reduce the range of uncertainty. The prediction based on correlation analysis is likely to be more valuable and near to reality.
  • 9.
    TYPES OF CORRELATION 1.Positive or negative. 2. Simple, partial and multiple. 3. Linear and nonlinear.
  • 10.
    1.POSITIVE AND NEGATIVECORRELATION: whether correlation is positive or negative (inverse) would depend upon the direction of change of variables. If both the variables are varying in the same direction. i.e.,if one variable is increasing the other, on an average, is also increasing or, if one variable is decreasing the other, on an average is also decreasing, Correlation is said to be positive. If, on the other hand variables are varying in opposite directions.i.e., as one variable is increasing the other is decreasing or vice versa, correlation is said to be negative.
  • 11.
    EXAMPLES POSITIVE CORRELATION X: 1012 15 18 20. X: 80 70 60 40 30 Y: 15 20 22 25 37. Y: 50 44 30 20 10 NEGATIVE CORRELATION X: 20 30 40 60 80. X:100 90 60 40 30 Y: 40 30 22 15 10. Y: 10 20 30 40 50
  • 12.
    2. SIMPLE, PARTIALAND MULTIPLE CORRELATION: The distinction between simple, partial and multiple Correlation is based upon the number of variables studied. When only two variables are studied it is a problem of simple correlation. When three or more variables are studied it is a problem of multiple or partial correlation. ● In multiple Correlation three or more variables are studied simultaneously.
  • 13.
    ● For examplewhen we study the relationship between the yield of rice per acre and both the amount of rainfall and the amount of fertilizers used. It is a problem of multiple Correlation. ● On the other hand, in partial correlation we recognise more than two variables, but consider only two variables to be influencing each other, the effect of other variables being kept constant.
  • 14.
    LINEAR AND NONLINEAR(CURVILINEAR) CORRELATION: The distinction between linear and nonlinear correlation is based upon the constancy of the ratio of change between the variables. If the amount of change in one variable tends to bear constant ratio to the amount of change in the other variable then the correlation is said to be linear.
  • 15.
    For example, X: 1020 30 40 50 Y: 70 140 210 280 350 ● It is clear that the ratio of change between the two variables is the same. If such variables are plotted on a graph paper all the plotted points would fall on a straight line. ● In non-linear correlation the amount of change in one variable does not bear a constant ratio to the amount of change in other variable.
  • 16.
    METHODS OF STUDYINGCORRELATION The various methods of ascertaining whether two variables are correlated or not are: •Scatter Diagram Method •Graphic Method •Karl Pearson's Coefficient of Correlation •Concurrent Deviation Method •Method of Least Squares..
  • 17.
    MERITS: 1.This method indicatesthe presence or absence of correlation between two variable and gives the exact degree of their Correlation. 2. In this method, we can also ascertain the direction of the correlation: positive or negative 3. This method has many algebraic properties for which the calculation of coefficient of correlation, and other related factors, are made easy.
  • 18.
    DEMERITS: 1.It is moredifficult to calculate the other methods of calculations. 2. It is much affected by the values of the extreme items. 3. It is based on a many assumptions, such as linear relationship, cause and effect relationship etc. Which may not always hold good. 4. It is very likely to be misinterpreted in case of homogenous data.
  • 19.
    Reference: •statistical method byS.P Gupta •Research Methodology- methods and techniques by C.R. Kothari THANK YOU