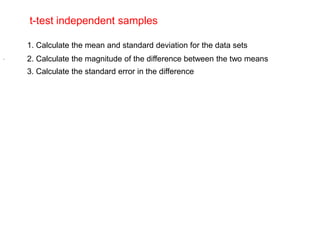
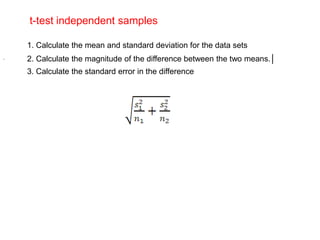
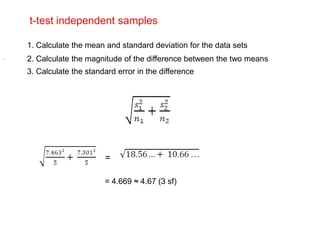
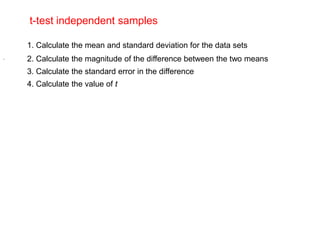
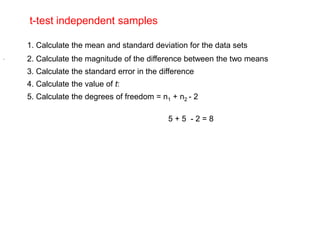
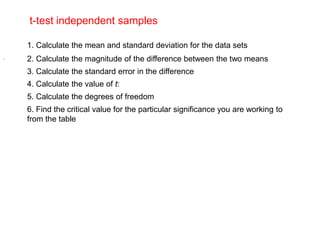
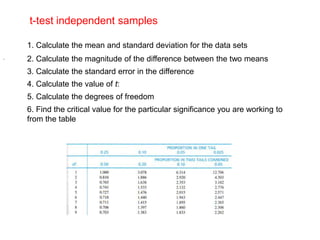
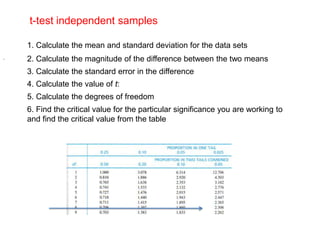
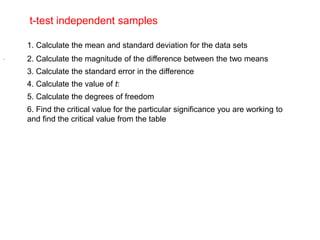
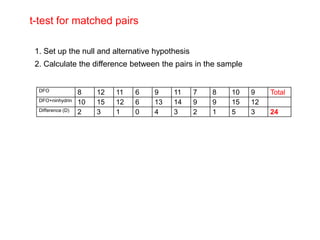
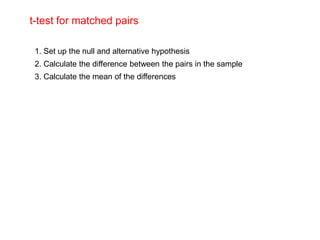
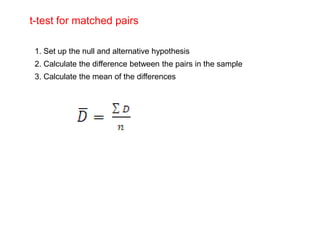
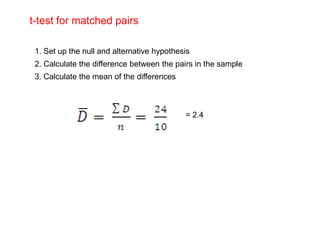
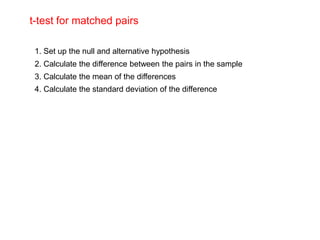
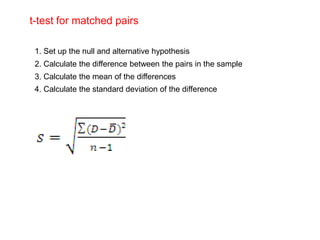
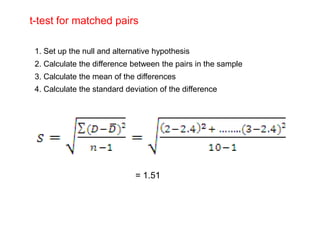
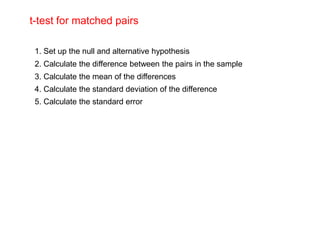
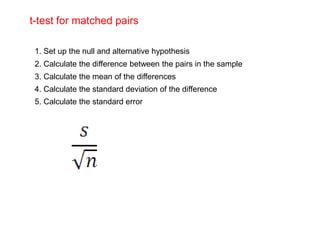
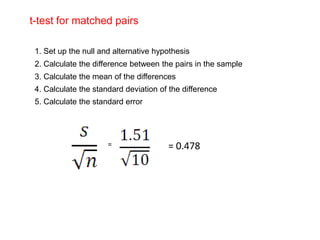
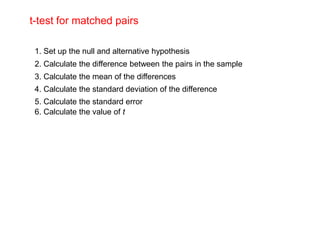
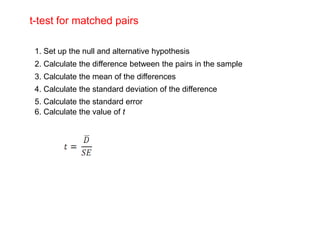
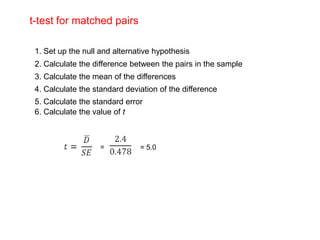
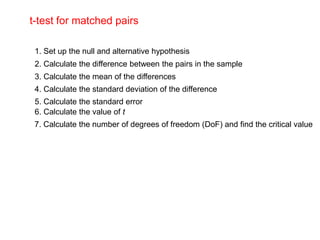
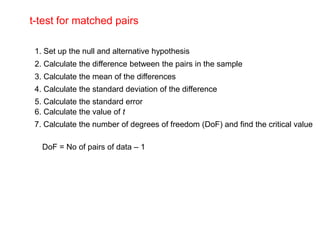
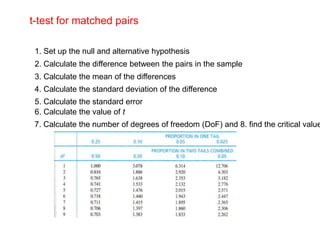
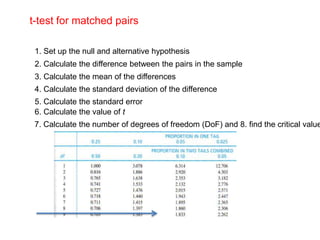
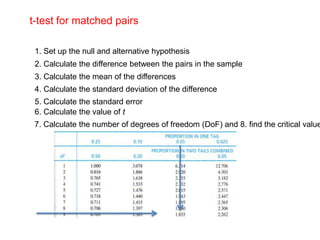
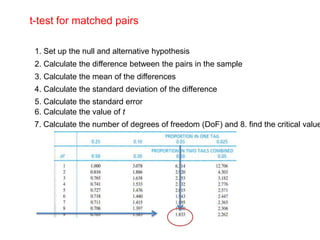
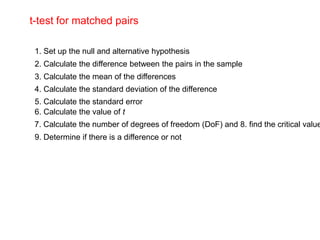
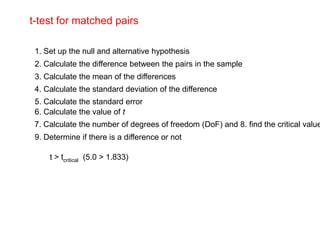
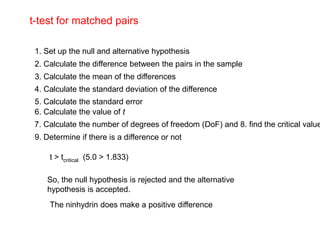
The document describes how to perform a student's t-test to compare two samples. It provides steps for both a matched pairs t-test and an independent samples t-test. For a matched pairs t-test, the steps are: 1) state the null and alternative hypotheses, 2) calculate the differences between pairs, 3) calculate the mean difference, 4) calculate the standard deviation of the differences, 5) calculate the standard error, 6) calculate the t value, 7) determine the degrees of freedom, 8) find the critical t value, and 9) determine if there is a statistically significant difference. For an independent samples t-test, similar steps are followed to calculate means, standard deviations, the difference between


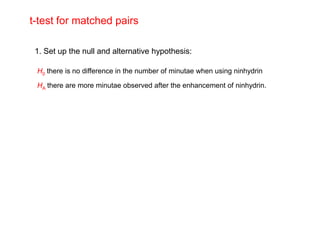
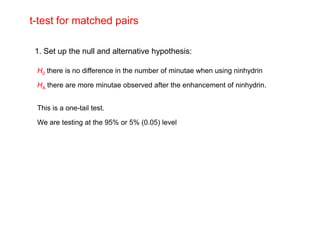

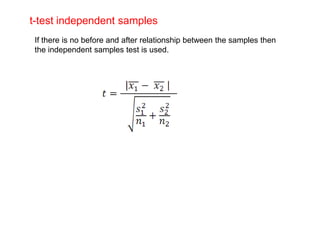
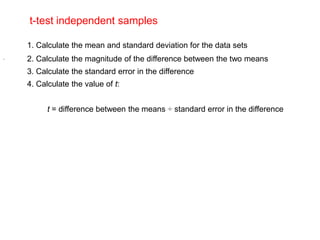
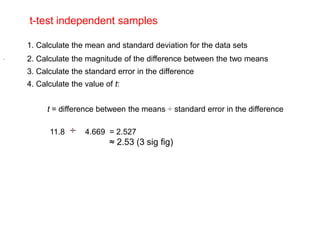
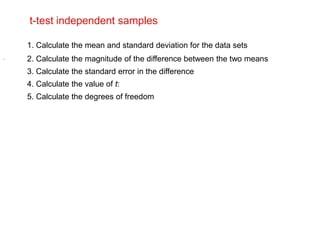
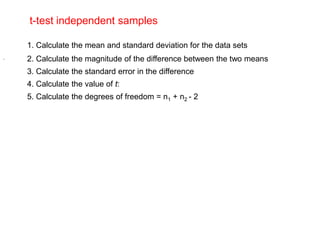
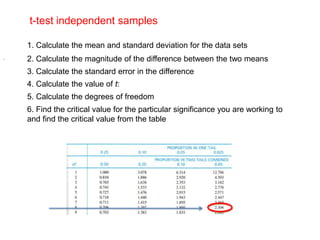
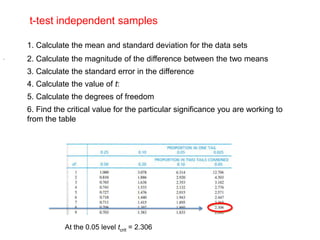
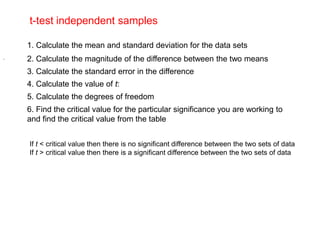
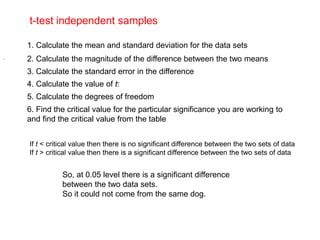
![t-test independent samples
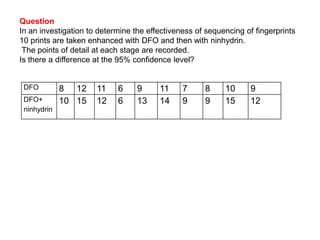
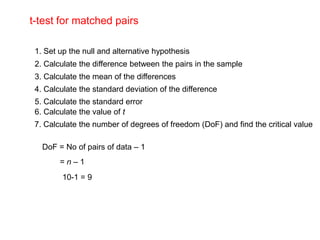
Example
Some brown dog hairs were found on the clothing of a victim at a crime scene
involving a dog.
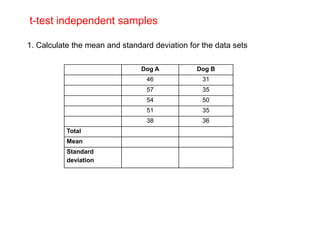
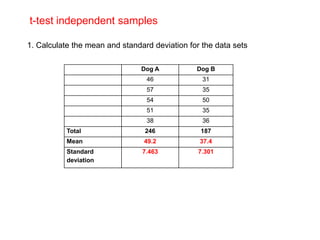
The five of the hairs were measured: 46, 57, 54, 51, 38 μm.
A suspect is the owner of a dog with similar brown hairs. A sample of the hairs
has been taken and their widths measured: 31, 35, 50, 35, 36 μm.
Is it possible that the hairs found on the victim were left by the suspect‟s dog?
Test at the %5 level.
[From D. Lucy Introduction to Statistics for Forensic Scientists Chichester: Wiley, 2005 p. 44.]](https://image.slidesharecdn.com/studentt-test2-120315062933-phpapp02/85/Student-t-test-38-320.jpg)