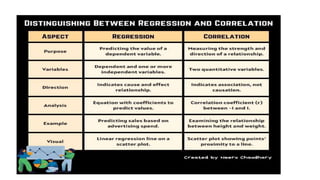
1. Correlation analyzes the relationship between two variables, determining the degree to which they change together. Regression finds the relationship between a dependent and independent variable to estimate or predict future values.
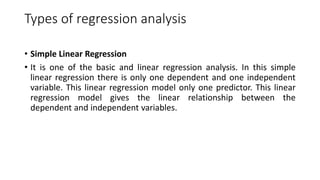
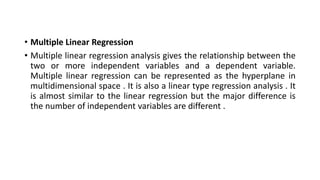
2. Simple linear regression analyzes the relationship between one dependent and one independent variable. Multiple linear regression generalizes this to multiple independent variables.
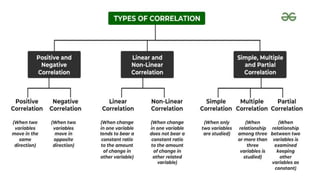
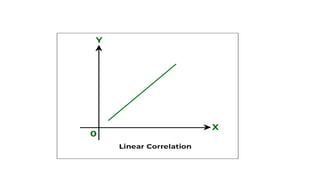
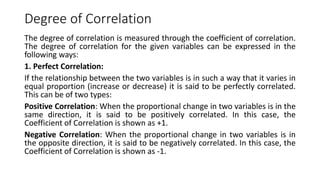
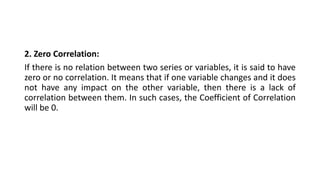
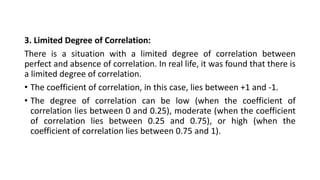
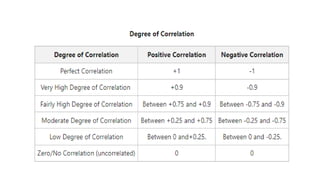
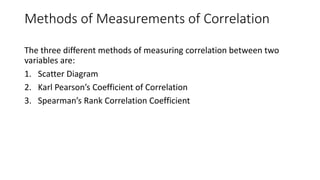
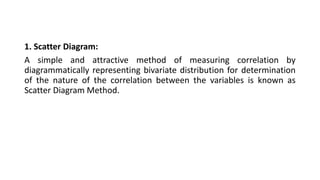
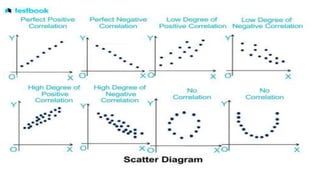
3. Correlation is measured using methods like scatter diagrams, Pearson's correlation coefficient, and Spearman's rank correlation coefficient. The degree of correlation ranges from perfect to zero.


![correlation-ppt [Autosaved].pptx statistics in BBA from parul University](https://cdn.slidesharecdn.com/ss_thumbnails/correlation-pptautosaved-240401173254-81d64a83-thumbnail.jpg?width=640&height=640&fit=bounds)


