Downloaded 1,204 times
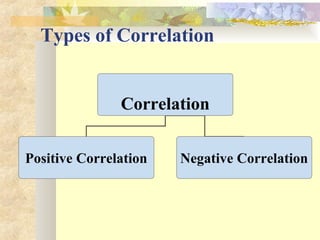
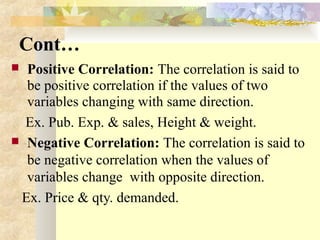
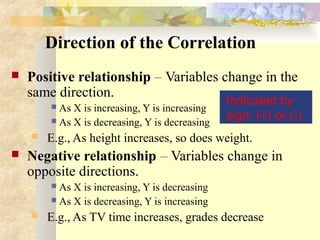
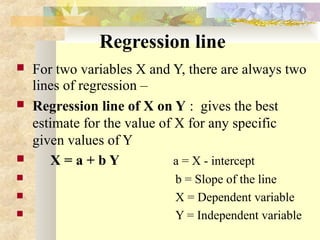
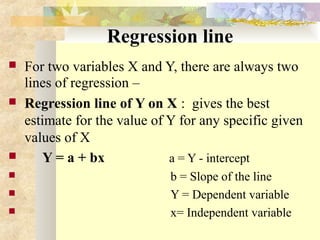
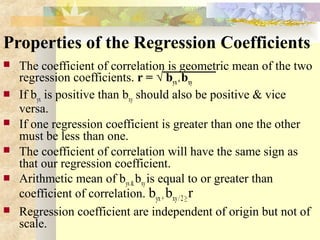
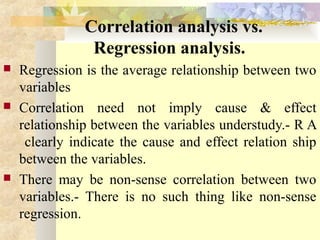

Correlation and regression analysis are statistical tools used to analyze relationships between variables. Correlation measures the strength and direction of association between two variables on a scale from -1 to 1. Regression analysis uses one variable to predict the value of another variable and draws a best-fit line to represent their relationship. There are always two lines of regression - one showing the regression of x on y and the other showing the regression of y on x. Regression coefficients from these lines indicate the slope and intercept of the lines and can help estimate unknown variable values based on known values.


![[DSC Europe 25] Predrag Maletic - Scaling AI in Banking – Our Strategic Journ...](https://cdn.slidesharecdn.com/ss_thumbnails/qu2onv0aruwlvqtygmxx-predrag-maletic-scaling-ai-in-banking-260123083019-6cf1da1d-thumbnail.jpg?width=640&height=640&fit=bounds)


![[DSC Europe 25] Josip Saban - Career building for data professionals.pptx](https://cdn.slidesharecdn.com/ss_thumbnails/zroflcttkm1vmli0txea-josip-saban-career-building-for-data-professionals-260123083019-587cdb8c-thumbnail.jpg?width=640&height=640&fit=bounds)

![[DSC Europe 25] Milos Belcevic - Product Professional's Journey to Full-Stack...](https://cdn.slidesharecdn.com/ss_thumbnails/1zovd6fgsycdg4wvgvls-milos-belcevic-product-professionals-journey-to-full-stack-product-developer-260123083019-d993120d-thumbnail.jpg?width=640&height=640&fit=bounds)