Download as PPSX, PPTX

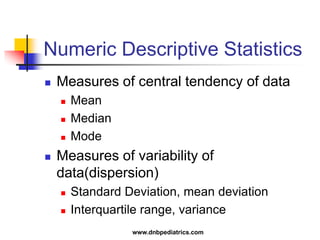
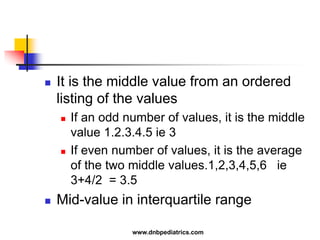
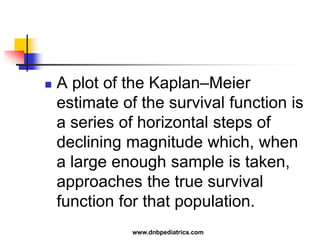
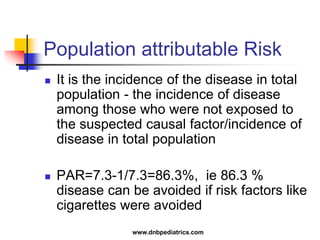
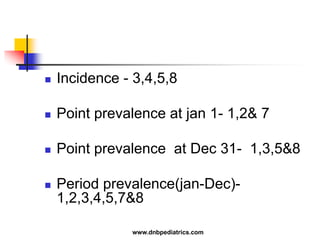


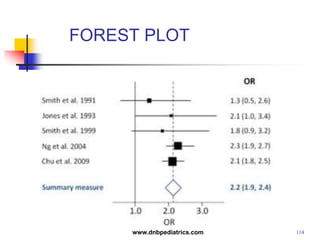
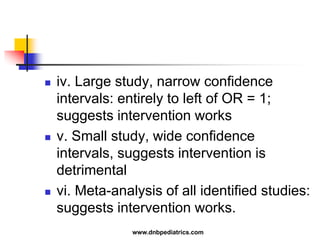
![ A forest plot (or blobbogram[1]) is a
graphical display designed to illustrate
the relative strength of treatment effects
in multiple quantitative scientific studies
addressing the same question. It was
developed for use in medical research
as a means of graphically representing a
meta-analysis of the results of
randomized controlled trials.
116www.dnbpediatrics.com](https://image.slidesharecdn.com/stat-140715083025-phpapp01/85/Stat-116-320.jpg)

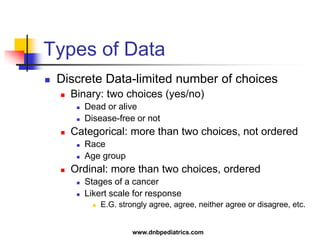
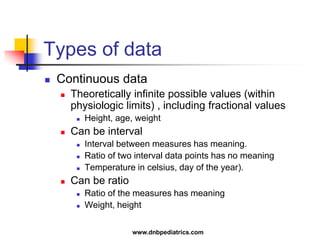
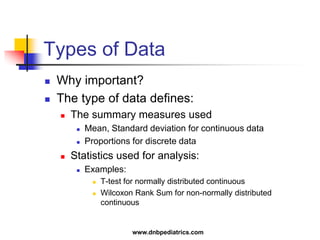
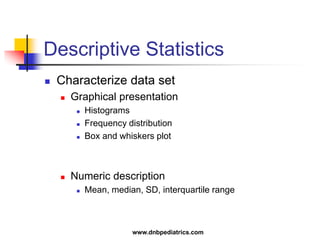
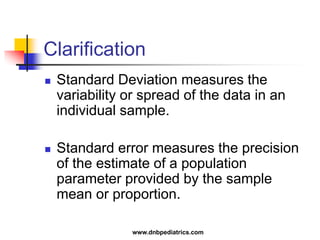
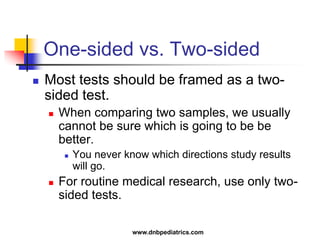
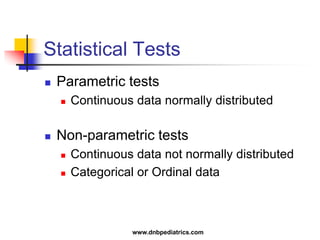
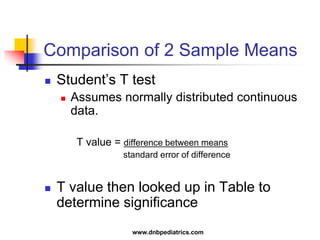
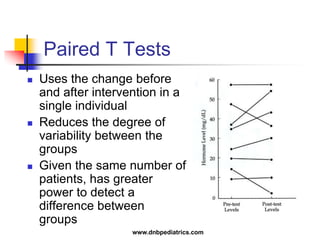
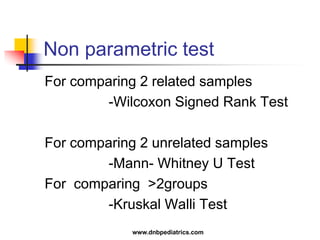
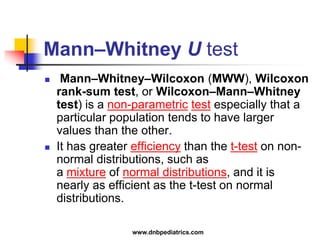
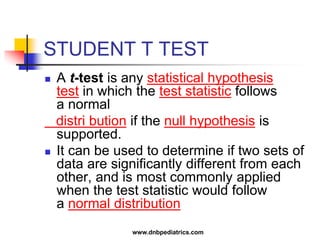
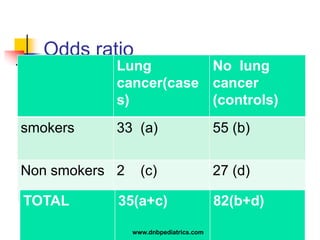
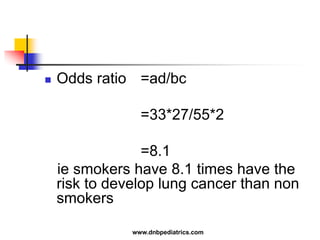
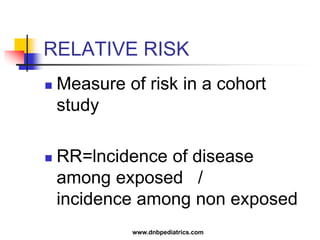
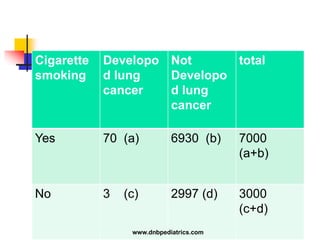
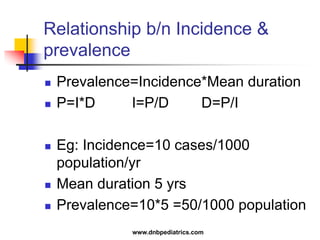
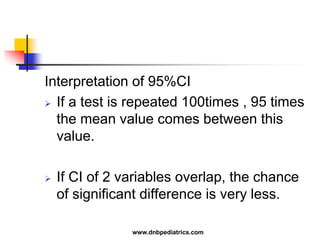
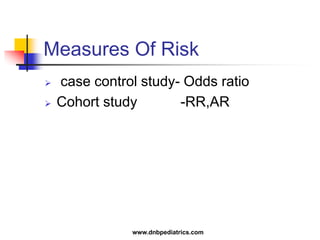
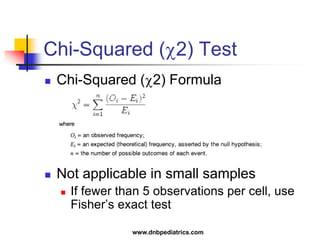
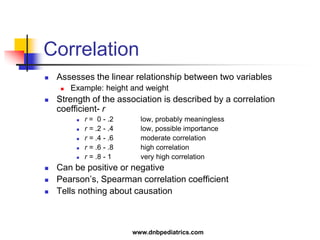
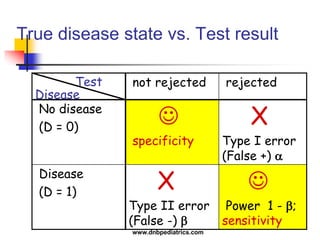
The document provides an overview of statistical methods used in clinical research. It discusses types of data, descriptive statistics, standard error, confidence intervals, hypothesis testing, errors, sample size calculations, and common statistical tests used to compare groups. Parametric tests like the t-test are used for normally distributed continuous data, while non-parametric tests like the chi-squared test and Mann-Whitney U test are used for categorical, ordinal, or non-normally distributed continuous data. Odds ratios and relative risks are discussed as measures of the strength of association between risk factors and outcomes.


