Downloaded 1,537 times

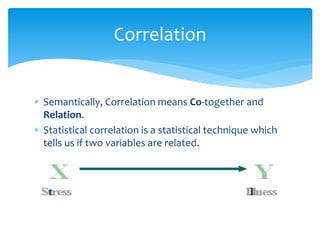
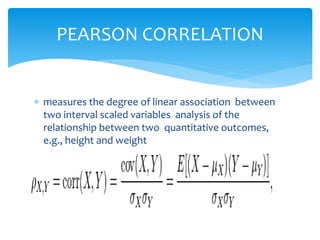
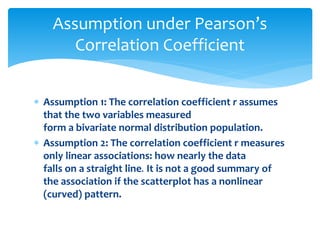
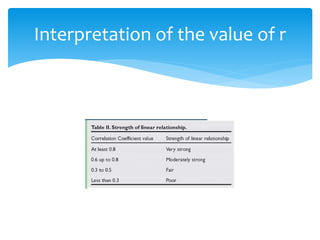
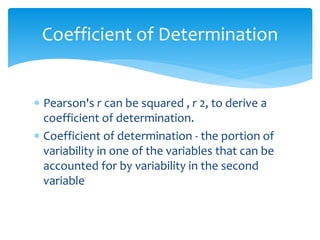
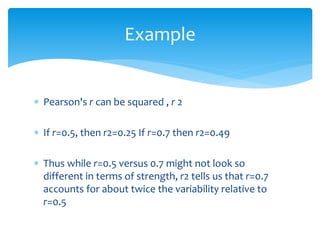
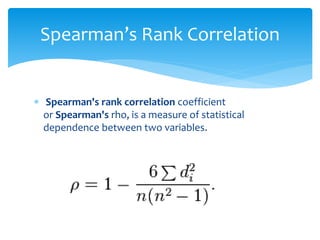


The document discusses correlation and linear regression. It defines Pearson and Spearman correlation as statistical techniques to measure the relationship between two variables. Pearson correlation measures the linear association between interval variables, while Spearman correlation measures statistical dependence between two variables using their rank order. Linear regression finds the best fit linear relationship between a dependent and independent variable to predict changes in one based on the other. The key assumptions and interpretations of correlation coefficients and regression lines are also covered.


