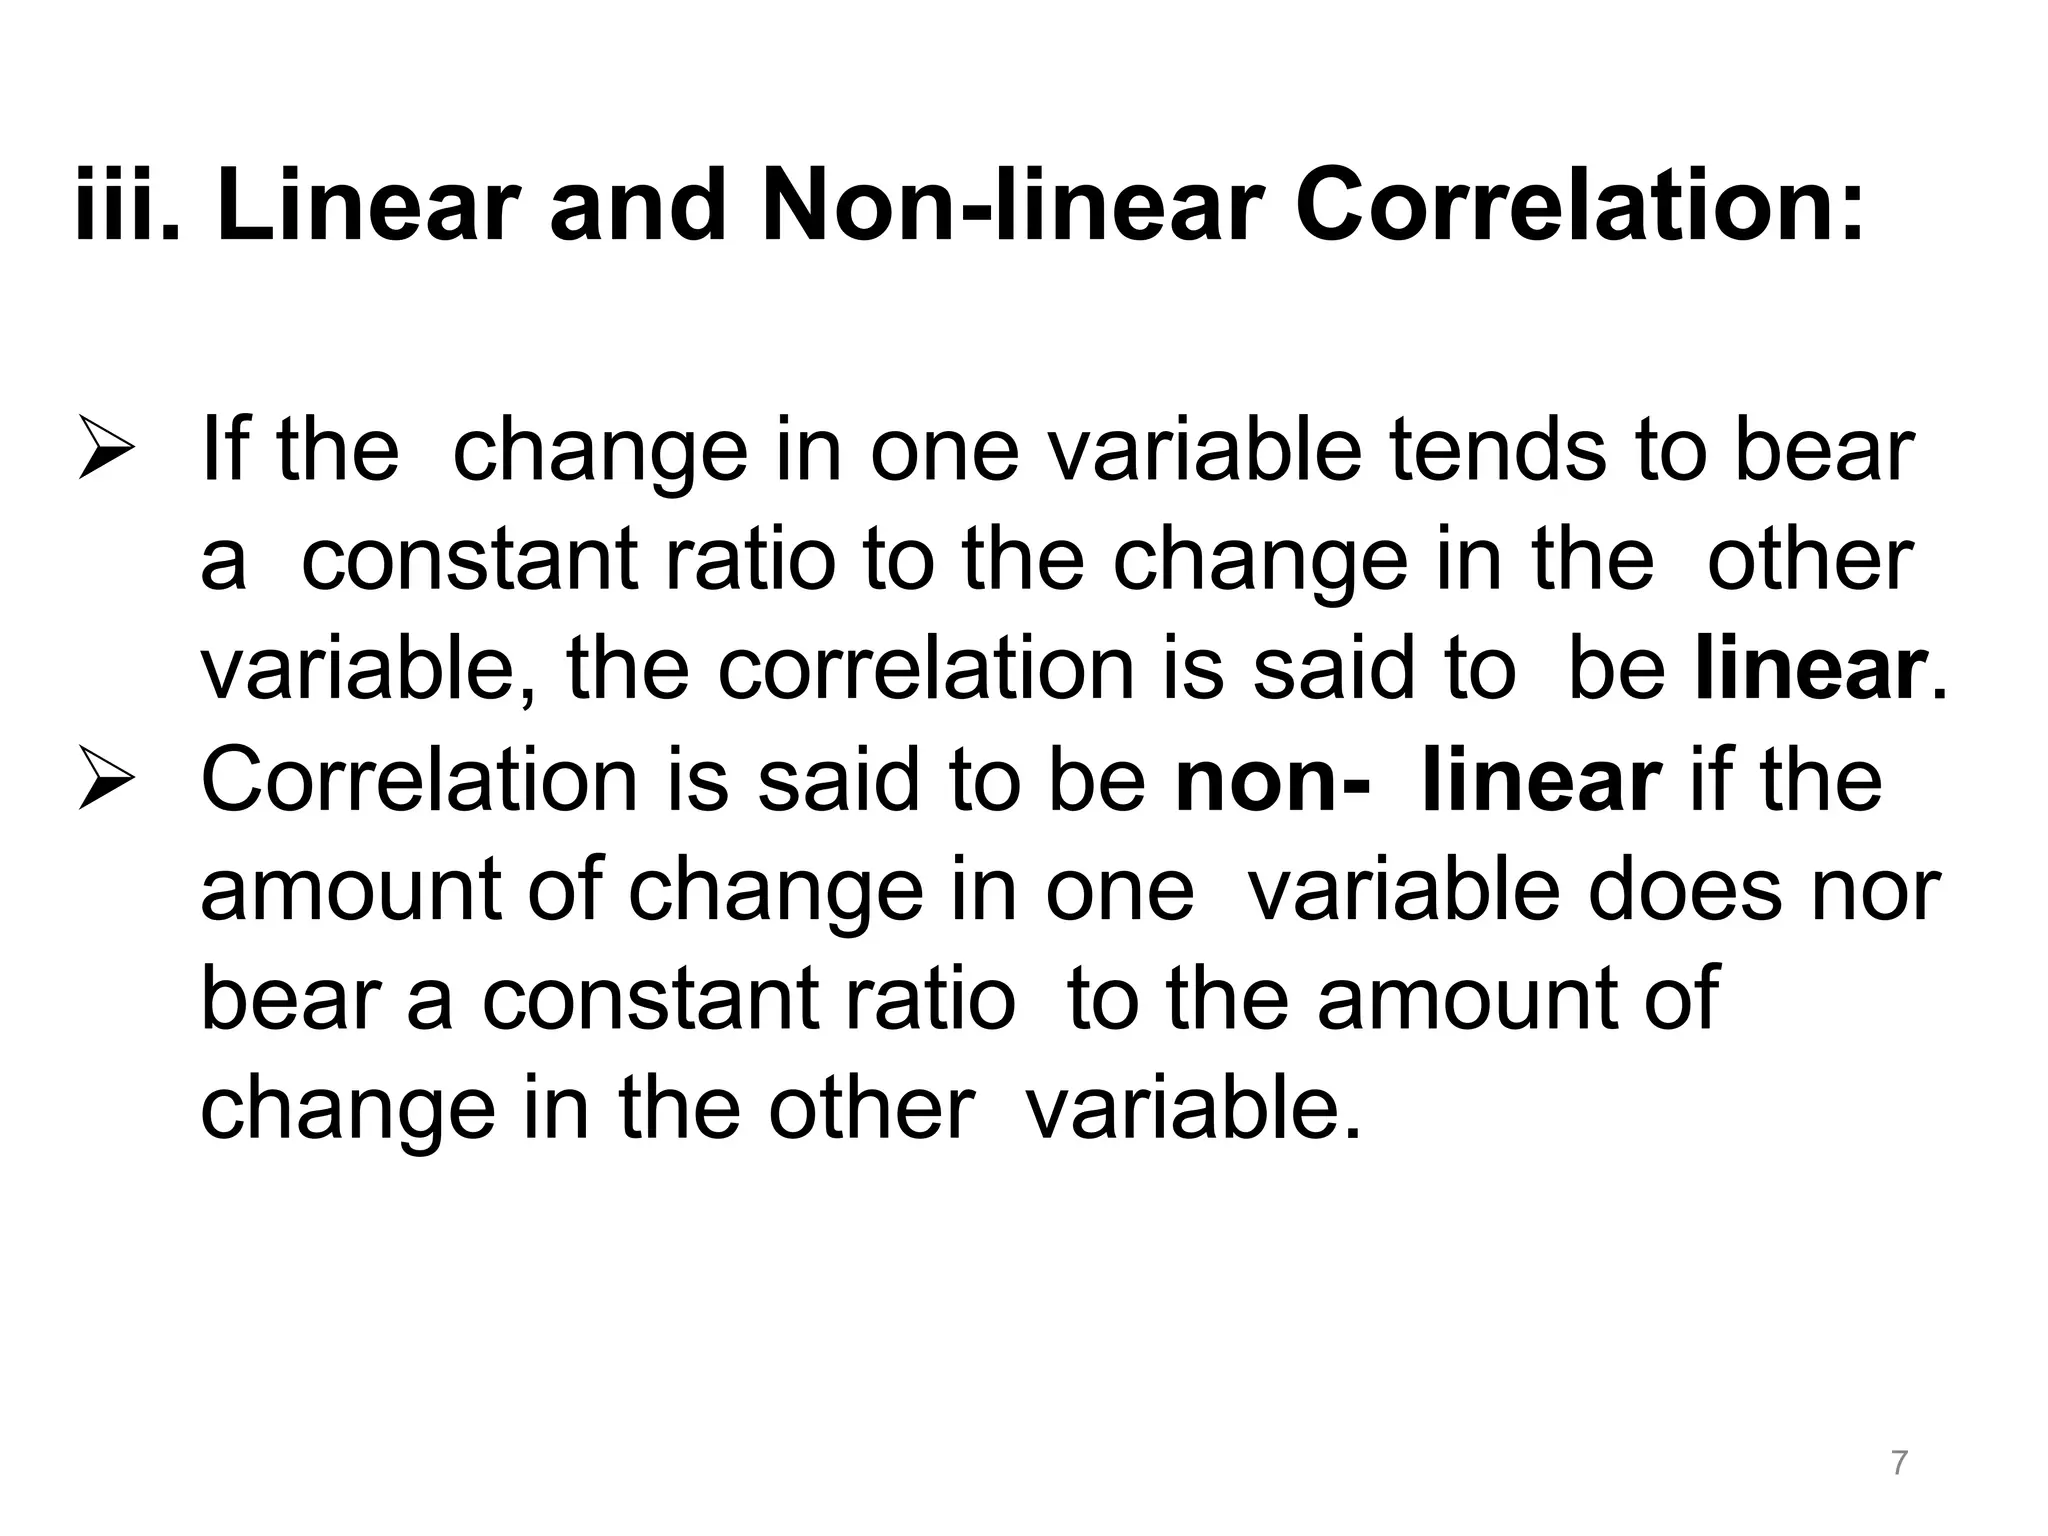
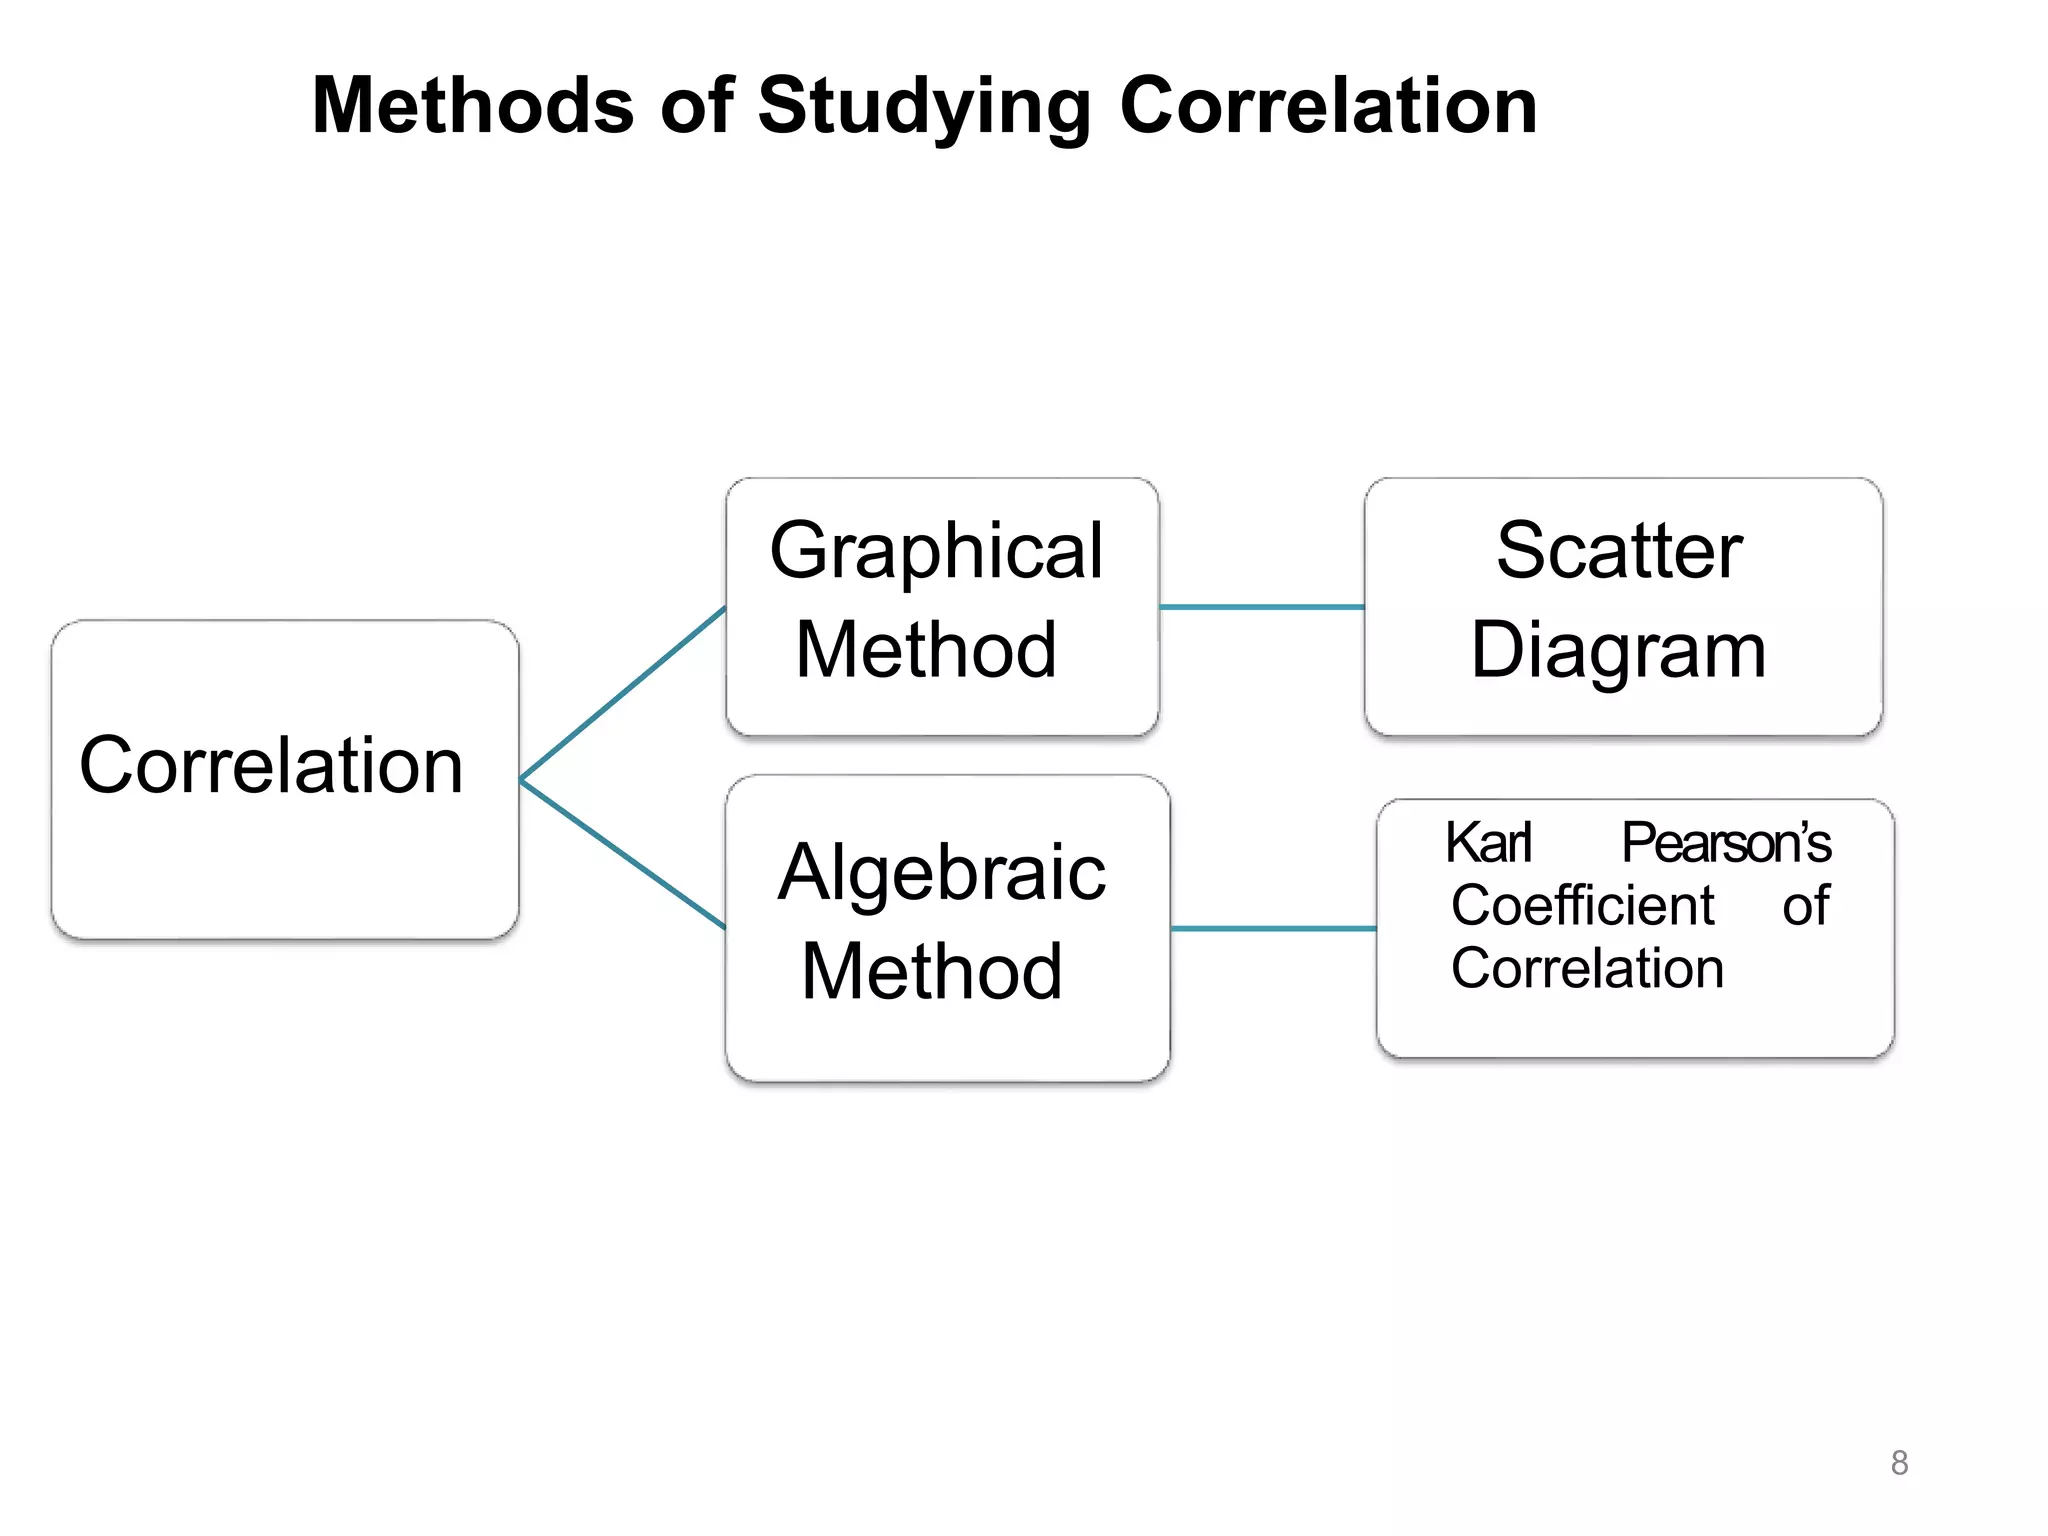
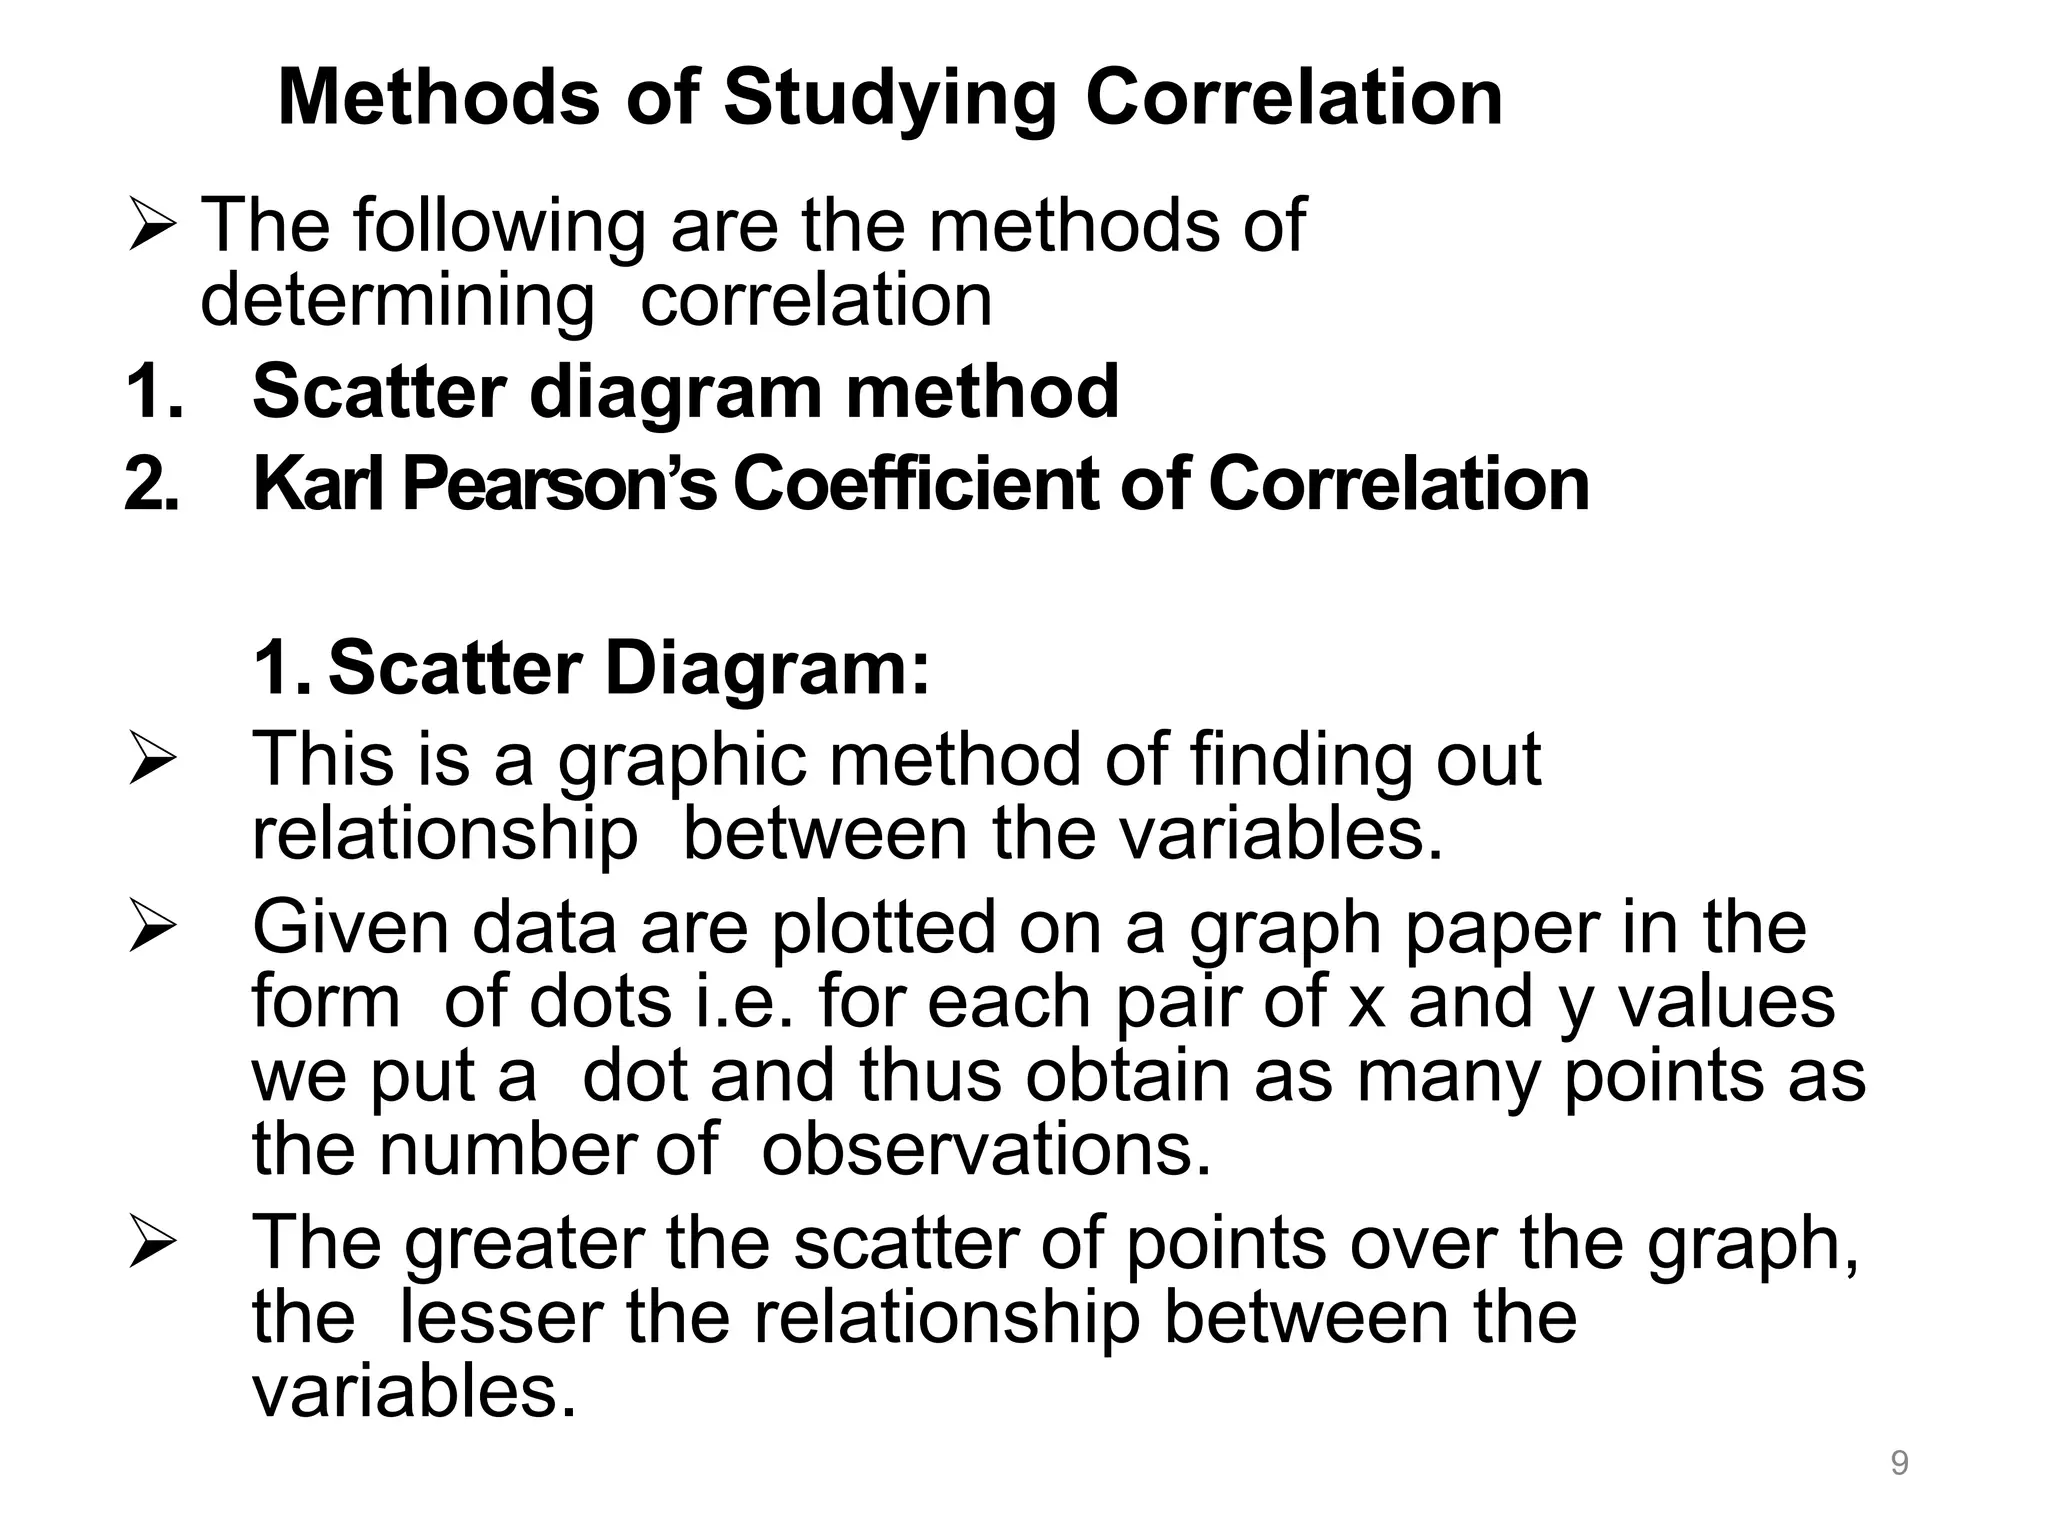
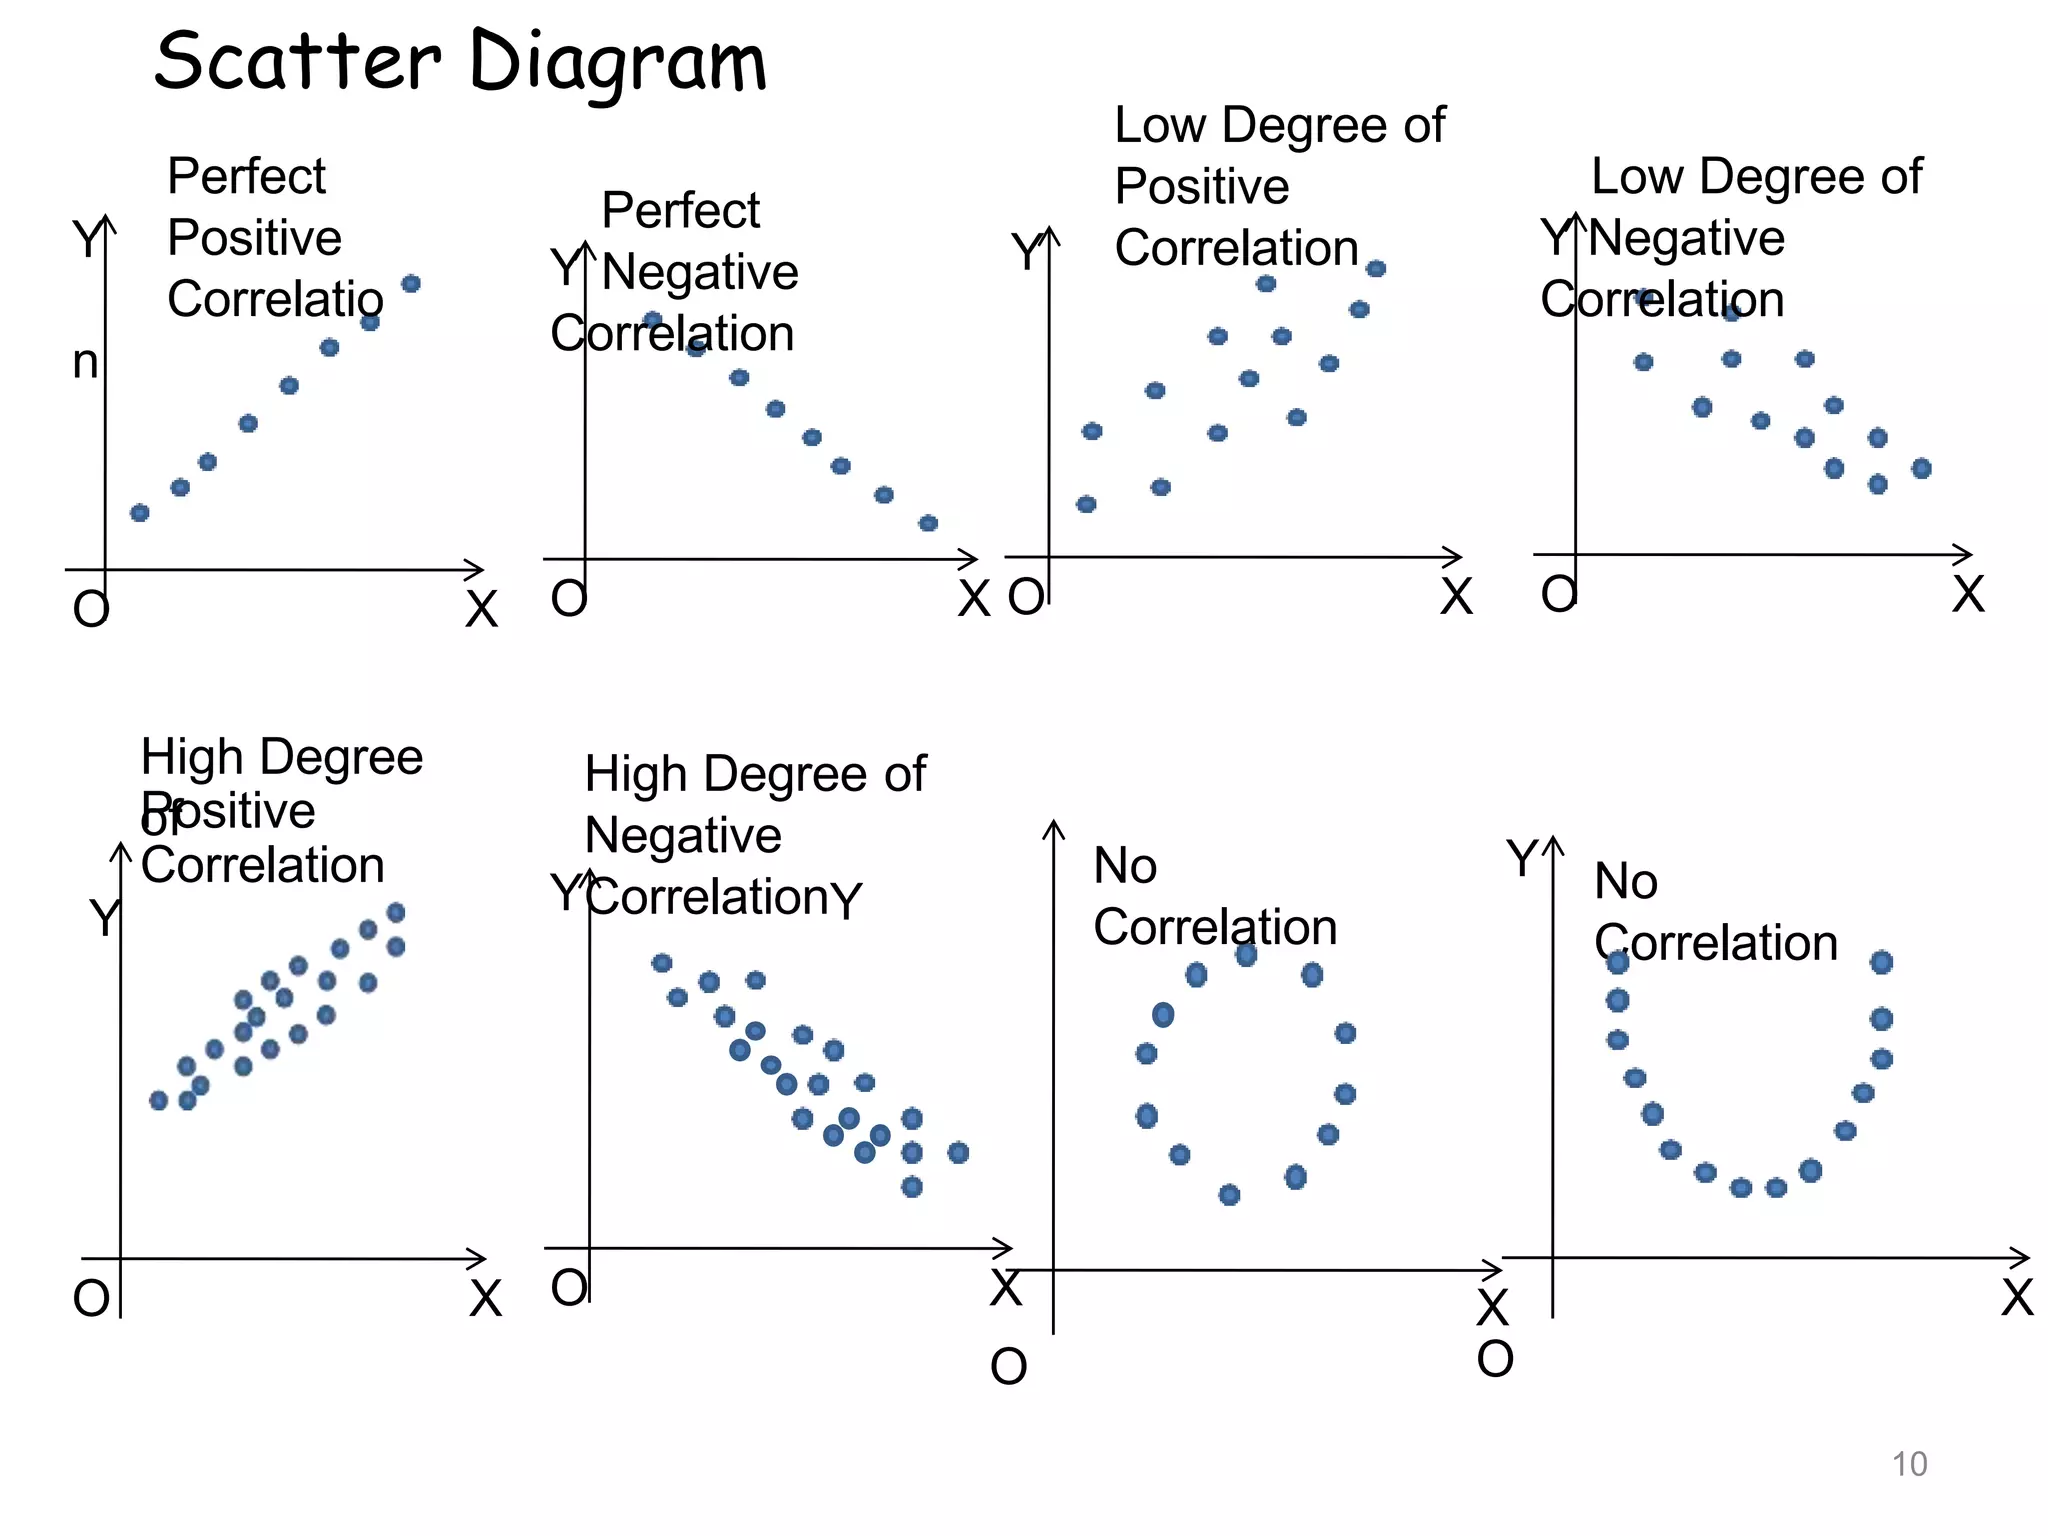
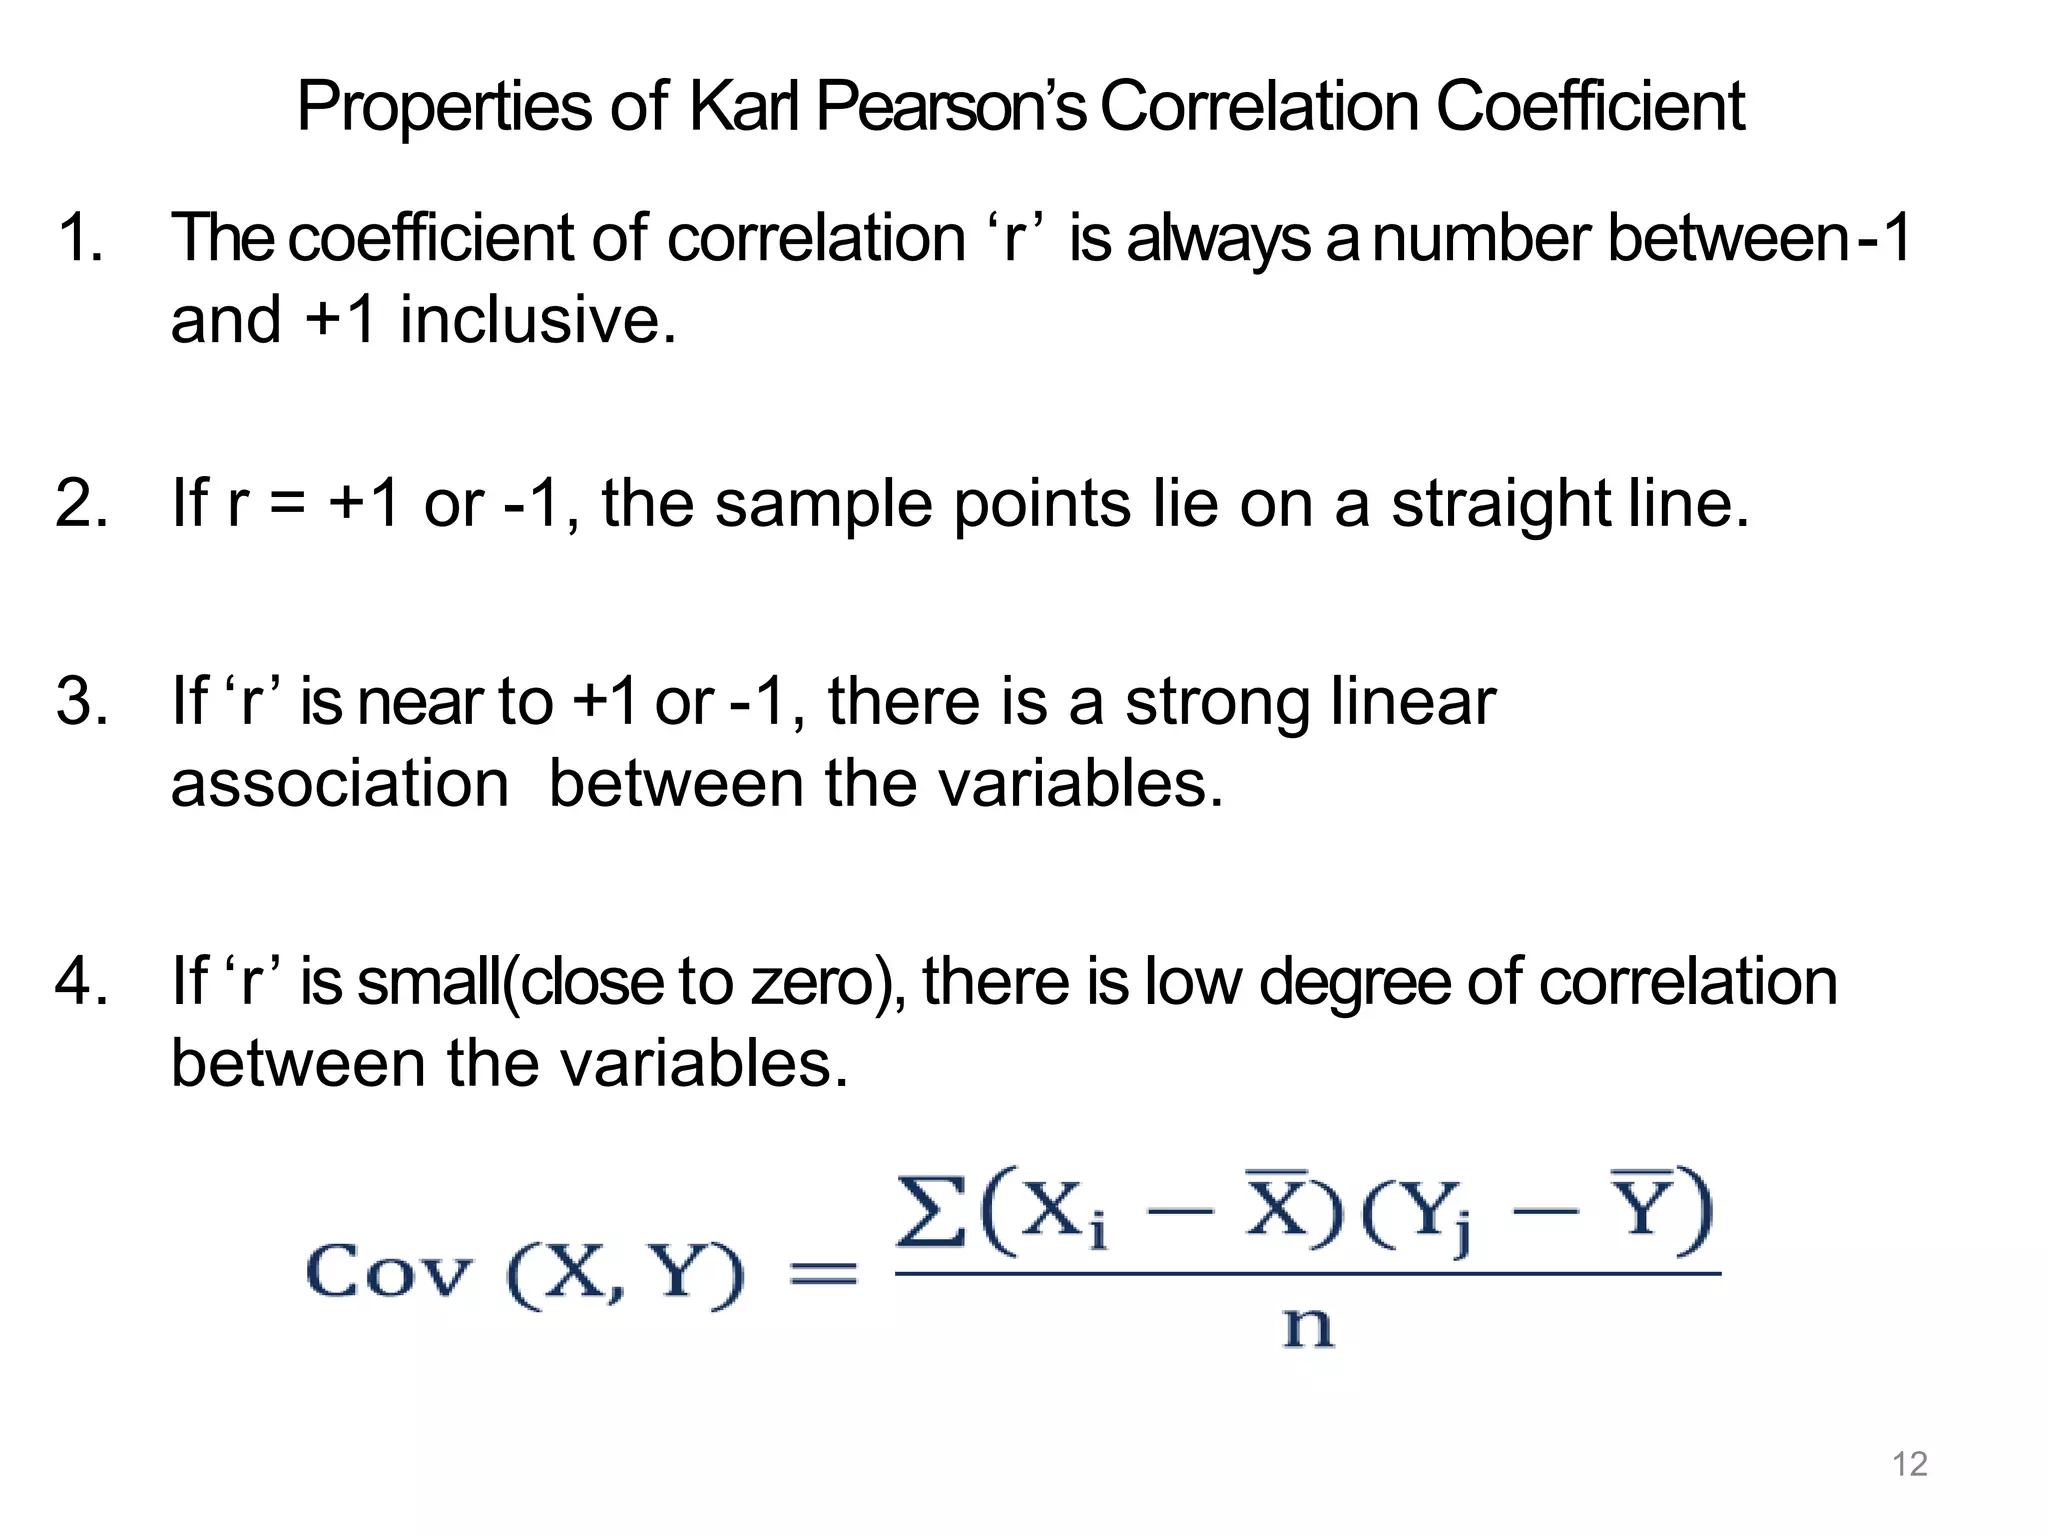
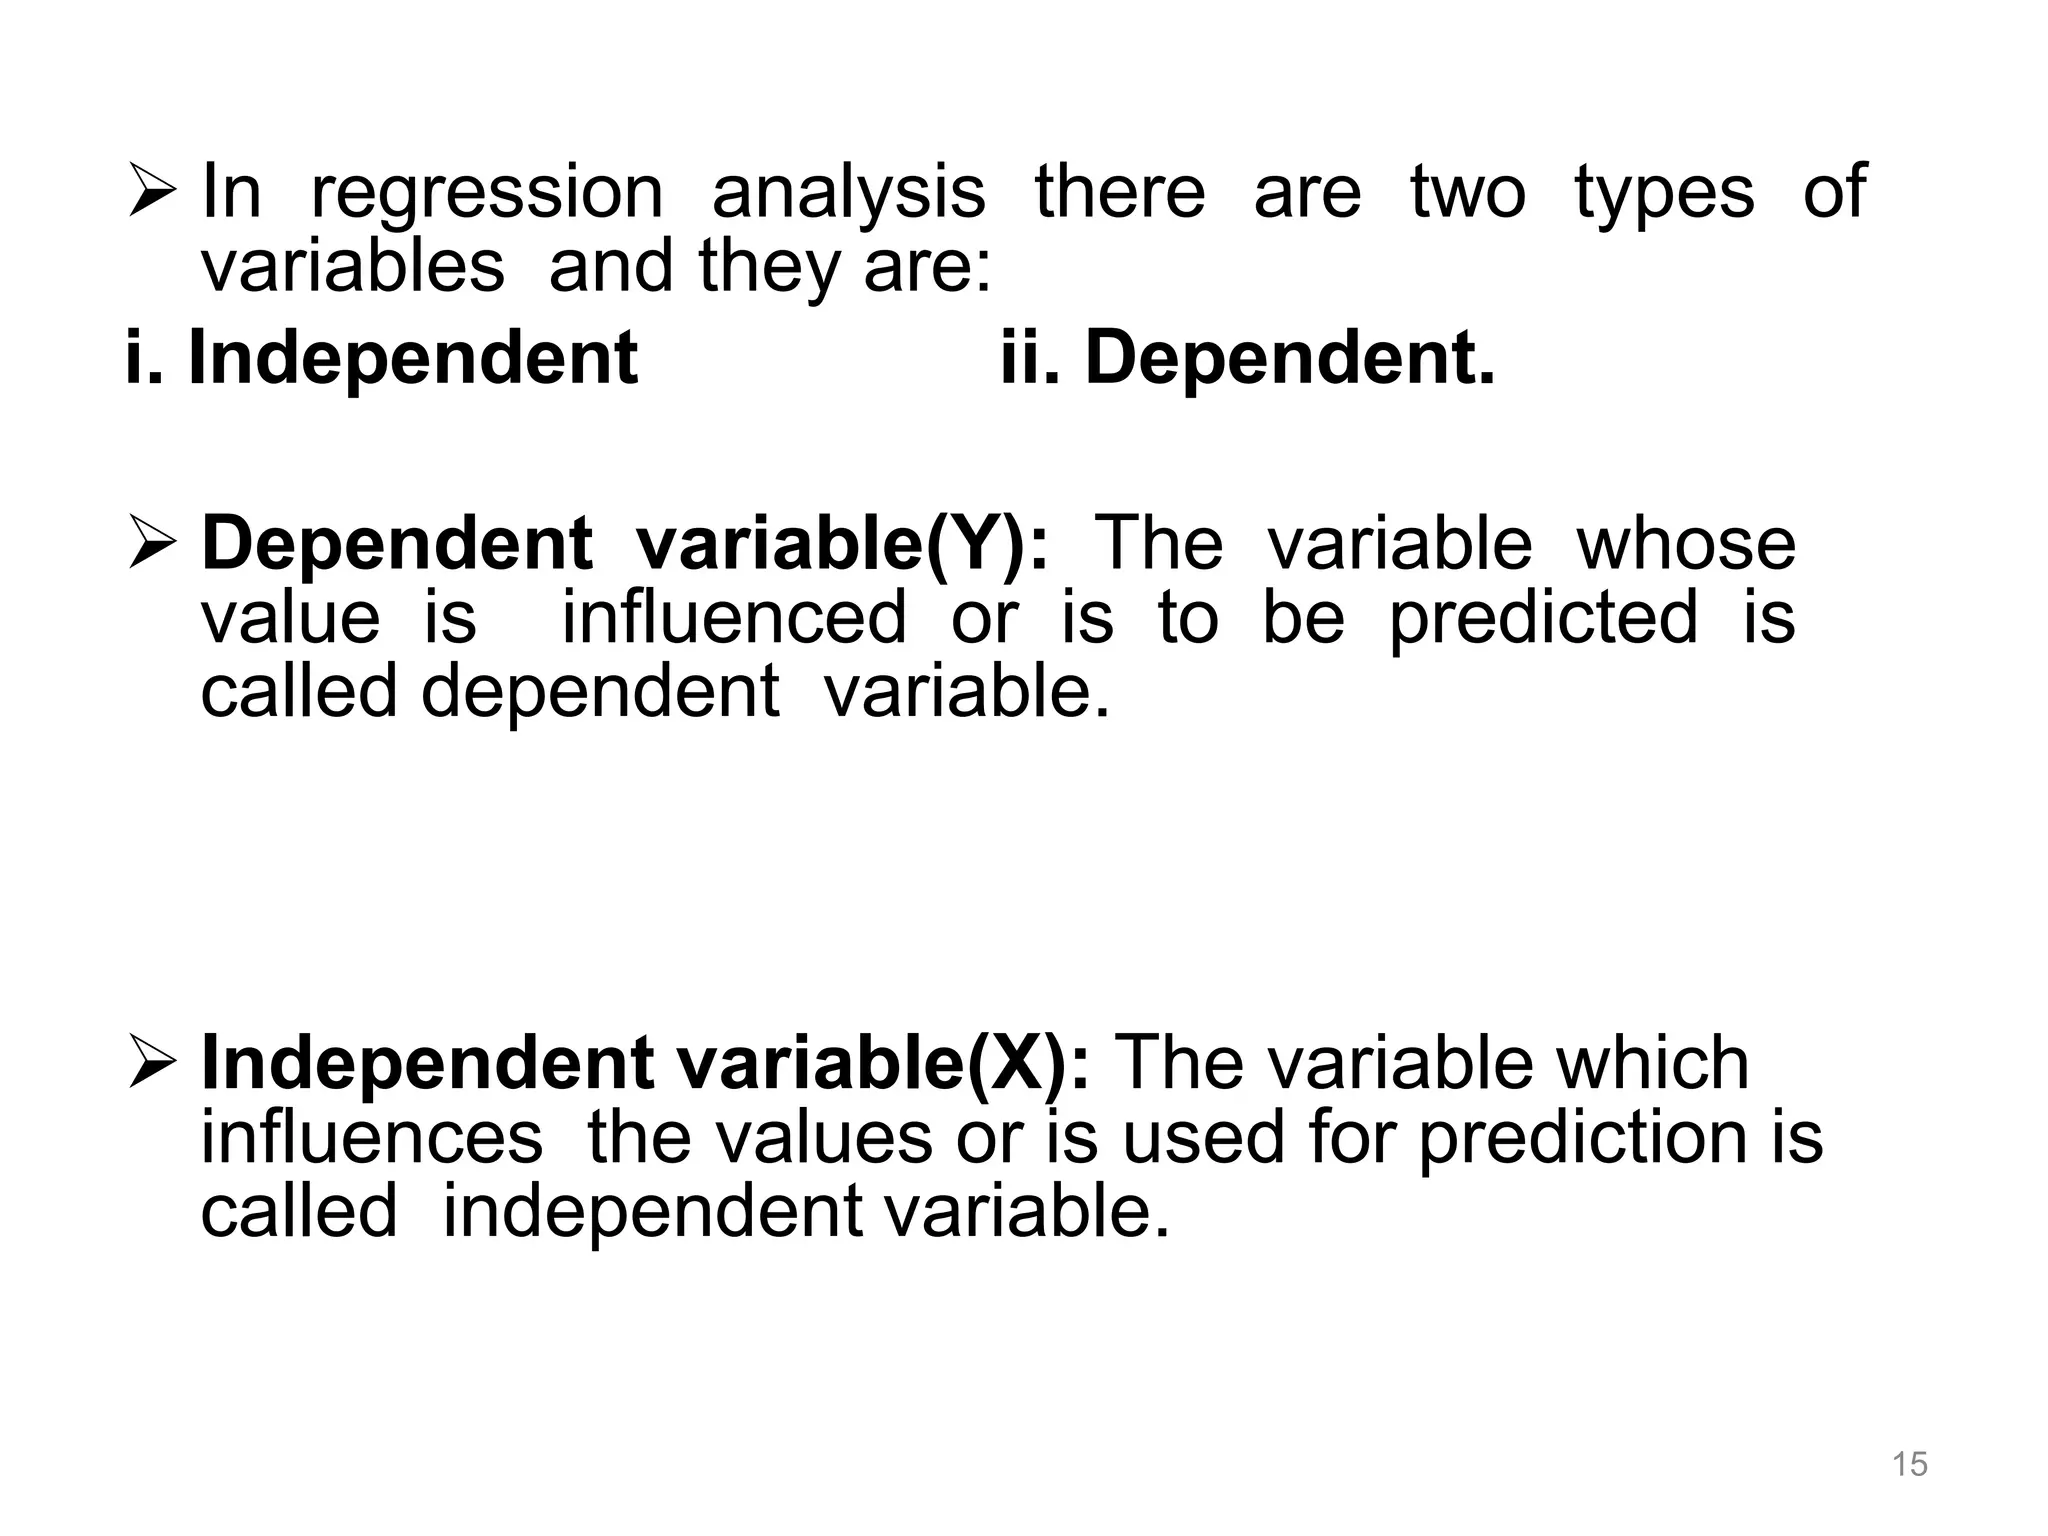
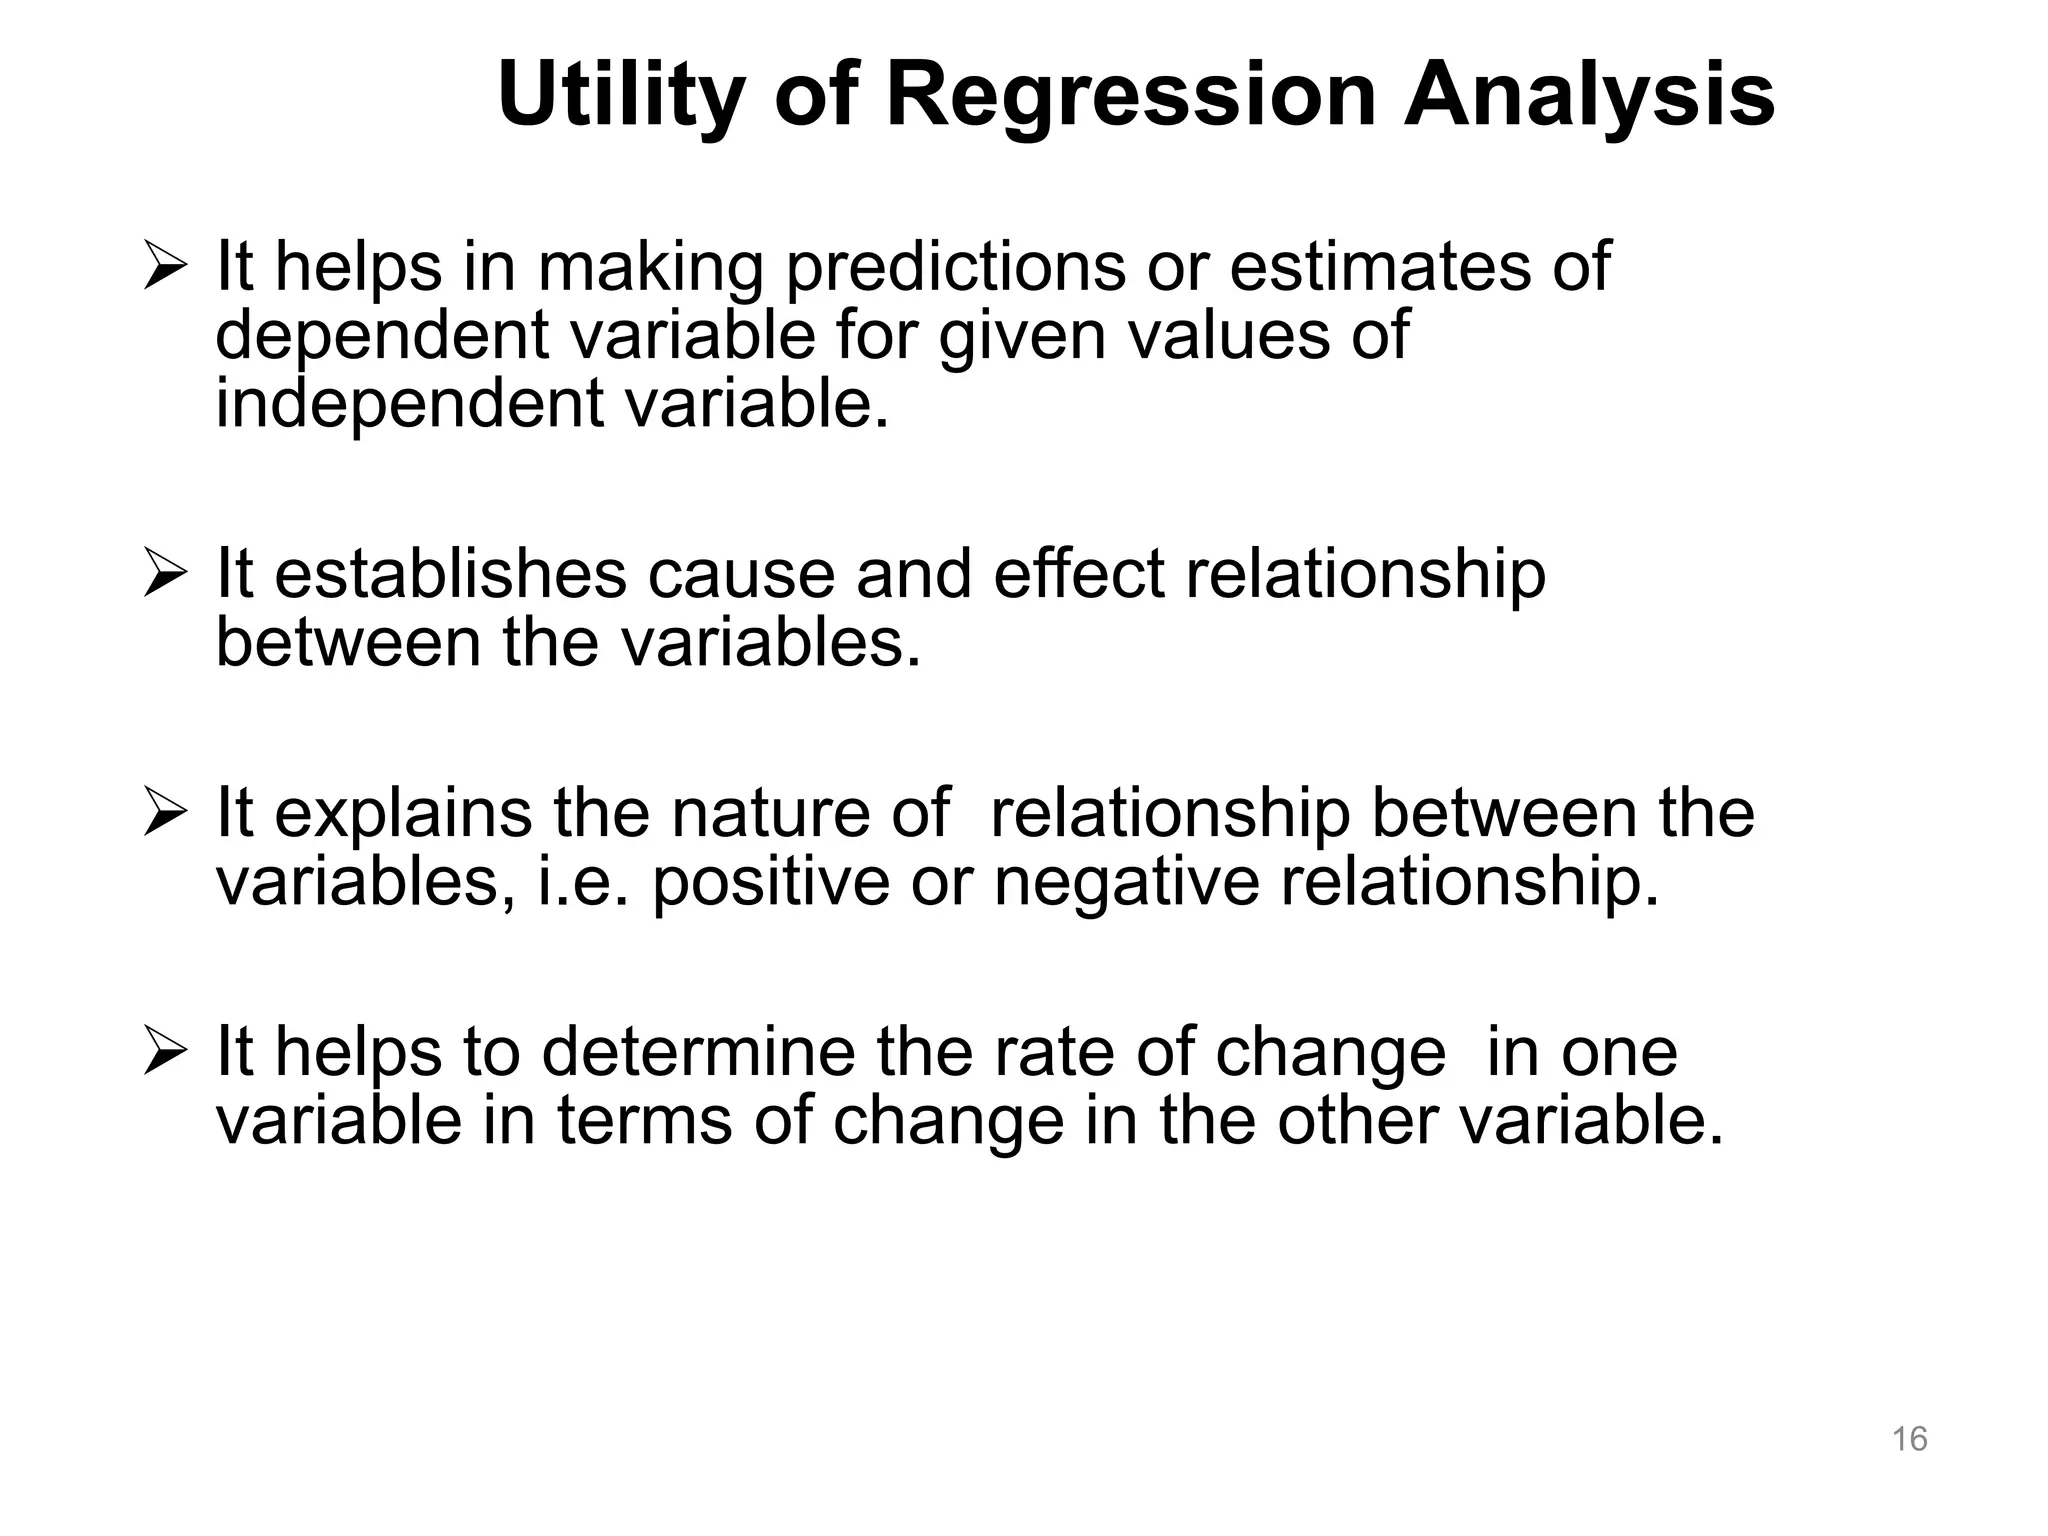
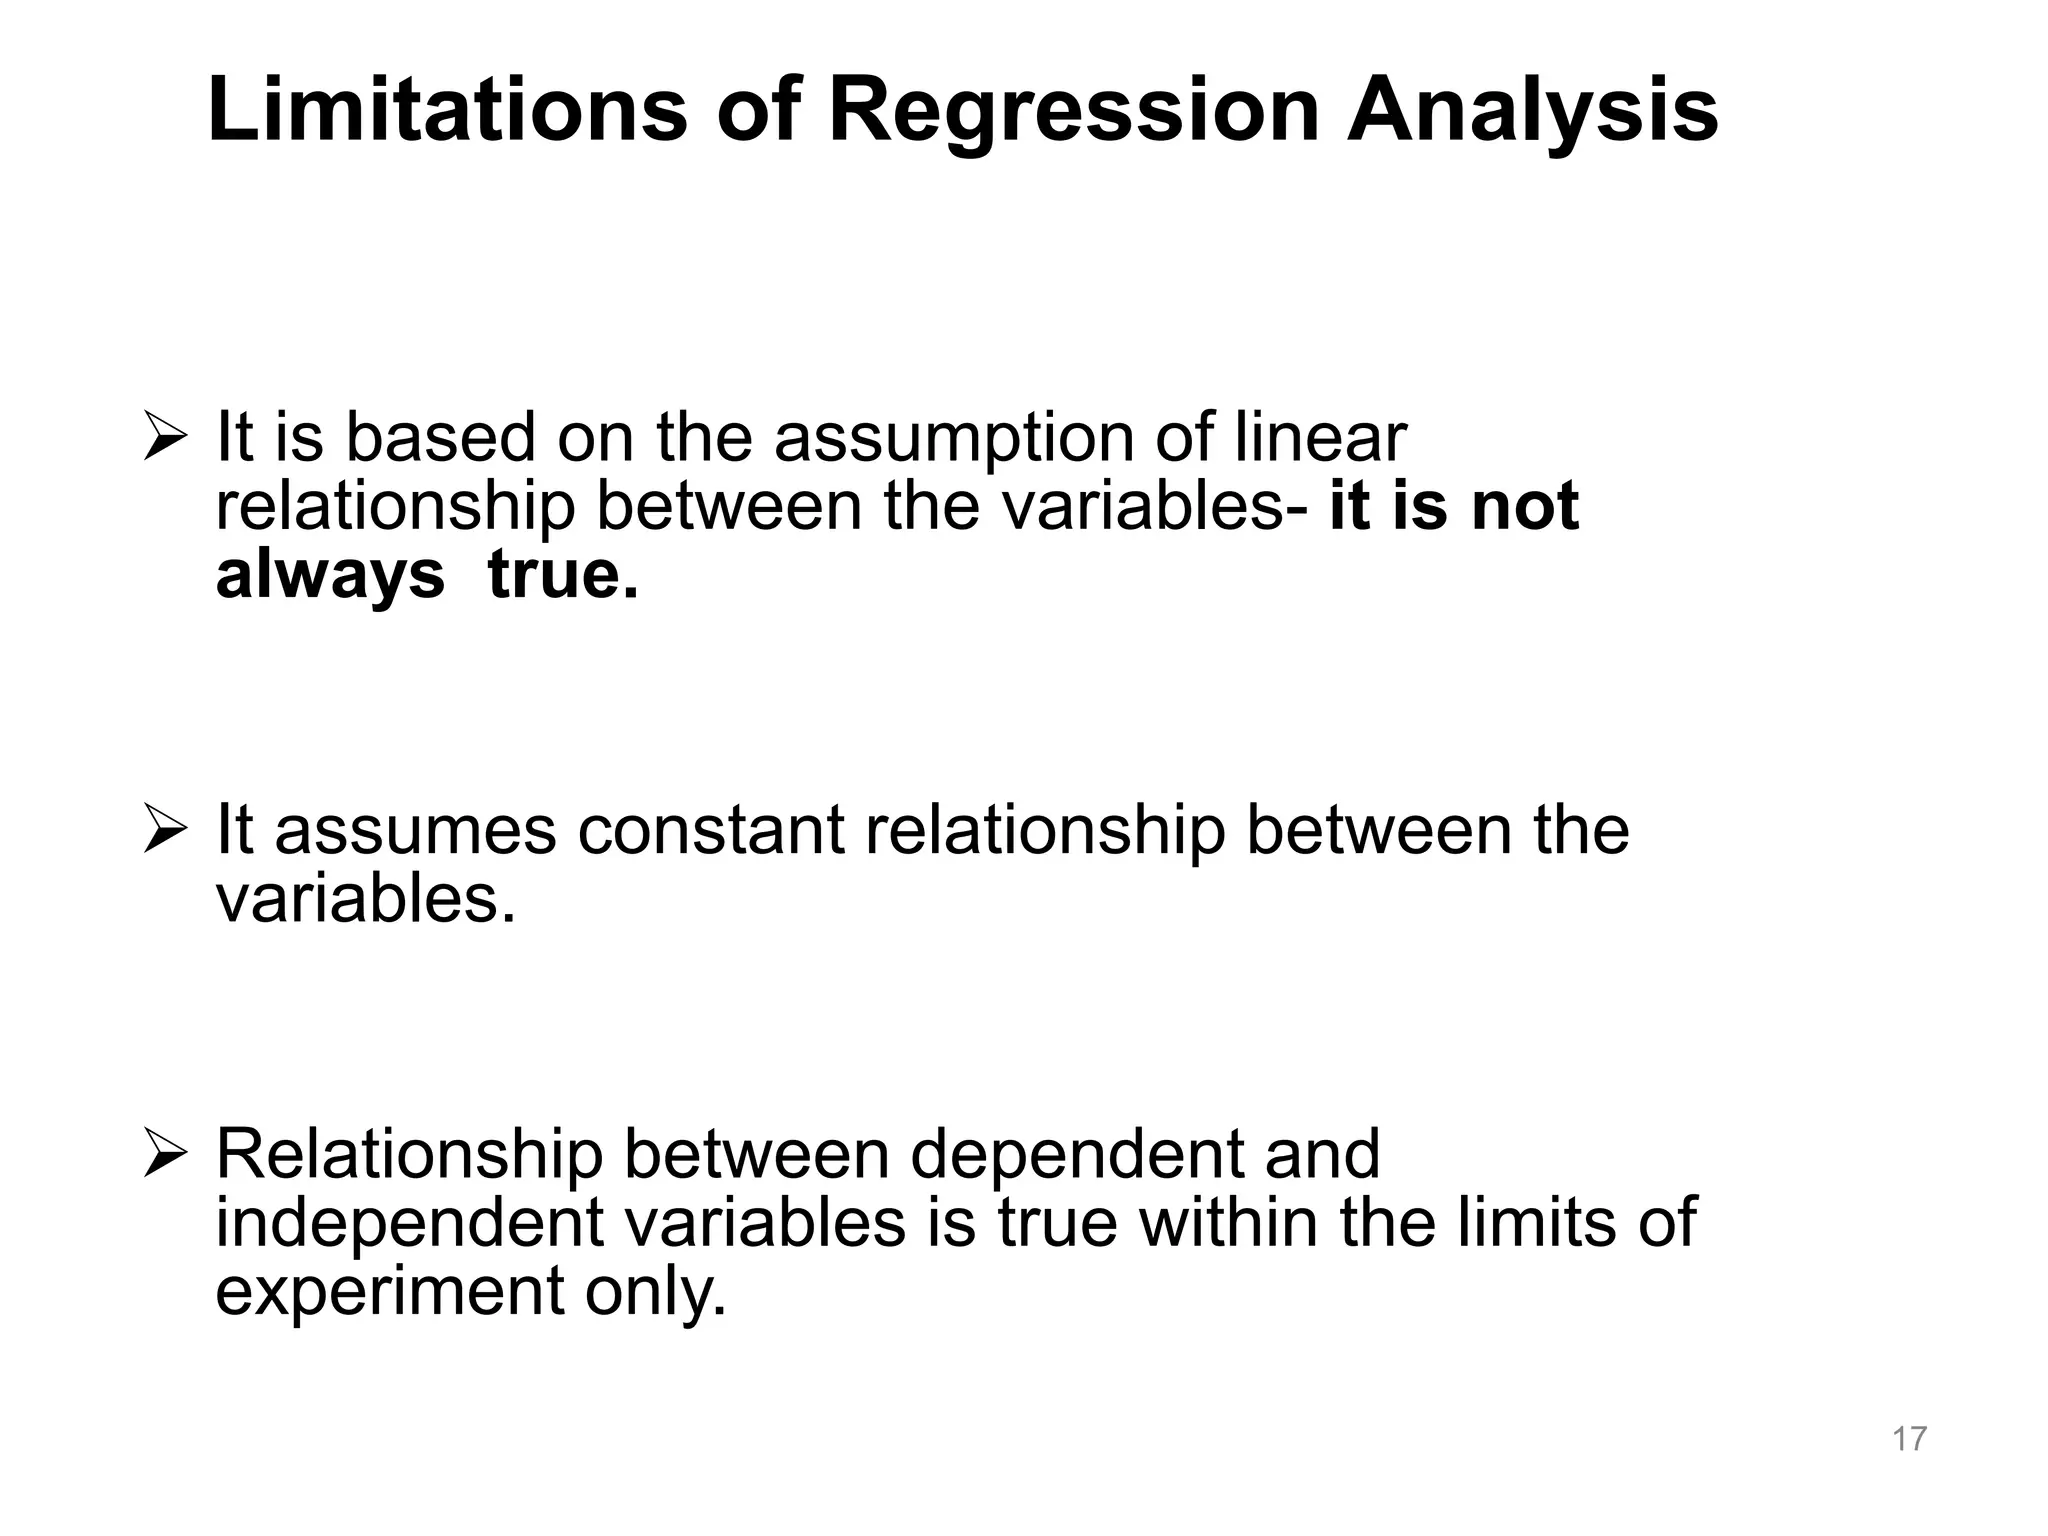
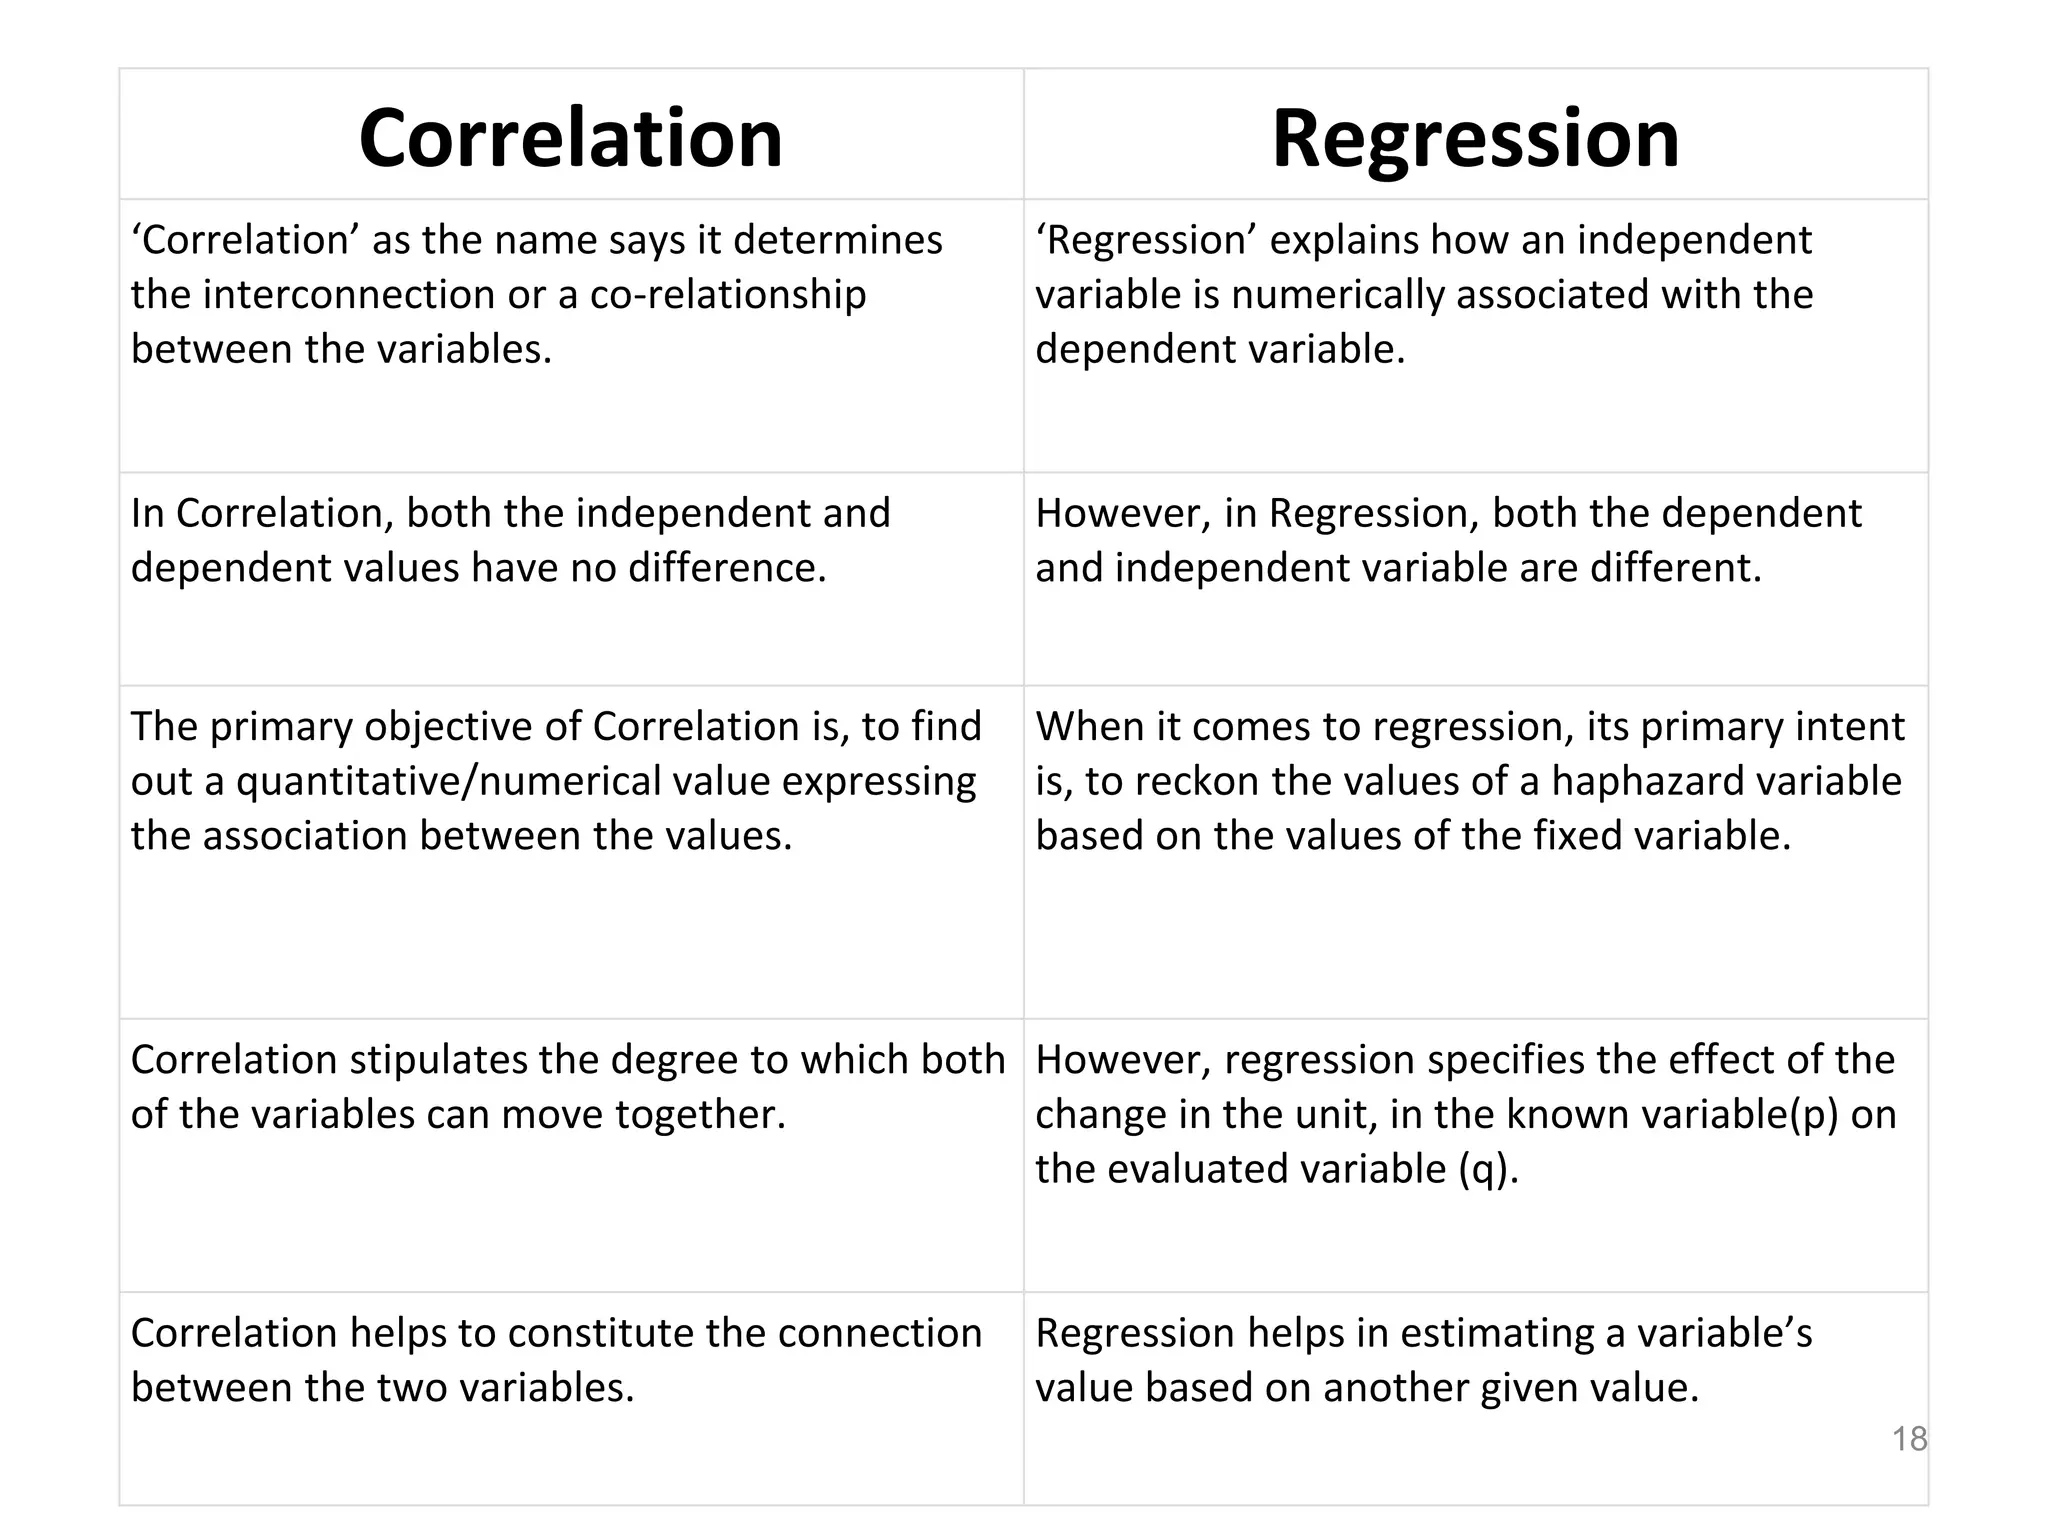
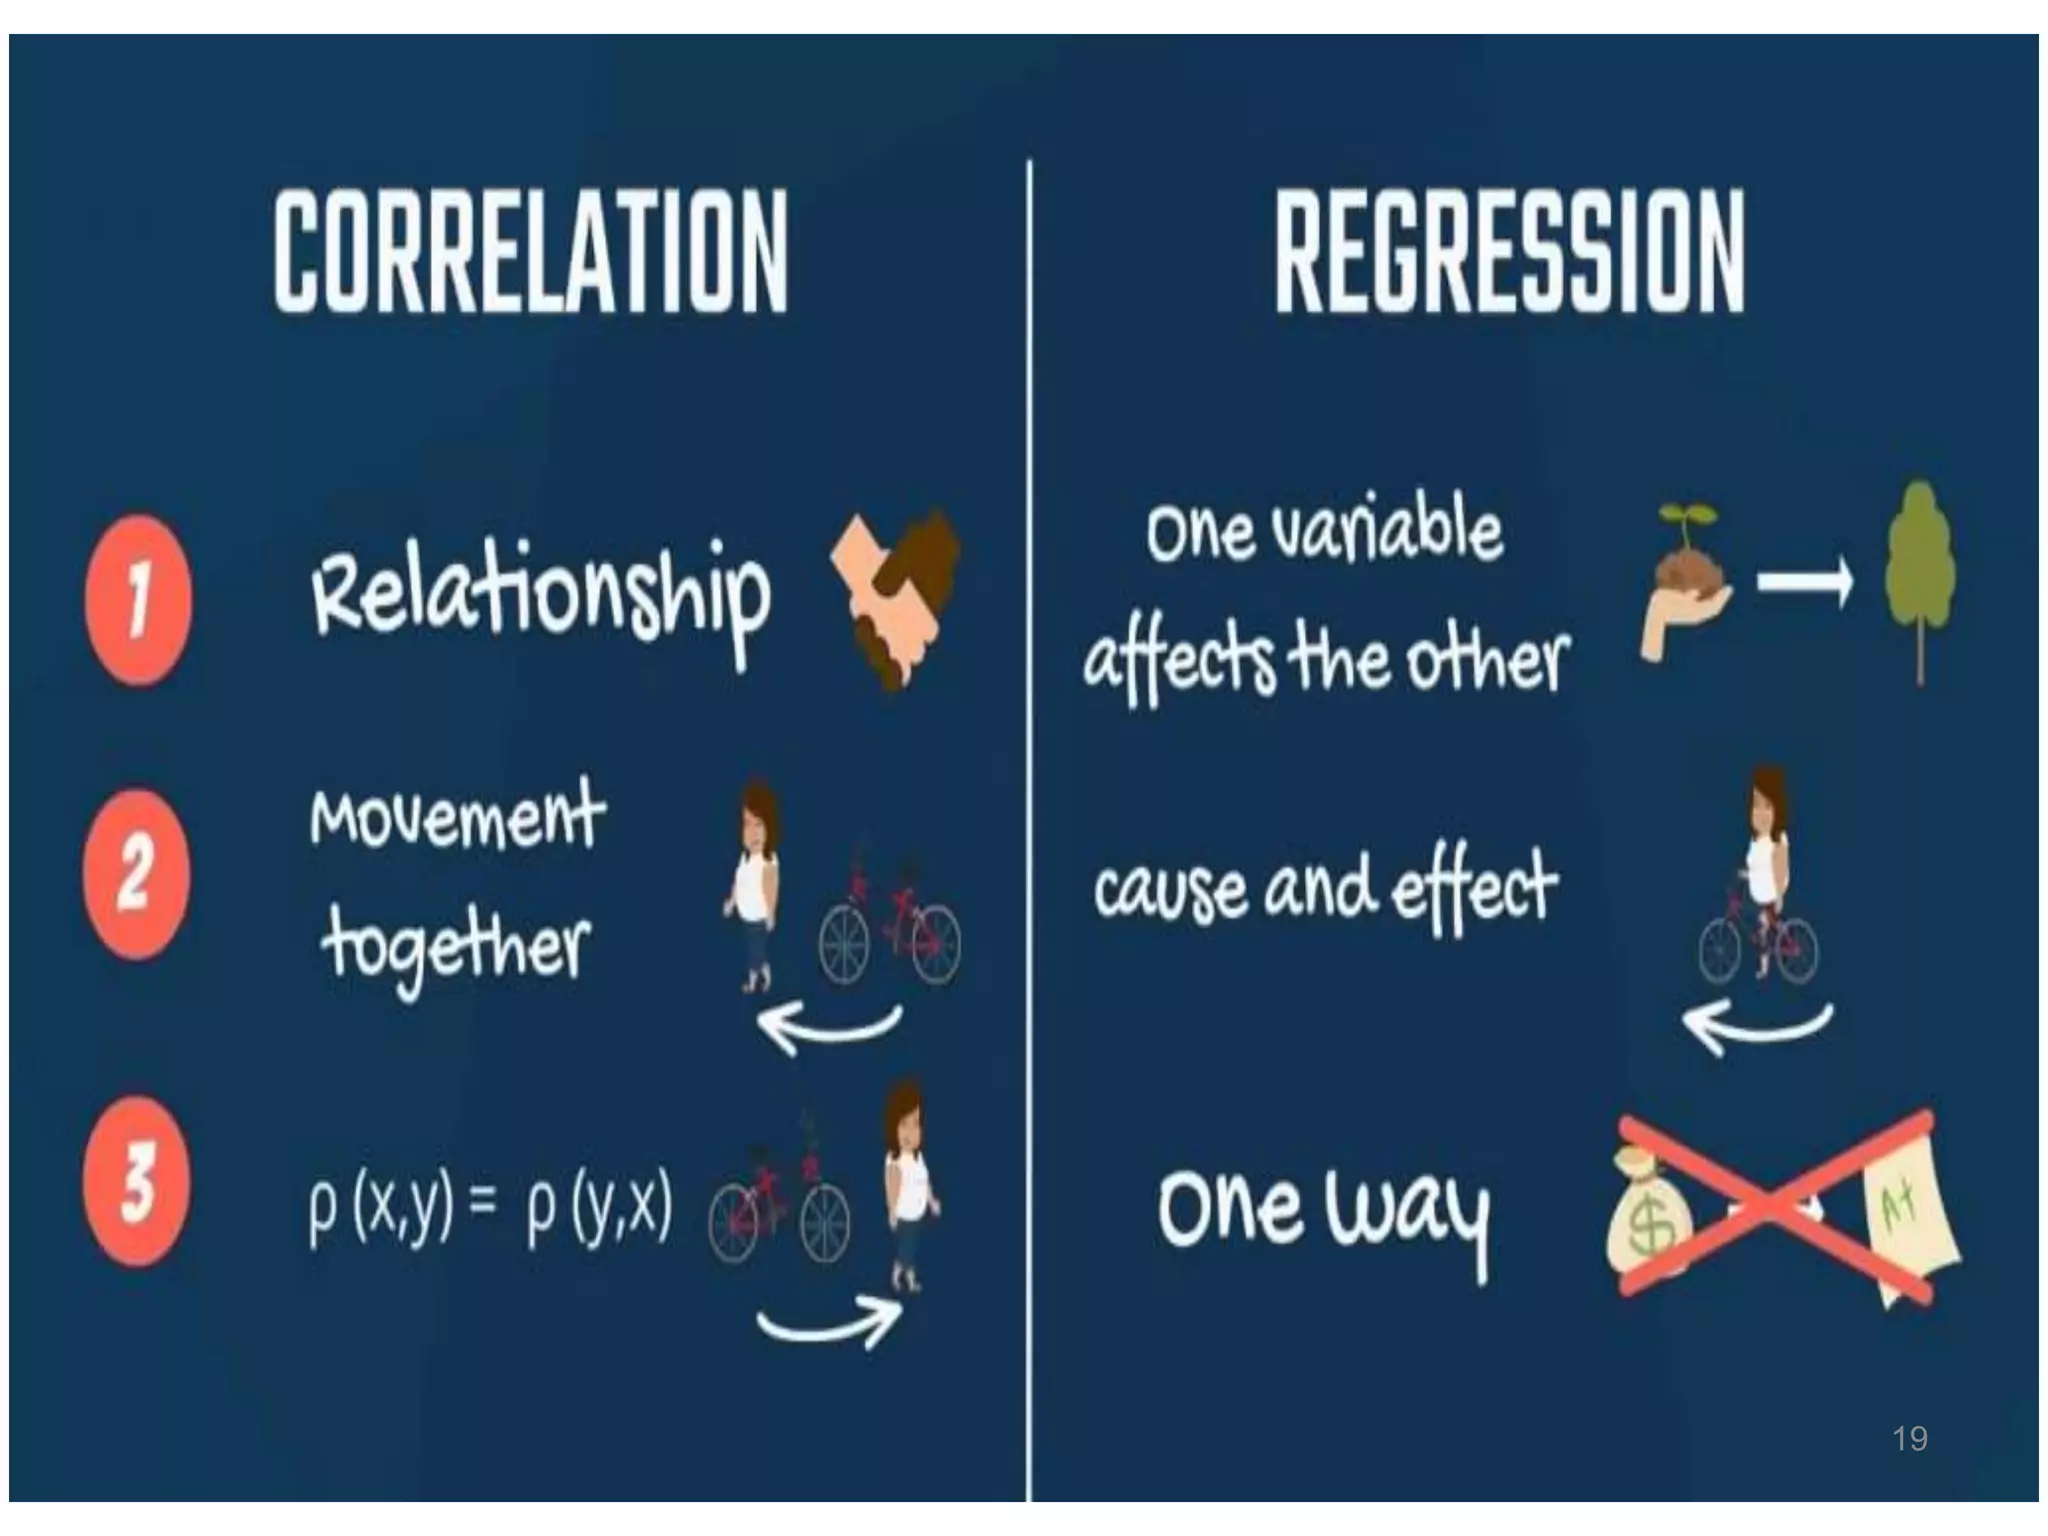
By: Aanchal Roll No. :20001534001
1
2
Correlation
Introduction:
 Two variables are said to be correlated if the
change in one variable results in a corresponding
change in the other variable.
 The correlation is a statistical tool which studies
the relationship between two variables.
 Correlation analysis involves various methods and
techniques used for studying and measuring the
extent of the relationship between the two
variables.
 Correlation is concerned with the
measurement of “strength of association
between variables”.
 The degree of association between two or
more variables is termed as correlation.
3
Definition
The correlation is the measure of the extent
and the direction of the relationship
between two variables in a bivariate
distribution.
Example:
(i) Height and weight of children.
(ii)An increase in the price of the commodity
by a decrease in the quantity demanded.
Types of Correlation: The following are the
types of correlation
(i) Positive and Negative Correlation
(ii) Simple, Partial and Multiple Correlation
(iii) Linear and Non-linear Correlation
Correlation first developed by Sir Francis
Galton (1822 – 1911) and then
reformulated by Karl Pearson (1857 –
1936)
4
5
Types of Correlation
i. Positive and Negative correlation:
 If both the variables are varying in the same
direction i.e. if one variable is increasing and
the other on an average is also increasing or if
as one variable is decreasing, the other on an
average, is also decreasing, correlation is said
to be positive.
 If on the other hand, the variable is increasing,
the other is decreasing or vice versa, correlation
is said to be negative.
Example 1: a) heights and weights (b) amount of rainfall and yields of crops
(c) price and supply of a commodity (d) income and expenditure on
luxury goods (e) blood pressure and age
6
ii. Simple, Partial and Multiple
Correlation:
 When only two variables are studied, it is
a case of simple correlation.
 In partial and multiple correlation,
three or more variables are studied.
 In partial correlation, we have more than
two variables, but consider only two
variables to be influencing each other,
the effect of the other variables being
kept constant.
7
iii. Linear and Non-linear Correlation:
 If the change in one variable tends to bear
a constant ratio to the change in the other
variable, the correlation is said to be linear.
 Correlation is said to be non- linear if the
amount of change in one variable does nor
bear a constant ratio to the amount of
change in the other variable.
Methods of Studying Correlation
Correlation
Graphical
Method
Scatter
Diagram
Algebraic
Method
Karl Pearson’s
Coefficient of
Correlation
8
9
Methods of Studying Correlation
 The following are the methods of
determining correlation
1. Scatter diagram method
2. Karl Pearson’sCoefficient of Correlation
1. Scatter Diagram:
 This is a graphic method of finding out
relationship between the variables.
 Given data are plotted on a graph paper in the
form of dots i.e. for each pair of x and y values
we put a dot and thus obtain as many points as
the number of observations.
 The greater the scatter of points over the graph,
the lesser the relationship between the
variables.
Scatter Diagram
Perfect
Positive
X
O
Y
Correlatio
n
Perfect
Negative
O
Y
Correlation
X
O
Low Degree of
Y Negative
Correlation
Low Degree of
Positive
Correlation
X
X O
Y
High Degree
of
X
O
Positive
Correlation
Y
O
Y
No
Correlation
X
O
High Degree of
Negative
CorrelationY No
Correlation
X
X
O
Y
10
11
The Coefficient of Correlation:
 Correlation between the variables is
expressed through the numerical value or
degree of Correlation.
 The numerical value or degree of Correlation
between two variables is known as Cofficient
of Correlation.
 It is expressed as “r”.
 The values range between -1.0 and 1.0.
12
Properties of Karl Pearson’sCorrelation Coefficient
1. Thecoefficient of correlation ‘r’ is always anumber between-1
and +1 inclusive.
2. If r = +1 or -1, the sample points lie on a straight line.
3. If ‘r’ is near to +1 or -1, there is a strong linear
association between the variables.
4. If ‘r’ is small(close to zero), there is low degree of correlation
between the variables.
Utility of Correlation
 It helps to find whether the two variables are
correlated or not.
 It helps to study the nature of relationship
between the variables-expressed as positive or
negative correlation.
 It helps to study the degree of correlation
between the given variables.
13
Definition: Regression analysis is a mathematical
measure of the average relationship between two or
more variables in terms of the original units of the
data.
 Thus term regression is used to denote
estimation or prediction of the average value of
one variable for a specified value of the other
variable.
 The estimation is done by means of suitable
equation, derived on the basis of available
bivariate data. Such an equation and its
geometrical representation is called regression
curve.
Regression
14
15
 In regression analysis there are two types of
variables and they are:
i. Independent ii. Dependent.
 Dependent variable(Y): The variable whose
value is influenced or is to be predicted is
called dependent variable.
 Independent variable(X): The variable which
influences the values or is used for prediction is
called independent variable.
Utility of Regression Analysis
 It helps in making predictions or estimates of
dependent variable for given values of
independent variable.
 It establishes cause and effect relationship
between the variables.
 It explains the nature of relationship between the
variables, i.e. positive or negative relationship.
 It helps to determine the rate of change in one
variable in terms of change in the other variable.
16
Limitations of Regression Analysis
 It is based on the assumption of linear
relationship between the variables- it is not
always true.
 It assumes constant relationship between the
variables.
 Relationship between dependent and
independent variables is true within the limits of
experiment only.
17
Correlation Regression
‘Correlation’ as the name says it determines
the interconnection or a co-relationship
between the variables.
‘Regression’ explains how an independent
variable is numerically associated with the
dependent variable.
In Correlation, both the independent and
dependent values have no difference.
However, in Regression, both the dependent
and independent variable are different.
The primary objective of Correlation is, to find
out a quantitative/numerical value expressing
the association between the values.
When it comes to regression, its primary intent
is, to reckon the values of a haphazard variable
based on the values of the fixed variable.
Correlation stipulates the degree to which both
of the variables can move together.
However, regression specifies the effect of the
change in the unit, in the known variable(p) on
the evaluated variable (q).
Correlation helps to constitute the connection
between the two variables.
Regression helps in estimating a variable’s
value based on another given value.
18
19
20
“THANK YOU”

Correlation and regression

  • 1.
    By: Aanchal RollNo. :20001534001 1
  • 2.
    2 Correlation Introduction:  Two variablesare said to be correlated if the change in one variable results in a corresponding change in the other variable.  The correlation is a statistical tool which studies the relationship between two variables.  Correlation analysis involves various methods and techniques used for studying and measuring the extent of the relationship between the two variables.  Correlation is concerned with the measurement of “strength of association between variables”.  The degree of association between two or more variables is termed as correlation.
  • 3.
    3 Definition The correlation isthe measure of the extent and the direction of the relationship between two variables in a bivariate distribution. Example: (i) Height and weight of children. (ii)An increase in the price of the commodity by a decrease in the quantity demanded. Types of Correlation: The following are the types of correlation (i) Positive and Negative Correlation (ii) Simple, Partial and Multiple Correlation (iii) Linear and Non-linear Correlation
  • 4.
    Correlation first developedby Sir Francis Galton (1822 – 1911) and then reformulated by Karl Pearson (1857 – 1936) 4
  • 5.
    5 Types of Correlation i.Positive and Negative correlation:  If both the variables are varying in the same direction i.e. if one variable is increasing and the other on an average is also increasing or if as one variable is decreasing, the other on an average, is also decreasing, correlation is said to be positive.  If on the other hand, the variable is increasing, the other is decreasing or vice versa, correlation is said to be negative. Example 1: a) heights and weights (b) amount of rainfall and yields of crops (c) price and supply of a commodity (d) income and expenditure on luxury goods (e) blood pressure and age
  • 6.
    6 ii. Simple, Partialand Multiple Correlation:  When only two variables are studied, it is a case of simple correlation.  In partial and multiple correlation, three or more variables are studied.  In partial correlation, we have more than two variables, but consider only two variables to be influencing each other, the effect of the other variables being kept constant.
  • 7.
    7 iii. Linear andNon-linear Correlation:  If the change in one variable tends to bear a constant ratio to the change in the other variable, the correlation is said to be linear.  Correlation is said to be non- linear if the amount of change in one variable does nor bear a constant ratio to the amount of change in the other variable.
  • 8.
    Methods of StudyingCorrelation Correlation Graphical Method Scatter Diagram Algebraic Method Karl Pearson’s Coefficient of Correlation 8
  • 9.
    9 Methods of StudyingCorrelation  The following are the methods of determining correlation 1. Scatter diagram method 2. Karl Pearson’sCoefficient of Correlation 1. Scatter Diagram:  This is a graphic method of finding out relationship between the variables.  Given data are plotted on a graph paper in the form of dots i.e. for each pair of x and y values we put a dot and thus obtain as many points as the number of observations.  The greater the scatter of points over the graph, the lesser the relationship between the variables.
  • 10.
    Scatter Diagram Perfect Positive X O Y Correlatio n Perfect Negative O Y Correlation X O Low Degreeof Y Negative Correlation Low Degree of Positive Correlation X X O Y High Degree of X O Positive Correlation Y O Y No Correlation X O High Degree of Negative CorrelationY No Correlation X X O Y 10
  • 11.
    11 The Coefficient ofCorrelation:  Correlation between the variables is expressed through the numerical value or degree of Correlation.  The numerical value or degree of Correlation between two variables is known as Cofficient of Correlation.  It is expressed as “r”.  The values range between -1.0 and 1.0.
  • 12.
    12 Properties of KarlPearson’sCorrelation Coefficient 1. Thecoefficient of correlation ‘r’ is always anumber between-1 and +1 inclusive. 2. If r = +1 or -1, the sample points lie on a straight line. 3. If ‘r’ is near to +1 or -1, there is a strong linear association between the variables. 4. If ‘r’ is small(close to zero), there is low degree of correlation between the variables.
  • 13.
    Utility of Correlation It helps to find whether the two variables are correlated or not.  It helps to study the nature of relationship between the variables-expressed as positive or negative correlation.  It helps to study the degree of correlation between the given variables. 13
  • 14.
    Definition: Regression analysisis a mathematical measure of the average relationship between two or more variables in terms of the original units of the data.  Thus term regression is used to denote estimation or prediction of the average value of one variable for a specified value of the other variable.  The estimation is done by means of suitable equation, derived on the basis of available bivariate data. Such an equation and its geometrical representation is called regression curve. Regression 14
  • 15.
    15  In regressionanalysis there are two types of variables and they are: i. Independent ii. Dependent.  Dependent variable(Y): The variable whose value is influenced or is to be predicted is called dependent variable.  Independent variable(X): The variable which influences the values or is used for prediction is called independent variable.
  • 16.
    Utility of RegressionAnalysis  It helps in making predictions or estimates of dependent variable for given values of independent variable.  It establishes cause and effect relationship between the variables.  It explains the nature of relationship between the variables, i.e. positive or negative relationship.  It helps to determine the rate of change in one variable in terms of change in the other variable. 16
  • 17.
    Limitations of RegressionAnalysis  It is based on the assumption of linear relationship between the variables- it is not always true.  It assumes constant relationship between the variables.  Relationship between dependent and independent variables is true within the limits of experiment only. 17
  • 18.
    Correlation Regression ‘Correlation’ asthe name says it determines the interconnection or a co-relationship between the variables. ‘Regression’ explains how an independent variable is numerically associated with the dependent variable. In Correlation, both the independent and dependent values have no difference. However, in Regression, both the dependent and independent variable are different. The primary objective of Correlation is, to find out a quantitative/numerical value expressing the association between the values. When it comes to regression, its primary intent is, to reckon the values of a haphazard variable based on the values of the fixed variable. Correlation stipulates the degree to which both of the variables can move together. However, regression specifies the effect of the change in the unit, in the known variable(p) on the evaluated variable (q). Correlation helps to constitute the connection between the two variables. Regression helps in estimating a variable’s value based on another given value. 18
  • 19.
  • 20.