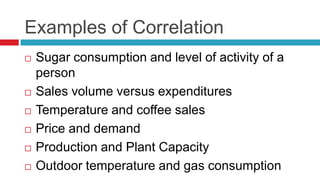
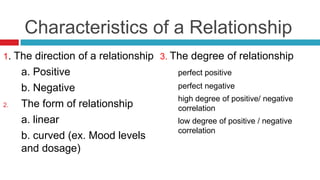
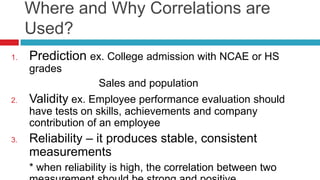
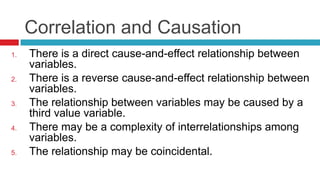
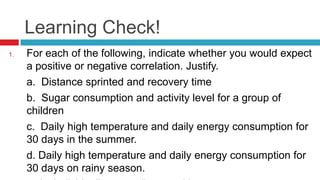
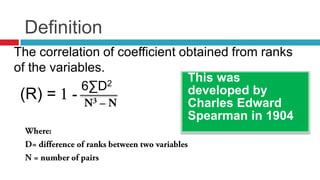
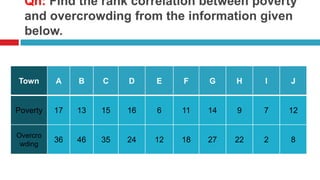
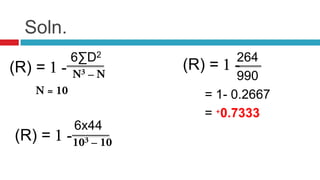
ADDITIONAL
INFORMATION
Correlation Analysis continued…Chapter 2
Examples of Correlation
 Sugar consumption and level of activity of a
person
 Sales volume versus expenditures
 Temperature and coffee sales
 Price and demand
 Production and Plant Capacity
 Outdoor temperature and gas consumption
Characteristics of a Relationship
1. The direction of a relationship
a. Positive
b. Negative
2. The form of relationship
a. linear
b. curved (ex. Mood levels
and dosage)
3. The degree of relationship
perfect positive
perfect negative
high degree of positive/ negative
correlation
low degree of positive / negative
correlation
Where and Why Correlations are
Used?
1. Prediction ex. College admission with NCAE or HS
grades
Sales and population
2. Validity ex. Employee performance evaluation should
have tests on skills, achievements and company
contribution of an employee
3. Reliability – it produces stable, consistent
measurements
* when reliability is high, the correlation between two
Correlation and Causation
1. There is a direct cause-and-effect relationship between
variables.
2. There is a reverse cause-and-effect relationship between
variables.
3. The relationship between variables may be caused by a
third value variable.
4. There may be a complexity of interrelationships among
variables.
5. The relationship may be coincidental.
Learning Check!
1. For each of the following, indicate whether you would expect
a positive or negative correlation. Justify.
a. Distance sprinted and recovery time
b. Sugar consumption and activity level for a group of
children
c. Daily high temperature and daily energy consumption for
30 days in the summer.
d. Daily high temperature and daily energy consumption for
30 days on rainy season.
2. The data points would be clustered more
closely around a straight line for a correlation
of -0.80 than for a +0.05. (True or False?)
3. If the data points are tightly clustered together
around a line that slopes down from left to
right, then a good estimate of the correlation
would be +0.90. (True or False?)
4. A correlation can never be greater than +1.00.
(True or False?)
PROBABLE ERROR AND
COEFFICIENT OF
CORRELATION
Correlation Analysis continued…Chapter 2
Probable Error (PE)
It is a statistical device which measures the
reliability and dependability of the value of
coefficient of correlation
PE = 2 x standard error (or) = 0.6745 x standard
error
3
Standard Error (SE)
SE = 1 – r2
√n
PE = 0.6745 x 1 – r²
√n
• if the value of `r’ is less than the PE,
then there is no evidence of correlation
• if the value of `r’ is six times more than
the PE, the correlation is certain and
significant
• By adding and submitting PE from
coefficient of correlation, we can find out
the upper
and lower limits within which the
population coefficient of correlation may
be expected to lie.
Uses of PE
 1) PE is used to determine the limits within
which the population coefficient of correlation
may be expected to lie.
 2) It can be used to test whether the value of
correlation coefficient of a sample is significant
with that of the population
If r = 0.6 and N = 64, find out the PE and SE of the correlation
coefficient. Also determine the limits of population correlation
coefficient
Sol: r = 0.6
N=64
PE = 0.6745 x SE
SE = 1 – r2
√n
= 1 – 0.62 = 1- 0.36 = 0.64 / 8 = 0.08
√64 8
PE = 0.6745 x 0.08
= 0.05396
Limits of Population Correlation Coefficient = r ±
PE
= 0.6 ±0.05396
= 0.54604 to 0.6540
Qn. 2 r and PE have values 0.9 and 0.04 for
two series. Find n.
Sol: PE = 0.04
= 0.6745 x 1 – r2 = 0.04
√n
= 1- 0.9² = 0.04
√n 0.6745
= 1-0.81 = 0.0593
√n
0.19 / √n = 0.05930
0.0593 x √n = 0.19
√n = 0.19 ÷ 0.0593
√n = 3.2
N = 3.2²
= 10.266
N = 10
COEFFICIENT OF
DETERMINATION
Correlation Analysis continued…Chapter 2
Square of Coefficient of
Correlation
*Coefficient of
Determination = (r2)
*Coefficient of Non-
Determination = (K2)
(K2) = 1- r2
The ratio of the explained variance to the total variance
Illustrative Example
 Calculate the coefficient of determination and
non-determination if coefficient of correlation is
0.8
 Coefficient of
determination = r2
= 0.82
= 0.64
=
 Coefficient of non-
determination = K2
=1- 0.82
= 1- 0.64
=
 It is the most widely used algebraic method to measure the
coefficient of correlation
 It gives numerical value to express relationship between
variables
 It gives both direction and degree of relationship between
variables
 It can be used for further algebraic treatment such as
coefficient of determination and non determination
 It gives a single figure to explain the accurate degree of
correlation between two variables
 It is very difficult to compute the value of coefficient of
correlation.
 It is very difficult to understand.
 It requires a complicated mathematical calculation.
 It takes more time
 It is unduly affected by extreme items.
 It assumes a linear relationship between the variables. But in
real life situation, it may not be so.
SPEARMAN’S RANK
CORRELATION METHOD
Correlation Analysis continued…Chapter 2
This was
developed by
Charles Edward
Spearman in 1904
The correlation of coefficient obtained from ranks
of the variables.
6∑D2
Definition
(R) =
Qn: Find the rank correlation between poverty
and overcrowding from the information given
below.
Town A B C D E F G H I J
Poverty 17 13 15 16 6 11 14 9 7 12
Overcro
wding
36 46 35 24 12 18 27 22 2 8
Soln.
6∑D2
6x44
264
990
= 1- 0.2667
= 0.7333
(R) =
(R) =
(R) =
Qn: Following were the ranks given by three
judges in a beauty contest. Determine which
pair of judges has the nearest approach to
common tastes in beauty.
Judge 1 1 6 5 10 3 2 4 9 7 8
Judge 2 3 5 8 4 7 10 2 1 6 9
Judge 3 6 4 9 8 1 2 3 10 5 7
Soln.
6∑D2
6x200
= 1- 1.2121
= 0.2121
6x214
= 1- 1.297
= 0.297
6x60
= 1- 0.364
= 0.636
(R) =
(R) =Rank correlation between I&II
Rank correlation between I&II
Rank correlation between I&III
(R) =
(R) =
Qn: The coefficient rank of the marks obtained by 10
students in statistics & English was 0.2. It was later discovered
that the difference in ranks of one of the students was
wrongly taken as 7 instead of 9. Find the correct result.
 R = 0.2
1-.0.2= 6∑D2
1
6∑D2
6∑D2 = 990x 0.8 = 792
∑D2 = 792/6 = 132-72+92
6∑D2
(R) =
Correct 6∑D2
6x164
10 -10
= 1 - 984
990
= 1- 0.9939
= 0.0061
(R) =
(R) =
(R) = 6∑D2 = 0.8
1 - .08 = 6x33
0.2 x (
Qn: The coefficient rank
of the marks obtained by
10 students in statistics &
English was 0.2. If the sum
of the squares of the
difference in ranks is 33,
find the number of
students in the group.
Computation of Rank Correlation Coefficient
when Ranks are Equal
Where D – Difference of rank in the two series
N - Total number of pairs
m - Number of times each rank repeats
R = 1-
Qn:- Obtain rank correlation co-efficient
for the data:-
X: 68 64 75 50 64 80 75 40 55 64
Y: 62 58 68 45 81 60 68 48 50 70
x y R1 R2
D
(R1-R2)
D²
68 62 4 5 1 1
64 58 6 7 1 1
75 68 2.5 3.5 1 1
50 45 9 10 1 1
64 81 6 1 5 25
80 60 1 6 5 25
75 68 2.5 3.5 1 1
40 48 10 9 1 1
55 50 8 8 0 0
64 70 6 2 4 16
∑D² 72
Merits of Rank Correlation
Method
 It is very simple to understand.
 It can be applied to any type of data, i.e.
quantitative and qualitative
 It is the only way of studying correlation
between qualitative data such as honesty,
beauty etc.
 As the sum of rank differences of the two
qualitative data is always equal to zero, this
Demerits of Rank Correlations
 Rank Correlation Coefficient is only an approximate
measure as the actual values are not used for
calculations.
 It is not convenient when the number of pairs (N) is
large.
 Further algebraic treatment is not possible.
 Combined correlation coefficient of different series
cannot be obtained as in the case of mean and
standard deviation. In case of mean and standard
CONCURRENT
DEVIATION METHOD
Correlation Analysis continued…Chapter 2
Under this method, we only consider the directions
of deviations.
 If deviations of two variables are concurrent, then
they move in the same direction, otherwise in the
opposite direction.
ñ (2c-N)
N
Where N = no. of pairs of symbol
C= No. of concurrent deviations (ie.No. of +signs in `dx dy’
column
r =
±
Steps
1. Every value of `x’ series is compared with its
proceeding value. Increase is shown by`+’ symbol
and decrease by`-’
2. The above step is repeated for `y’ series and we
get `dy’
3. Multiply `dx’ by `dy’ and the product is shown in the
next column. The column heading is `dxdy’
4. Take the total number of `+’ signs in `dxdy’ column.
`+’ signs in `dxdy’ column denotes the concurrent
deviations and it is indicated by `C’
Qn:- Calculate coefficient if correlation
by concurrent deviation method:
Year : 2003 2004 2005 2006 2007 2008 2009 2010 2011
Supply : 160 164 172 182 166 170 178 192 186
Price : 292 280 260 234 266 254 230 190 200
Merits of concurrent deviation
method:
1. It is very easy to calculate coefficient of
correlation
2. It is very simple understand the method
3. When the number of items is very large, this
method may be used to form quick idea
about the degree of relationship
4. This method is more suitable,
Demerits of concurrent deviation
method:
1. This method ignores the magnitude of
changes. Ie. Equal weight is given for small
and big changes.
2. The result obtained by this method is only a
rough indicator of the presence or absence of
correlation
3. Further algebraic treatment is not possible
4. Combined coefficient of concurrent deviation
Thank You!!!

Correlation continued

  • 1.
  • 2.
    Examples of Correlation Sugar consumption and level of activity of a person  Sales volume versus expenditures  Temperature and coffee sales  Price and demand  Production and Plant Capacity  Outdoor temperature and gas consumption
  • 3.
    Characteristics of aRelationship 1. The direction of a relationship a. Positive b. Negative 2. The form of relationship a. linear b. curved (ex. Mood levels and dosage) 3. The degree of relationship perfect positive perfect negative high degree of positive/ negative correlation low degree of positive / negative correlation
  • 4.
    Where and WhyCorrelations are Used? 1. Prediction ex. College admission with NCAE or HS grades Sales and population 2. Validity ex. Employee performance evaluation should have tests on skills, achievements and company contribution of an employee 3. Reliability – it produces stable, consistent measurements * when reliability is high, the correlation between two
  • 5.
    Correlation and Causation 1.There is a direct cause-and-effect relationship between variables. 2. There is a reverse cause-and-effect relationship between variables. 3. The relationship between variables may be caused by a third value variable. 4. There may be a complexity of interrelationships among variables. 5. The relationship may be coincidental.
  • 6.
    Learning Check! 1. Foreach of the following, indicate whether you would expect a positive or negative correlation. Justify. a. Distance sprinted and recovery time b. Sugar consumption and activity level for a group of children c. Daily high temperature and daily energy consumption for 30 days in the summer. d. Daily high temperature and daily energy consumption for 30 days on rainy season.
  • 7.
    2. The datapoints would be clustered more closely around a straight line for a correlation of -0.80 than for a +0.05. (True or False?) 3. If the data points are tightly clustered together around a line that slopes down from left to right, then a good estimate of the correlation would be +0.90. (True or False?) 4. A correlation can never be greater than +1.00. (True or False?)
  • 8.
    PROBABLE ERROR AND COEFFICIENTOF CORRELATION Correlation Analysis continued…Chapter 2
  • 9.
    Probable Error (PE) Itis a statistical device which measures the reliability and dependability of the value of coefficient of correlation PE = 2 x standard error (or) = 0.6745 x standard error 3
  • 10.
    Standard Error (SE) SE= 1 – r2 √n PE = 0.6745 x 1 – r² √n • if the value of `r’ is less than the PE, then there is no evidence of correlation • if the value of `r’ is six times more than the PE, the correlation is certain and significant • By adding and submitting PE from coefficient of correlation, we can find out the upper and lower limits within which the population coefficient of correlation may be expected to lie.
  • 11.
    Uses of PE 1) PE is used to determine the limits within which the population coefficient of correlation may be expected to lie.  2) It can be used to test whether the value of correlation coefficient of a sample is significant with that of the population
  • 12.
    If r =0.6 and N = 64, find out the PE and SE of the correlation coefficient. Also determine the limits of population correlation coefficient Sol: r = 0.6 N=64 PE = 0.6745 x SE SE = 1 – r2 √n = 1 – 0.62 = 1- 0.36 = 0.64 / 8 = 0.08 √64 8 PE = 0.6745 x 0.08 = 0.05396 Limits of Population Correlation Coefficient = r ± PE = 0.6 ±0.05396 = 0.54604 to 0.6540
  • 13.
    Qn. 2 rand PE have values 0.9 and 0.04 for two series. Find n. Sol: PE = 0.04 = 0.6745 x 1 – r2 = 0.04 √n = 1- 0.9² = 0.04 √n 0.6745 = 1-0.81 = 0.0593 √n 0.19 / √n = 0.05930 0.0593 x √n = 0.19 √n = 0.19 ÷ 0.0593 √n = 3.2 N = 3.2² = 10.266 N = 10
  • 14.
  • 15.
    Square of Coefficientof Correlation *Coefficient of Determination = (r2) *Coefficient of Non- Determination = (K2) (K2) = 1- r2 The ratio of the explained variance to the total variance
  • 16.
    Illustrative Example  Calculatethe coefficient of determination and non-determination if coefficient of correlation is 0.8  Coefficient of determination = r2 = 0.82 = 0.64 =  Coefficient of non- determination = K2 =1- 0.82 = 1- 0.64 =
  • 17.
     It isthe most widely used algebraic method to measure the coefficient of correlation  It gives numerical value to express relationship between variables  It gives both direction and degree of relationship between variables  It can be used for further algebraic treatment such as coefficient of determination and non determination  It gives a single figure to explain the accurate degree of correlation between two variables
  • 18.
     It isvery difficult to compute the value of coefficient of correlation.  It is very difficult to understand.  It requires a complicated mathematical calculation.  It takes more time  It is unduly affected by extreme items.  It assumes a linear relationship between the variables. But in real life situation, it may not be so.
  • 19.
  • 20.
    This was developed by CharlesEdward Spearman in 1904 The correlation of coefficient obtained from ranks of the variables. 6∑D2 Definition (R) =
  • 21.
    Qn: Find therank correlation between poverty and overcrowding from the information given below. Town A B C D E F G H I J Poverty 17 13 15 16 6 11 14 9 7 12 Overcro wding 36 46 35 24 12 18 27 22 2 8
  • 22.
  • 23.
    Qn: Following werethe ranks given by three judges in a beauty contest. Determine which pair of judges has the nearest approach to common tastes in beauty. Judge 1 1 6 5 10 3 2 4 9 7 8 Judge 2 3 5 8 4 7 10 2 1 6 9 Judge 3 6 4 9 8 1 2 3 10 5 7
  • 24.
    Soln. 6∑D2 6x200 = 1- 1.2121 =0.2121 6x214 = 1- 1.297 = 0.297 6x60 = 1- 0.364 = 0.636 (R) = (R) =Rank correlation between I&II Rank correlation between I&II Rank correlation between I&III (R) = (R) =
  • 25.
    Qn: The coefficientrank of the marks obtained by 10 students in statistics & English was 0.2. It was later discovered that the difference in ranks of one of the students was wrongly taken as 7 instead of 9. Find the correct result.  R = 0.2 1-.0.2= 6∑D2 1 6∑D2 6∑D2 = 990x 0.8 = 792 ∑D2 = 792/6 = 132-72+92 6∑D2 (R) =
  • 26.
    Correct 6∑D2 6x164 10 -10 =1 - 984 990 = 1- 0.9939 = 0.0061 (R) = (R) =
  • 27.
    (R) = 6∑D2= 0.8 1 - .08 = 6x33 0.2 x ( Qn: The coefficient rank of the marks obtained by 10 students in statistics & English was 0.2. If the sum of the squares of the difference in ranks is 33, find the number of students in the group.
  • 28.
    Computation of RankCorrelation Coefficient when Ranks are Equal Where D – Difference of rank in the two series N - Total number of pairs m - Number of times each rank repeats R = 1-
  • 29.
    Qn:- Obtain rankcorrelation co-efficient for the data:- X: 68 64 75 50 64 80 75 40 55 64 Y: 62 58 68 45 81 60 68 48 50 70
  • 30.
    x y R1R2 D (R1-R2) D² 68 62 4 5 1 1 64 58 6 7 1 1 75 68 2.5 3.5 1 1 50 45 9 10 1 1 64 81 6 1 5 25 80 60 1 6 5 25 75 68 2.5 3.5 1 1 40 48 10 9 1 1 55 50 8 8 0 0 64 70 6 2 4 16 ∑D² 72
  • 31.
    Merits of RankCorrelation Method  It is very simple to understand.  It can be applied to any type of data, i.e. quantitative and qualitative  It is the only way of studying correlation between qualitative data such as honesty, beauty etc.  As the sum of rank differences of the two qualitative data is always equal to zero, this
  • 32.
    Demerits of RankCorrelations  Rank Correlation Coefficient is only an approximate measure as the actual values are not used for calculations.  It is not convenient when the number of pairs (N) is large.  Further algebraic treatment is not possible.  Combined correlation coefficient of different series cannot be obtained as in the case of mean and standard deviation. In case of mean and standard
  • 33.
  • 34.
    Under this method,we only consider the directions of deviations.  If deviations of two variables are concurrent, then they move in the same direction, otherwise in the opposite direction. √± (2c-N) N Where N = no. of pairs of symbol C= No. of concurrent deviations (ie.No. of +signs in `dx dy’ column r = ±
  • 35.
    Steps 1. Every valueof `x’ series is compared with its proceeding value. Increase is shown by`+’ symbol and decrease by`-’ 2. The above step is repeated for `y’ series and we get `dy’ 3. Multiply `dx’ by `dy’ and the product is shown in the next column. The column heading is `dxdy’ 4. Take the total number of `+’ signs in `dxdy’ column. `+’ signs in `dxdy’ column denotes the concurrent deviations and it is indicated by `C’
  • 36.
    Qn:- Calculate coefficientif correlation by concurrent deviation method: Year : 2003 2004 2005 2006 2007 2008 2009 2010 2011 Supply : 160 164 172 182 166 170 178 192 186 Price : 292 280 260 234 266 254 230 190 200
  • 37.
    Merits of concurrentdeviation method: 1. It is very easy to calculate coefficient of correlation 2. It is very simple understand the method 3. When the number of items is very large, this method may be used to form quick idea about the degree of relationship 4. This method is more suitable,
  • 38.
    Demerits of concurrentdeviation method: 1. This method ignores the magnitude of changes. Ie. Equal weight is given for small and big changes. 2. The result obtained by this method is only a rough indicator of the presence or absence of correlation 3. Further algebraic treatment is not possible 4. Combined coefficient of concurrent deviation
  • 39.