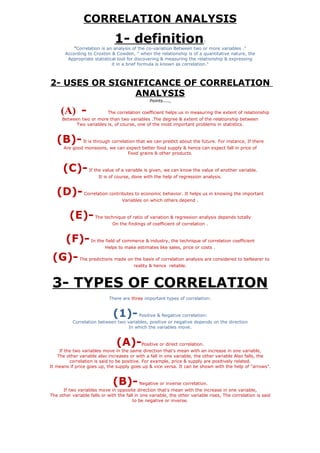
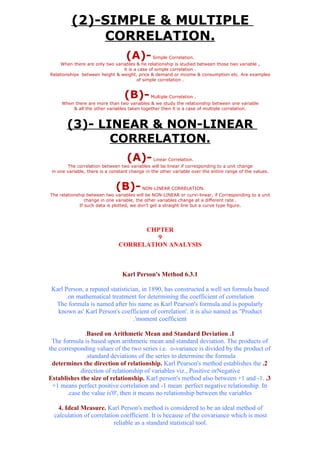
CORRELATION ANALYSIS
                               1- definition                               :
           "Correlation is an analysis of the co-variation Between two or more variables ."
       According to Croxton & Cowden, " when the relationship is of a quantitative nature, the
        Appropriate statistical tool for discovering & measuring the relationship & expressing
                             it in a brief formula is known as correlation."


2- USES OR SIGNIFICANCE OF CORRELATION
               ANALYSIS
                                                Points....,

     (A) -                  The correlation coefficient helps us in measuring the extent of relationship
     Between two or more than two variables .The degree & extent of the relationship between
           Two variables is, of course, one of the most important problems in statistics.


   (B)-         It is through correlation that we can predict about the future. For instance, If there
      Are good monsoons, we can expect better food supply & hence can expect fall in price of
                                 Food grains & other products.


      (C)-         If the value of a variable is given, we can know the value of another variable.
                       It is of course, done with the help of regression analysis.


   (D)-         Correlation contributes to economic behavior. It helps us in knowing the important
                                   Variables on which others depend .


         (E)-         The technique of ratio of variation & regression analysis depends totally
                              On the findings of coefficient of correlation .


       (F)-         In the field of commerce & industry, the technique of correlation coefficient
                           Helps to make estimates like sales, price or costs .

 (G)-         The predictions made on the basis of correlation analysis are considered to beNearer to
                                         reality & hence reliable.


 3- TYPES OF CORRELATION
                             There are three important types of correlation:


                              (1)-         Positive & Negative correlation:
           Correlation between two variables, positive or negative depends on the direction
                                    In which the variables move.


                                (A)-        Positive or direct correlation.
     If the two variables move in the same direction that's mean with an increase in one variable,
    The other variable also increases or with a fall in one variable, the other variable Also falls, the
          correlation is said to be positive. For example, price & supply are positively related.
It means if price goes up, the supply goes up & vice versa. It can be shown with the help of "arrows".


                              (B)-         Negative or inverse correlation.
      If two variables move in opposite direction that's mean with the increase in one variable,
The other variable falls or with the fall in one variable, the other variable rises, The correlation is said
                                        to be negative or inverse.
(2)-SIMPLE & MULTIPLE
              CORRELATION.
                                   (A)-         Simple Correlation.
     When there are only two variables & he relationship is studied between those two variable ,
                                 it is a case of simple correlation .
Relationships between height & weight, price & demand or income & consumption etc. Are examples
                                        of simple correlation .


                                   (B)-        Multiple Correlation .
     When there are more than two variables & we study the relationship between one variable
         & all the other variables taken together then it is a case of multiple correlation.


        (3)- LINEAR & NON-LINEAR
               CORRELATION.
                                    (A)-        Linear Correlation.
        The correlation between two variables will be linear if corresponding to a unit change
 in one variable, there is a constant change in the other variable over the entire range of the values.


                               (B)-        NON-LINEAR CORRELATION.
The relationship between two variables will be NON-LINEAR or curvi-linear, if Corresponding to a unit
                change in one variable, the other variables change at a different rate .
             If such data is plotted, we don't get a straight line but a curve type figure.


                                      CHPTER
                                         9
                                CORRELATION ANALYSIS


                                  Karl Person's Method 6.3.1

 Karl Person, a reputed statistician, in 1890, has constructed a well set formula based
      .on mathematical treatment for determining the coefficient of correlation
  The formula is named after his name as Karl Pearson's formula and is popularly
   known as' Karl Person's coefficient of correlation'. it is also named as "Product
                                  .'moment coefficient

              .Based on Arithmetic Mean and Standard Deviation .1
 The formula is based upon arithmetic mean and standard deviation. The products of
the corresponding values of the two series i.e. o-variance is divided by the product of
               .standard deviations of the series to determine the formula
 determines the direction of relationship. Karl Pearson's method establishes the .2
            .direction of relationship of variables viz., Positive orNegative
Establishes the size of relationship. Karl person's method also between +1 and -1. .3
 +1 means perfect positive correlation and -1 mean perfect negative relationship. In
       .case the value is'0', then it means no relationship between the variables

   4. Ideal Measure. Karl Person's method is considered to be an ideal method of
  calculation of correlation coefficient. It is because of the covariance which is most
                          reliable as a standard statistical tool.
CHAPTER
                                          10

                             REGRESSION ANALYSIS

   1. INTRODUCTION

   The analysis of coefficient of correlation between tow variables : examines the
   extent and degree of cor-relationship between two variables co-vary in a given
   period of study. The statistical technique of estimating or predicting the
   unknown value of a dependent variable from the known value of an
   independent variable is called regression analysis.
   Regression is more useful for business planning and forecasting.

Definitions:
    According to Morris M. Blair “Regression is the measure of the average
   relationship between two or more variables in terms of the original units of
   the data."


   2. CLASSIFICATION OF REGRESSION ANALYSIS

   The regression analysis can be classified on the following bases:-
   2.1. Change in Proportion; and
   2.2. Number of variables.

   2.1.1. Linear Regression Analysis Model

   When dependent variable moves in a fixed proportion of the unit movement of the
   unit movement of independent variable, it is called a linear regression.
   Linear regression, when plotted on a graph paper, forms a straight line.
   Mathematically the relation between X and Y variables can be expressed by a
   simple linear regression equation as under-


                                      Yi = a + bxi + ei
   Where a and b are known as regression parameters.


2.1.2. Non-linear regression Analysis

Contrary to the liner regression model, in non-linear regression, the value of
dependent variable say 'y' dose not change by a constant absolute amount for unit
change in the value of the independent variable, say 'x'. If the data are plotted on
graph, it would form a curve, rather than a straight line. This is called curvi-linear
regression.
9. UTILITY/UES OF REGRESSION ANALYSIS

Prediction of Unknown Value: The regression analysis technique is very useful in .1
predicting the probable value of an unknown variable in response to some known
.related variable

Nature of Relationship: The regression device is useful in establishing the nature .2
.of the relationship between two variables

Estimation of Relationship: Regression analysis is extensively used for the .3
.measurement and estimation of the relationship among variables

    Calculation of Co-efficient of determination: The regression analysis.3
    provides regression co-efficient which are generally used in calculation of
    Co-efficient of Correlation. The square of co-efficient of correlation
    .r ) is called the co-efficient of determination ) .4
    .5
Helpful in calculation of error: Regression analysis is very helpful in estimating .5
.the error involved in using the regression line as a basis for estimation

Police formulation: The predictions made on the basis of estimated inter- .6
relationship through the techniques of regression analysis provide sound basis for
.police formulation in socio- economic fields

Touch stone of hypothesis: The regression tool is considered to be a pertinent .7
.testing tool in statistical methodology


                10. LIMITATION OF REGRESSION ANALYSIS


1. Assumption of liner relationship: Regression analysis is based on the assumption
that there always exists liner relationship between related variables.

2. Assumption of static condition: while calculating the regression equation a static
condition of relationship between the variables is presumed.

3. Study of relationship in prescribed limits: The linear relationship between the
variables can only be ascertained within limits.

Business methmitcs

  • 1.
    CORRELATION ANALYSIS 1- definition : "Correlation is an analysis of the co-variation Between two or more variables ." According to Croxton & Cowden, " when the relationship is of a quantitative nature, the Appropriate statistical tool for discovering & measuring the relationship & expressing it in a brief formula is known as correlation." 2- USES OR SIGNIFICANCE OF CORRELATION ANALYSIS Points...., (A) - The correlation coefficient helps us in measuring the extent of relationship Between two or more than two variables .The degree & extent of the relationship between Two variables is, of course, one of the most important problems in statistics. (B)- It is through correlation that we can predict about the future. For instance, If there Are good monsoons, we can expect better food supply & hence can expect fall in price of Food grains & other products. (C)- If the value of a variable is given, we can know the value of another variable. It is of course, done with the help of regression analysis. (D)- Correlation contributes to economic behavior. It helps us in knowing the important Variables on which others depend . (E)- The technique of ratio of variation & regression analysis depends totally On the findings of coefficient of correlation . (F)- In the field of commerce & industry, the technique of correlation coefficient Helps to make estimates like sales, price or costs . (G)- The predictions made on the basis of correlation analysis are considered to beNearer to reality & hence reliable. 3- TYPES OF CORRELATION There are three important types of correlation: (1)- Positive & Negative correlation: Correlation between two variables, positive or negative depends on the direction In which the variables move. (A)- Positive or direct correlation. If the two variables move in the same direction that's mean with an increase in one variable, The other variable also increases or with a fall in one variable, the other variable Also falls, the correlation is said to be positive. For example, price & supply are positively related. It means if price goes up, the supply goes up & vice versa. It can be shown with the help of "arrows". (B)- Negative or inverse correlation. If two variables move in opposite direction that's mean with the increase in one variable, The other variable falls or with the fall in one variable, the other variable rises, The correlation is said to be negative or inverse.
  • 2.
    (2)-SIMPLE & MULTIPLE CORRELATION. (A)- Simple Correlation. When there are only two variables & he relationship is studied between those two variable , it is a case of simple correlation . Relationships between height & weight, price & demand or income & consumption etc. Are examples of simple correlation . (B)- Multiple Correlation . When there are more than two variables & we study the relationship between one variable & all the other variables taken together then it is a case of multiple correlation. (3)- LINEAR & NON-LINEAR CORRELATION. (A)- Linear Correlation. The correlation between two variables will be linear if corresponding to a unit change in one variable, there is a constant change in the other variable over the entire range of the values. (B)- NON-LINEAR CORRELATION. The relationship between two variables will be NON-LINEAR or curvi-linear, if Corresponding to a unit change in one variable, the other variables change at a different rate . If such data is plotted, we don't get a straight line but a curve type figure. CHPTER 9 CORRELATION ANALYSIS Karl Person's Method 6.3.1 Karl Person, a reputed statistician, in 1890, has constructed a well set formula based .on mathematical treatment for determining the coefficient of correlation The formula is named after his name as Karl Pearson's formula and is popularly known as' Karl Person's coefficient of correlation'. it is also named as "Product .'moment coefficient .Based on Arithmetic Mean and Standard Deviation .1 The formula is based upon arithmetic mean and standard deviation. The products of the corresponding values of the two series i.e. o-variance is divided by the product of .standard deviations of the series to determine the formula determines the direction of relationship. Karl Pearson's method establishes the .2 .direction of relationship of variables viz., Positive orNegative Establishes the size of relationship. Karl person's method also between +1 and -1. .3 +1 means perfect positive correlation and -1 mean perfect negative relationship. In .case the value is'0', then it means no relationship between the variables 4. Ideal Measure. Karl Person's method is considered to be an ideal method of calculation of correlation coefficient. It is because of the covariance which is most reliable as a standard statistical tool.
  • 3.
    CHAPTER 10 REGRESSION ANALYSIS 1. INTRODUCTION The analysis of coefficient of correlation between tow variables : examines the extent and degree of cor-relationship between two variables co-vary in a given period of study. The statistical technique of estimating or predicting the unknown value of a dependent variable from the known value of an independent variable is called regression analysis. Regression is more useful for business planning and forecasting. Definitions: According to Morris M. Blair “Regression is the measure of the average relationship between two or more variables in terms of the original units of the data." 2. CLASSIFICATION OF REGRESSION ANALYSIS The regression analysis can be classified on the following bases:- 2.1. Change in Proportion; and 2.2. Number of variables. 2.1.1. Linear Regression Analysis Model When dependent variable moves in a fixed proportion of the unit movement of the unit movement of independent variable, it is called a linear regression. Linear regression, when plotted on a graph paper, forms a straight line. Mathematically the relation between X and Y variables can be expressed by a simple linear regression equation as under- Yi = a + bxi + ei Where a and b are known as regression parameters. 2.1.2. Non-linear regression Analysis Contrary to the liner regression model, in non-linear regression, the value of dependent variable say 'y' dose not change by a constant absolute amount for unit change in the value of the independent variable, say 'x'. If the data are plotted on graph, it would form a curve, rather than a straight line. This is called curvi-linear regression.
  • 4.
    9. UTILITY/UES OFREGRESSION ANALYSIS Prediction of Unknown Value: The regression analysis technique is very useful in .1 predicting the probable value of an unknown variable in response to some known .related variable Nature of Relationship: The regression device is useful in establishing the nature .2 .of the relationship between two variables Estimation of Relationship: Regression analysis is extensively used for the .3 .measurement and estimation of the relationship among variables Calculation of Co-efficient of determination: The regression analysis.3 provides regression co-efficient which are generally used in calculation of Co-efficient of Correlation. The square of co-efficient of correlation .r ) is called the co-efficient of determination ) .4 .5 Helpful in calculation of error: Regression analysis is very helpful in estimating .5 .the error involved in using the regression line as a basis for estimation Police formulation: The predictions made on the basis of estimated inter- .6 relationship through the techniques of regression analysis provide sound basis for .police formulation in socio- economic fields Touch stone of hypothesis: The regression tool is considered to be a pertinent .7 .testing tool in statistical methodology 10. LIMITATION OF REGRESSION ANALYSIS 1. Assumption of liner relationship: Regression analysis is based on the assumption that there always exists liner relationship between related variables. 2. Assumption of static condition: while calculating the regression equation a static condition of relationship between the variables is presumed. 3. Study of relationship in prescribed limits: The linear relationship between the variables can only be ascertained within limits.