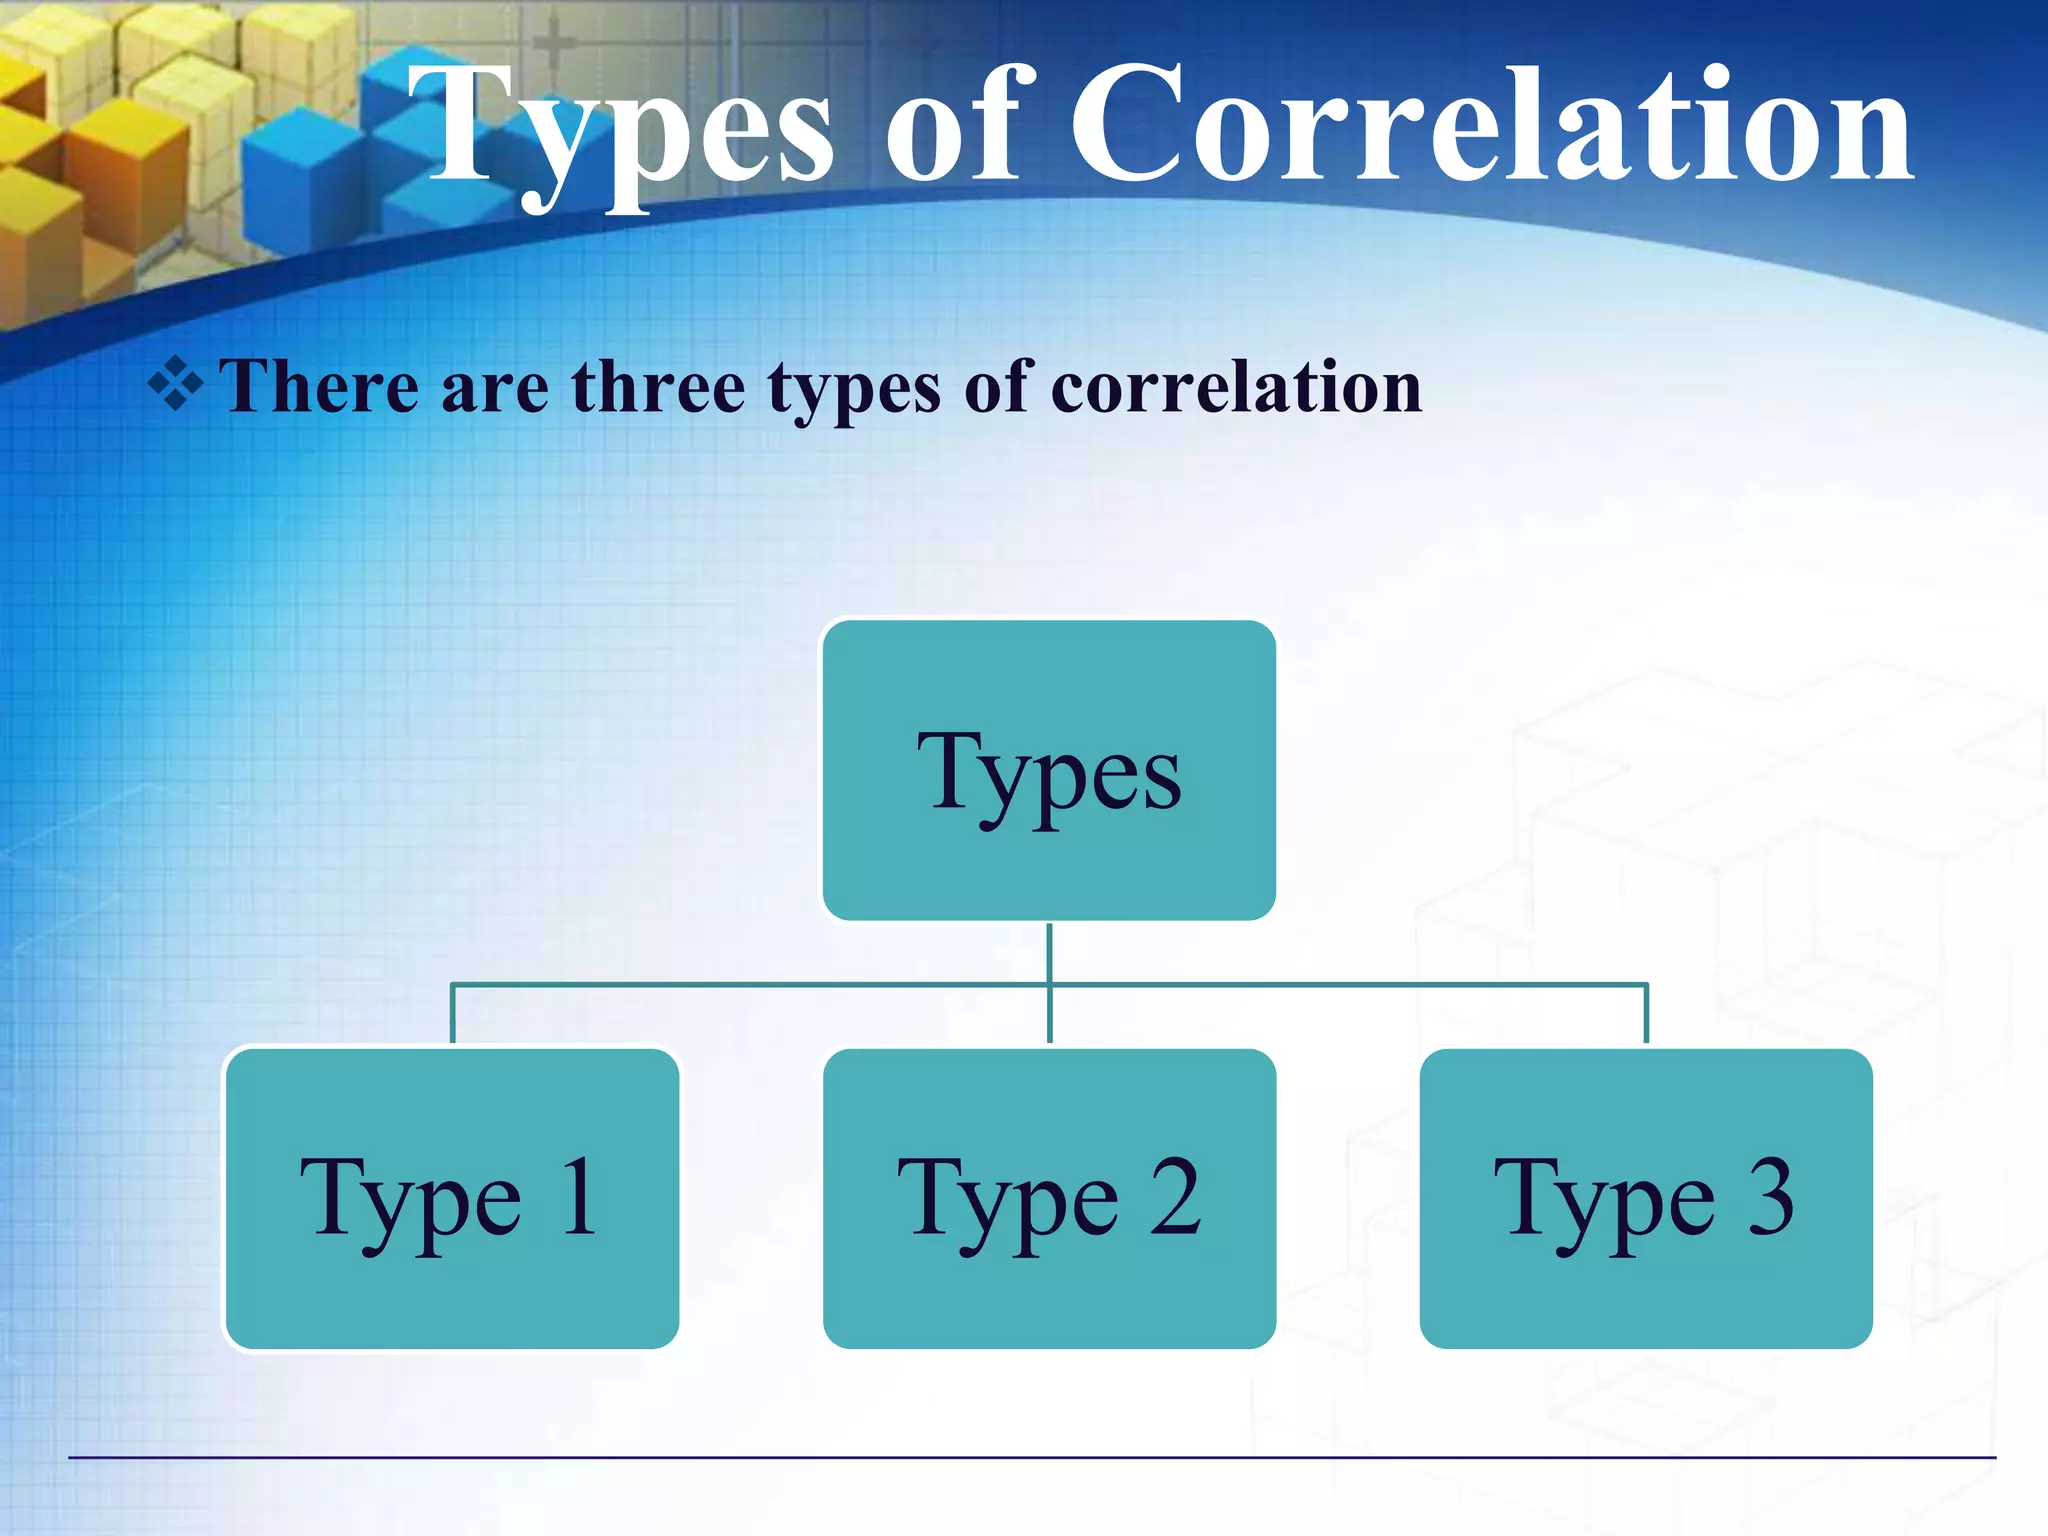
The document discusses correlation analysis and different types of correlation. It defines correlation as the linear association between two random variables. There are three main types of correlation:
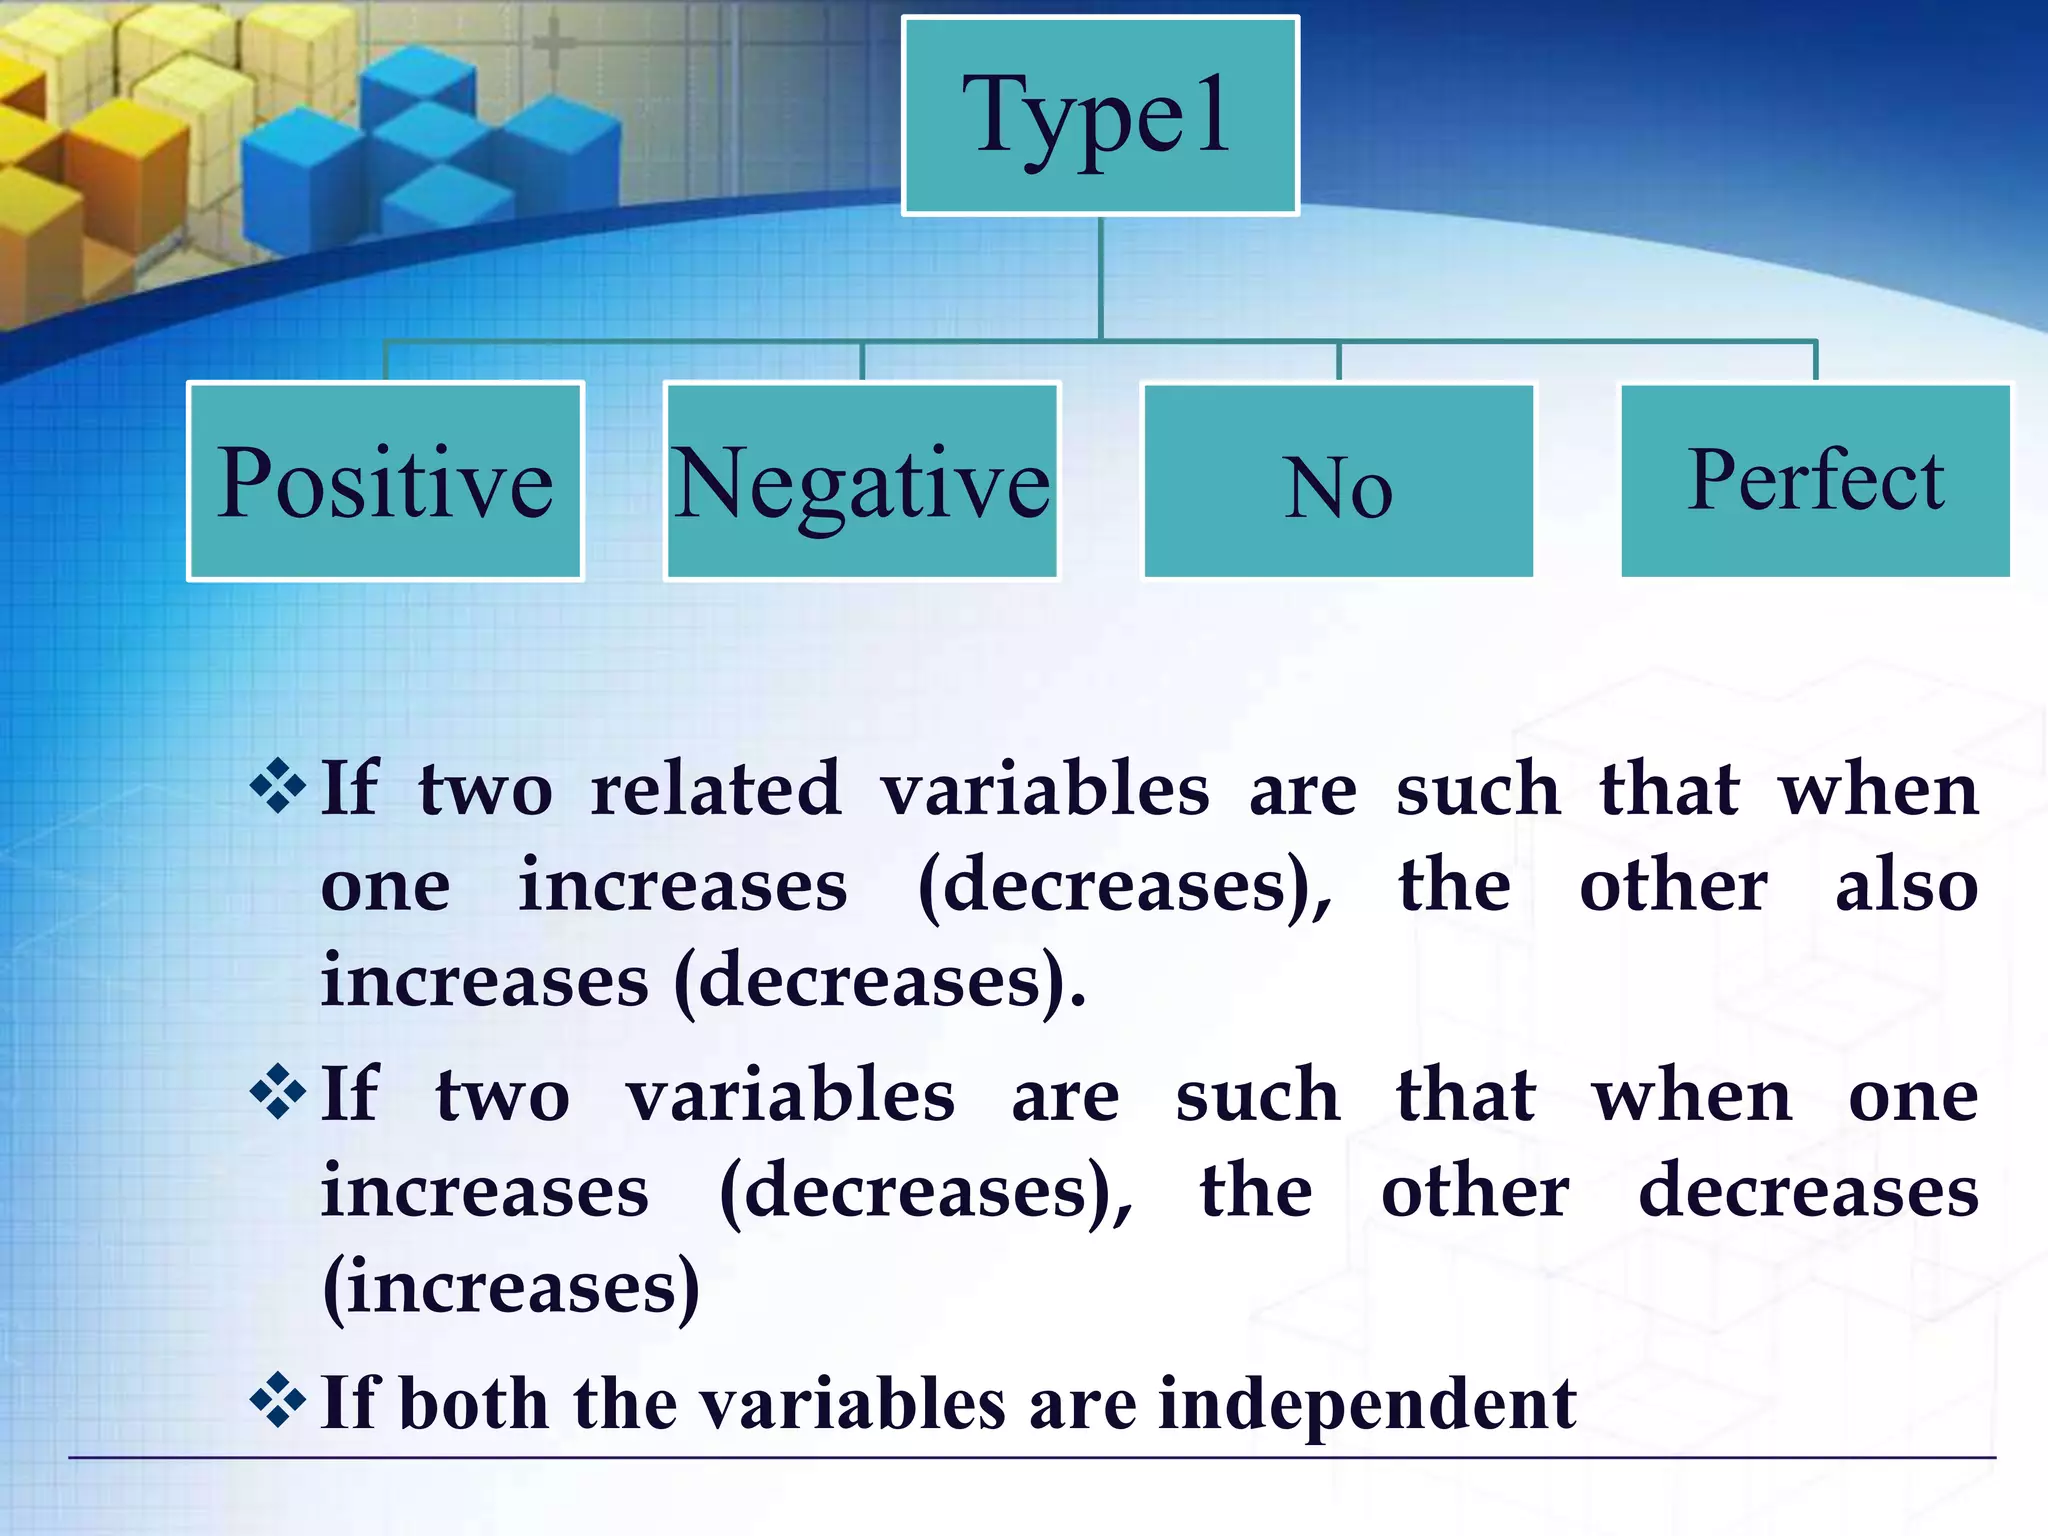
1) Positive vs negative vs no correlation based on the relationship between two variables as one increases or decreases.
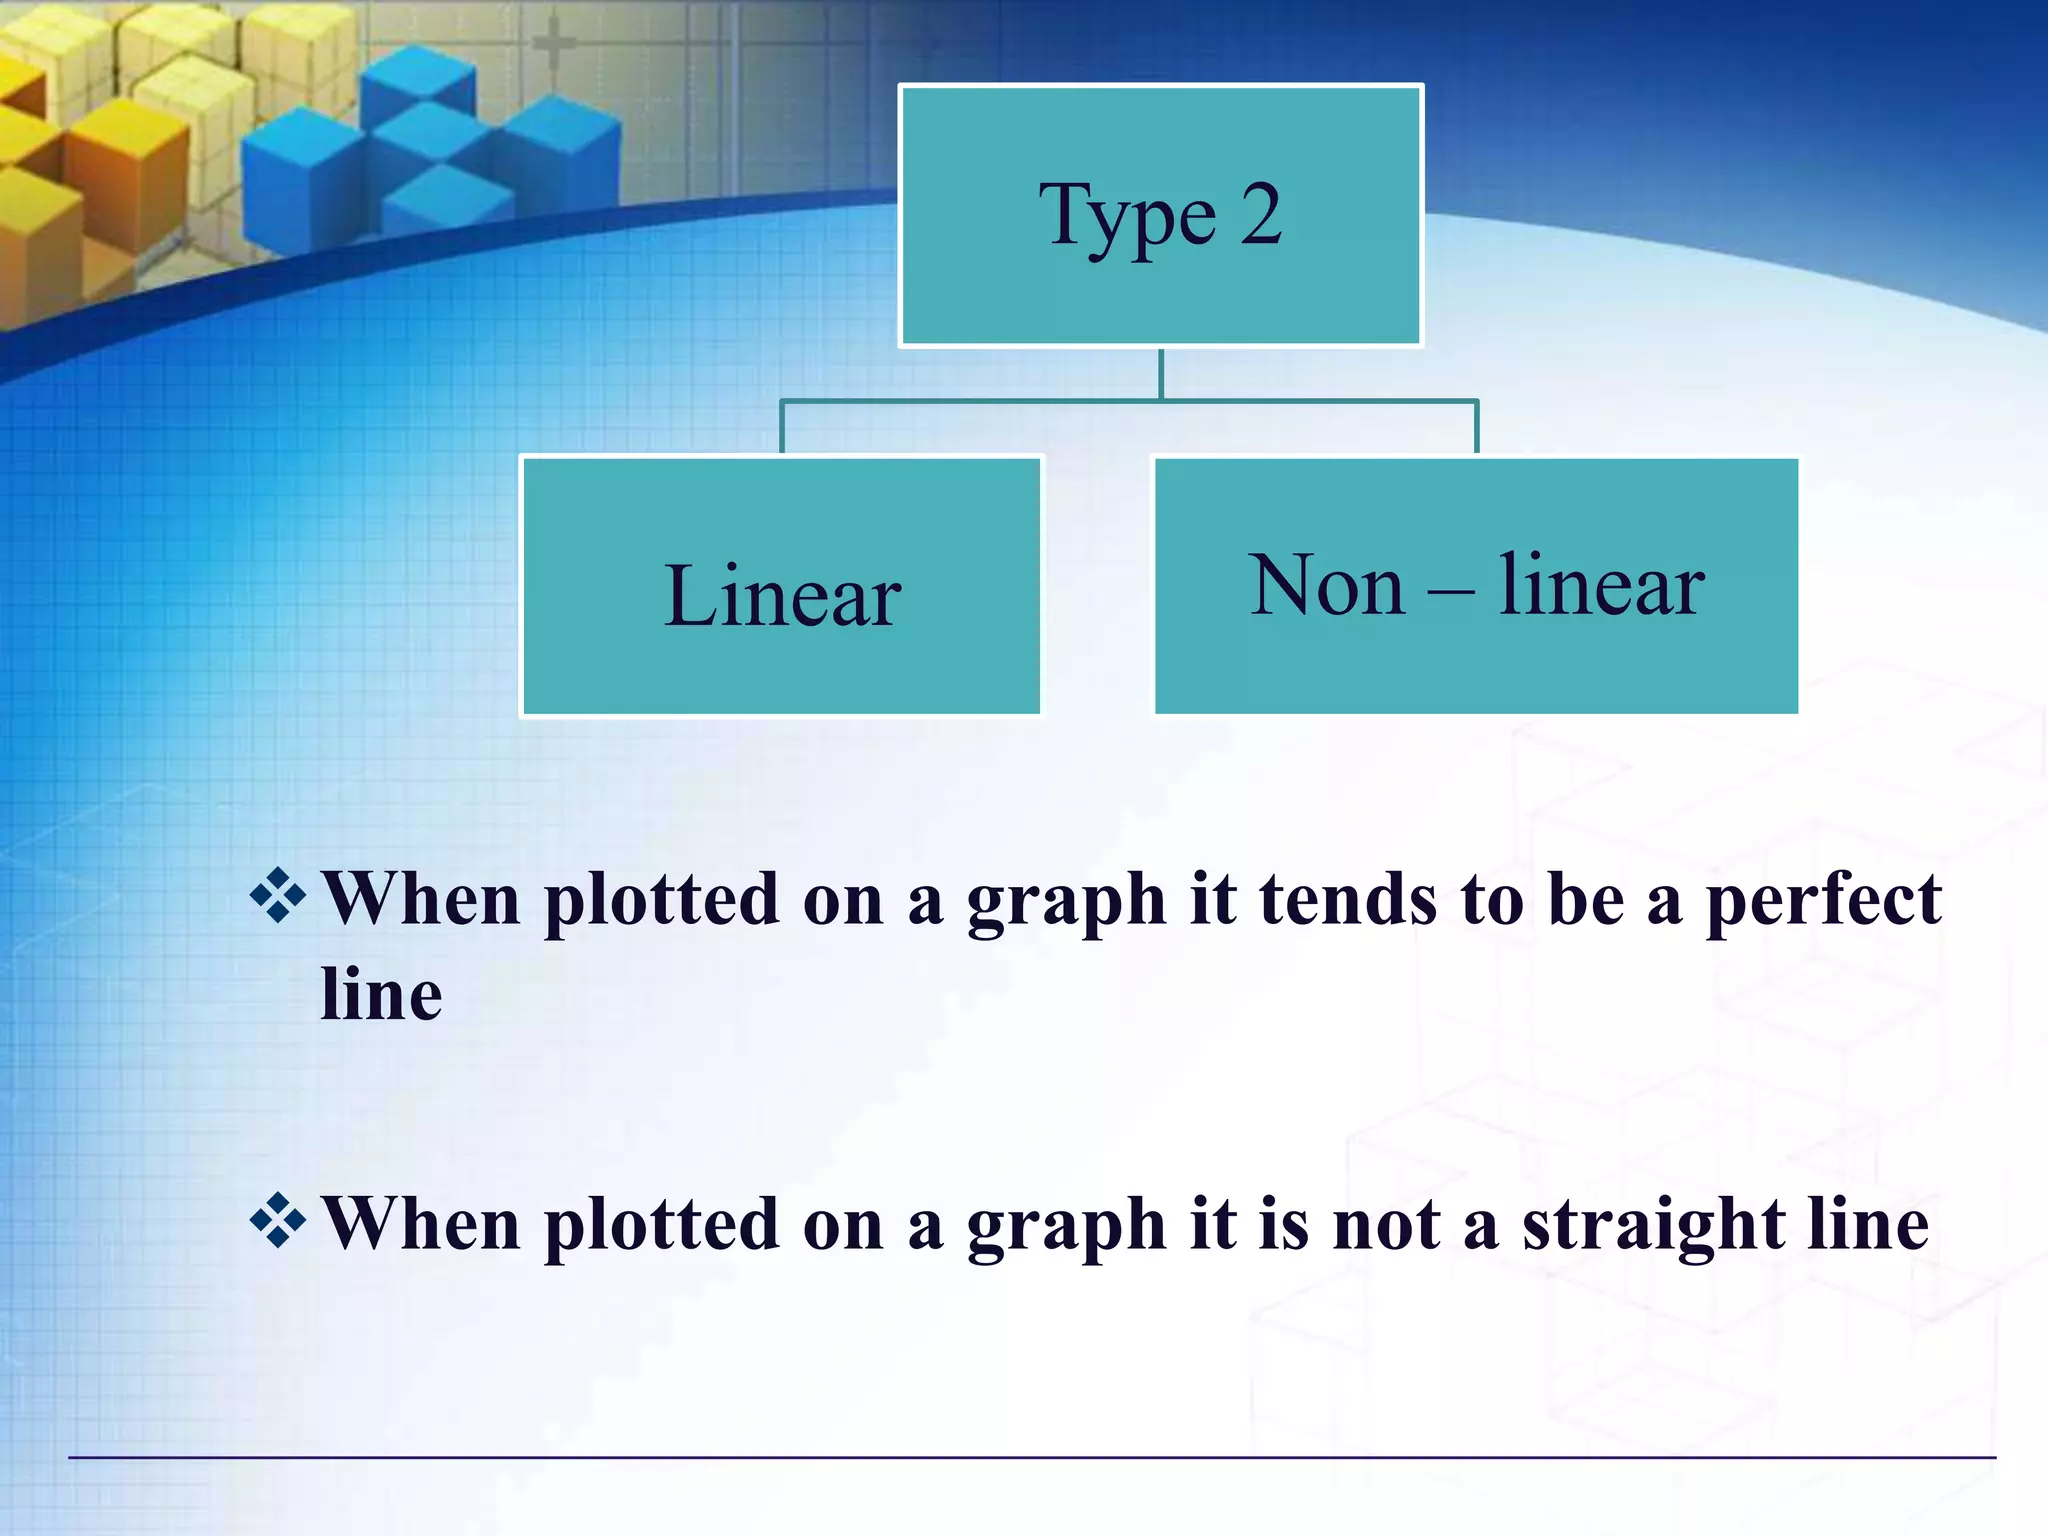
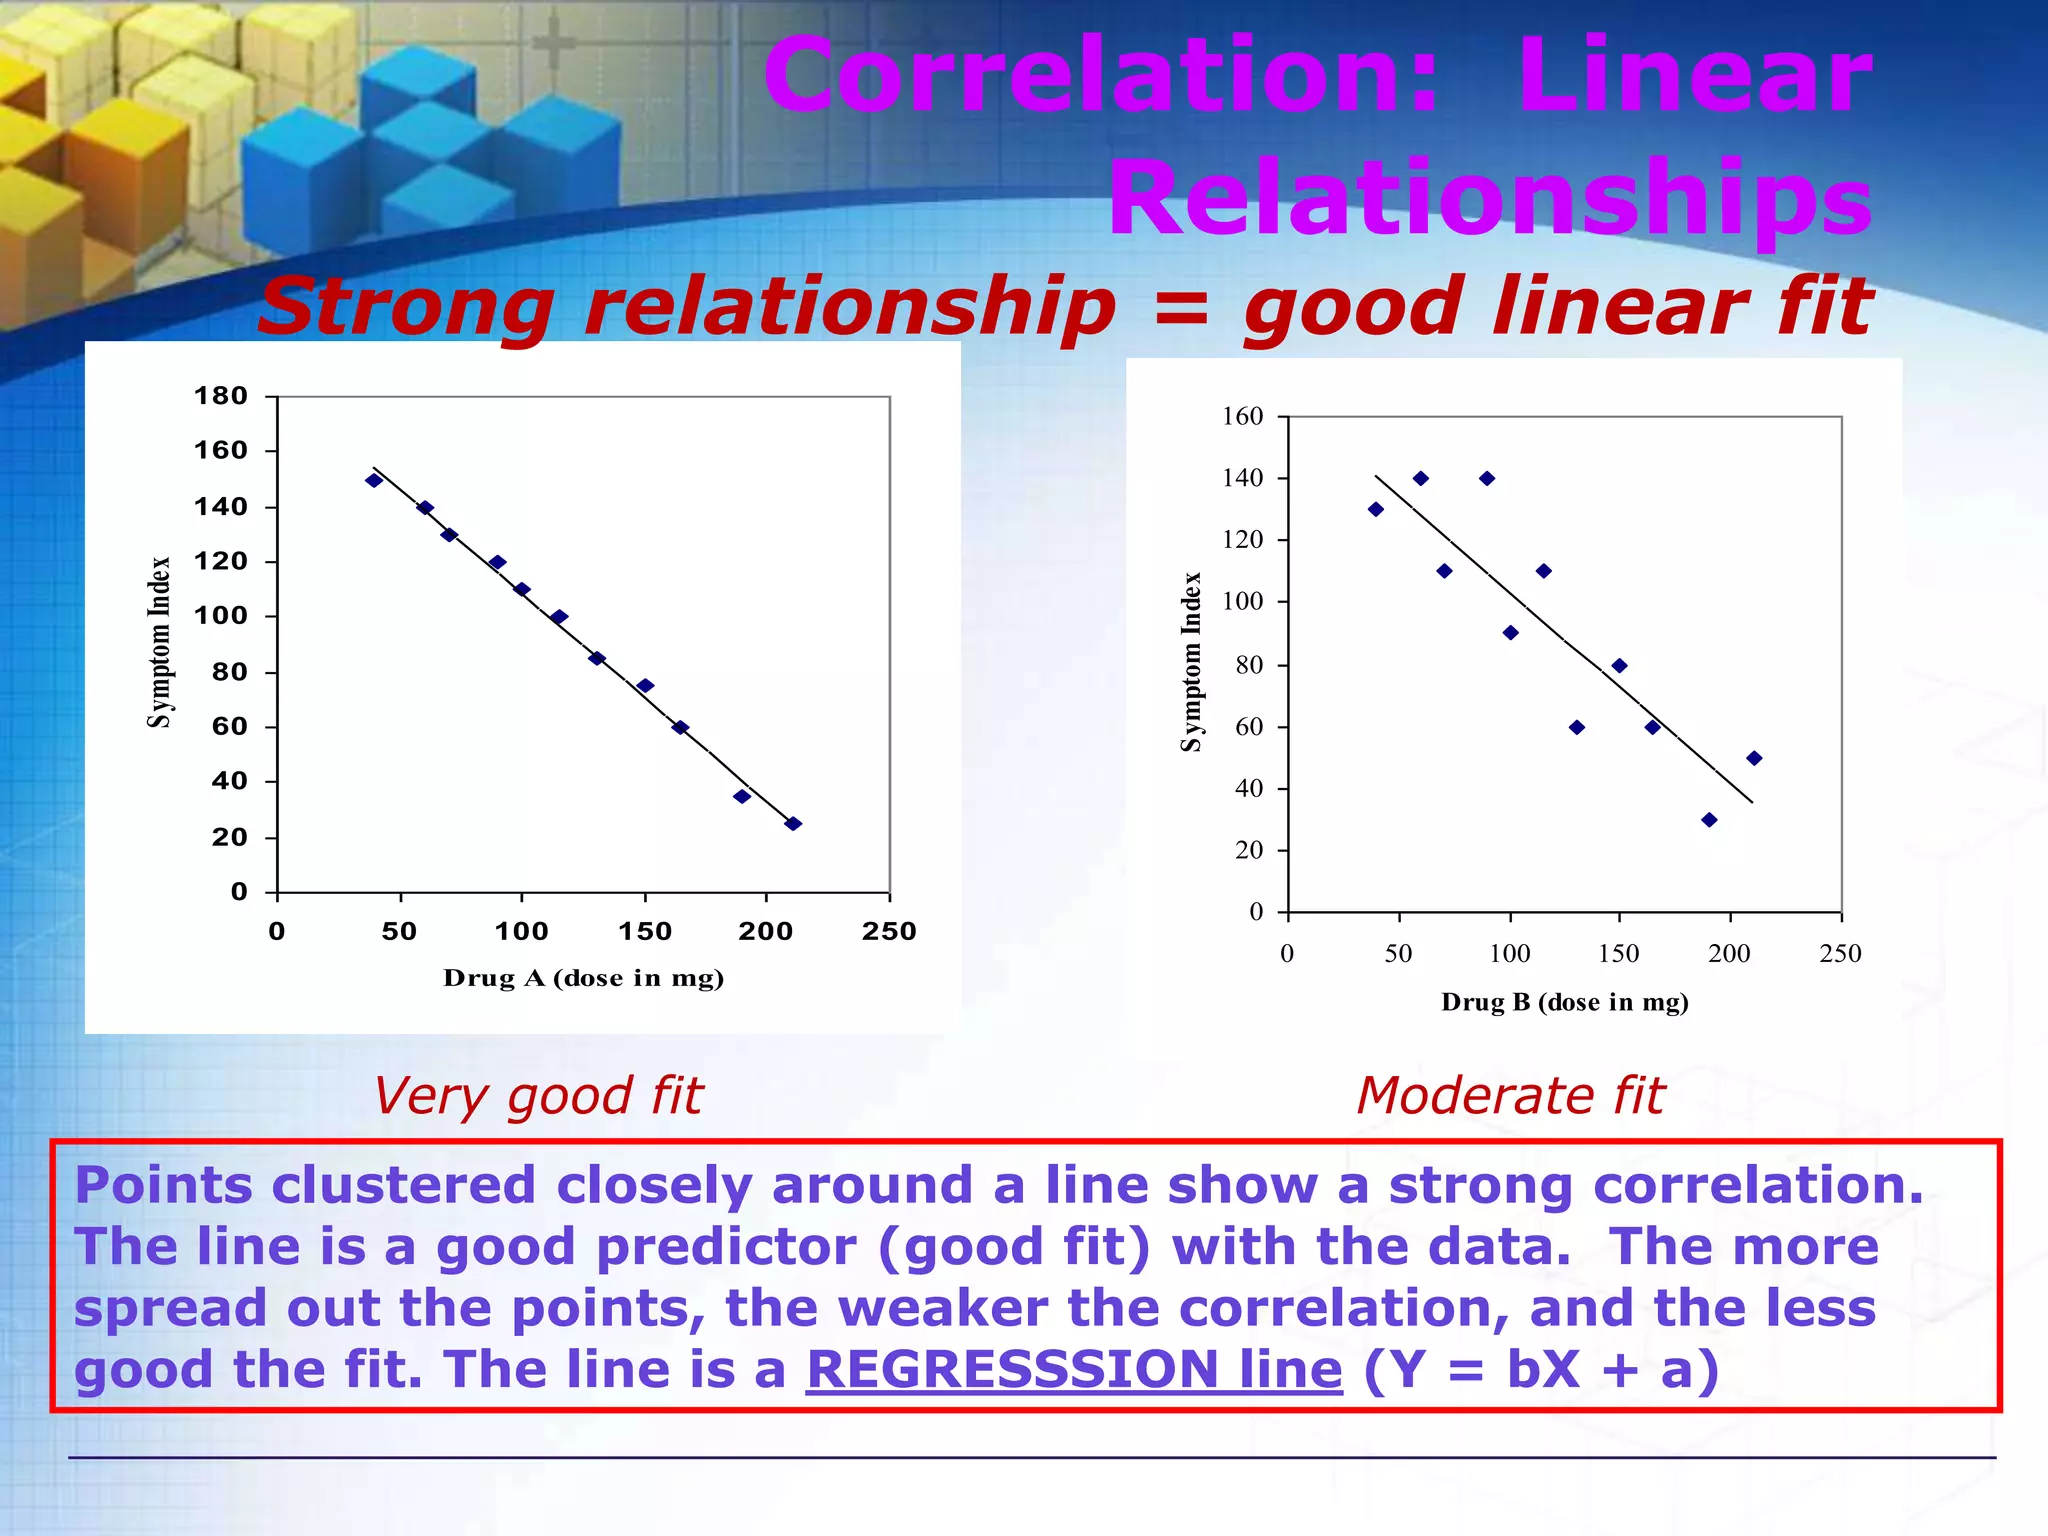
2) Linear vs non-linear correlation based on the shape of the relationship when plotted on a graph.
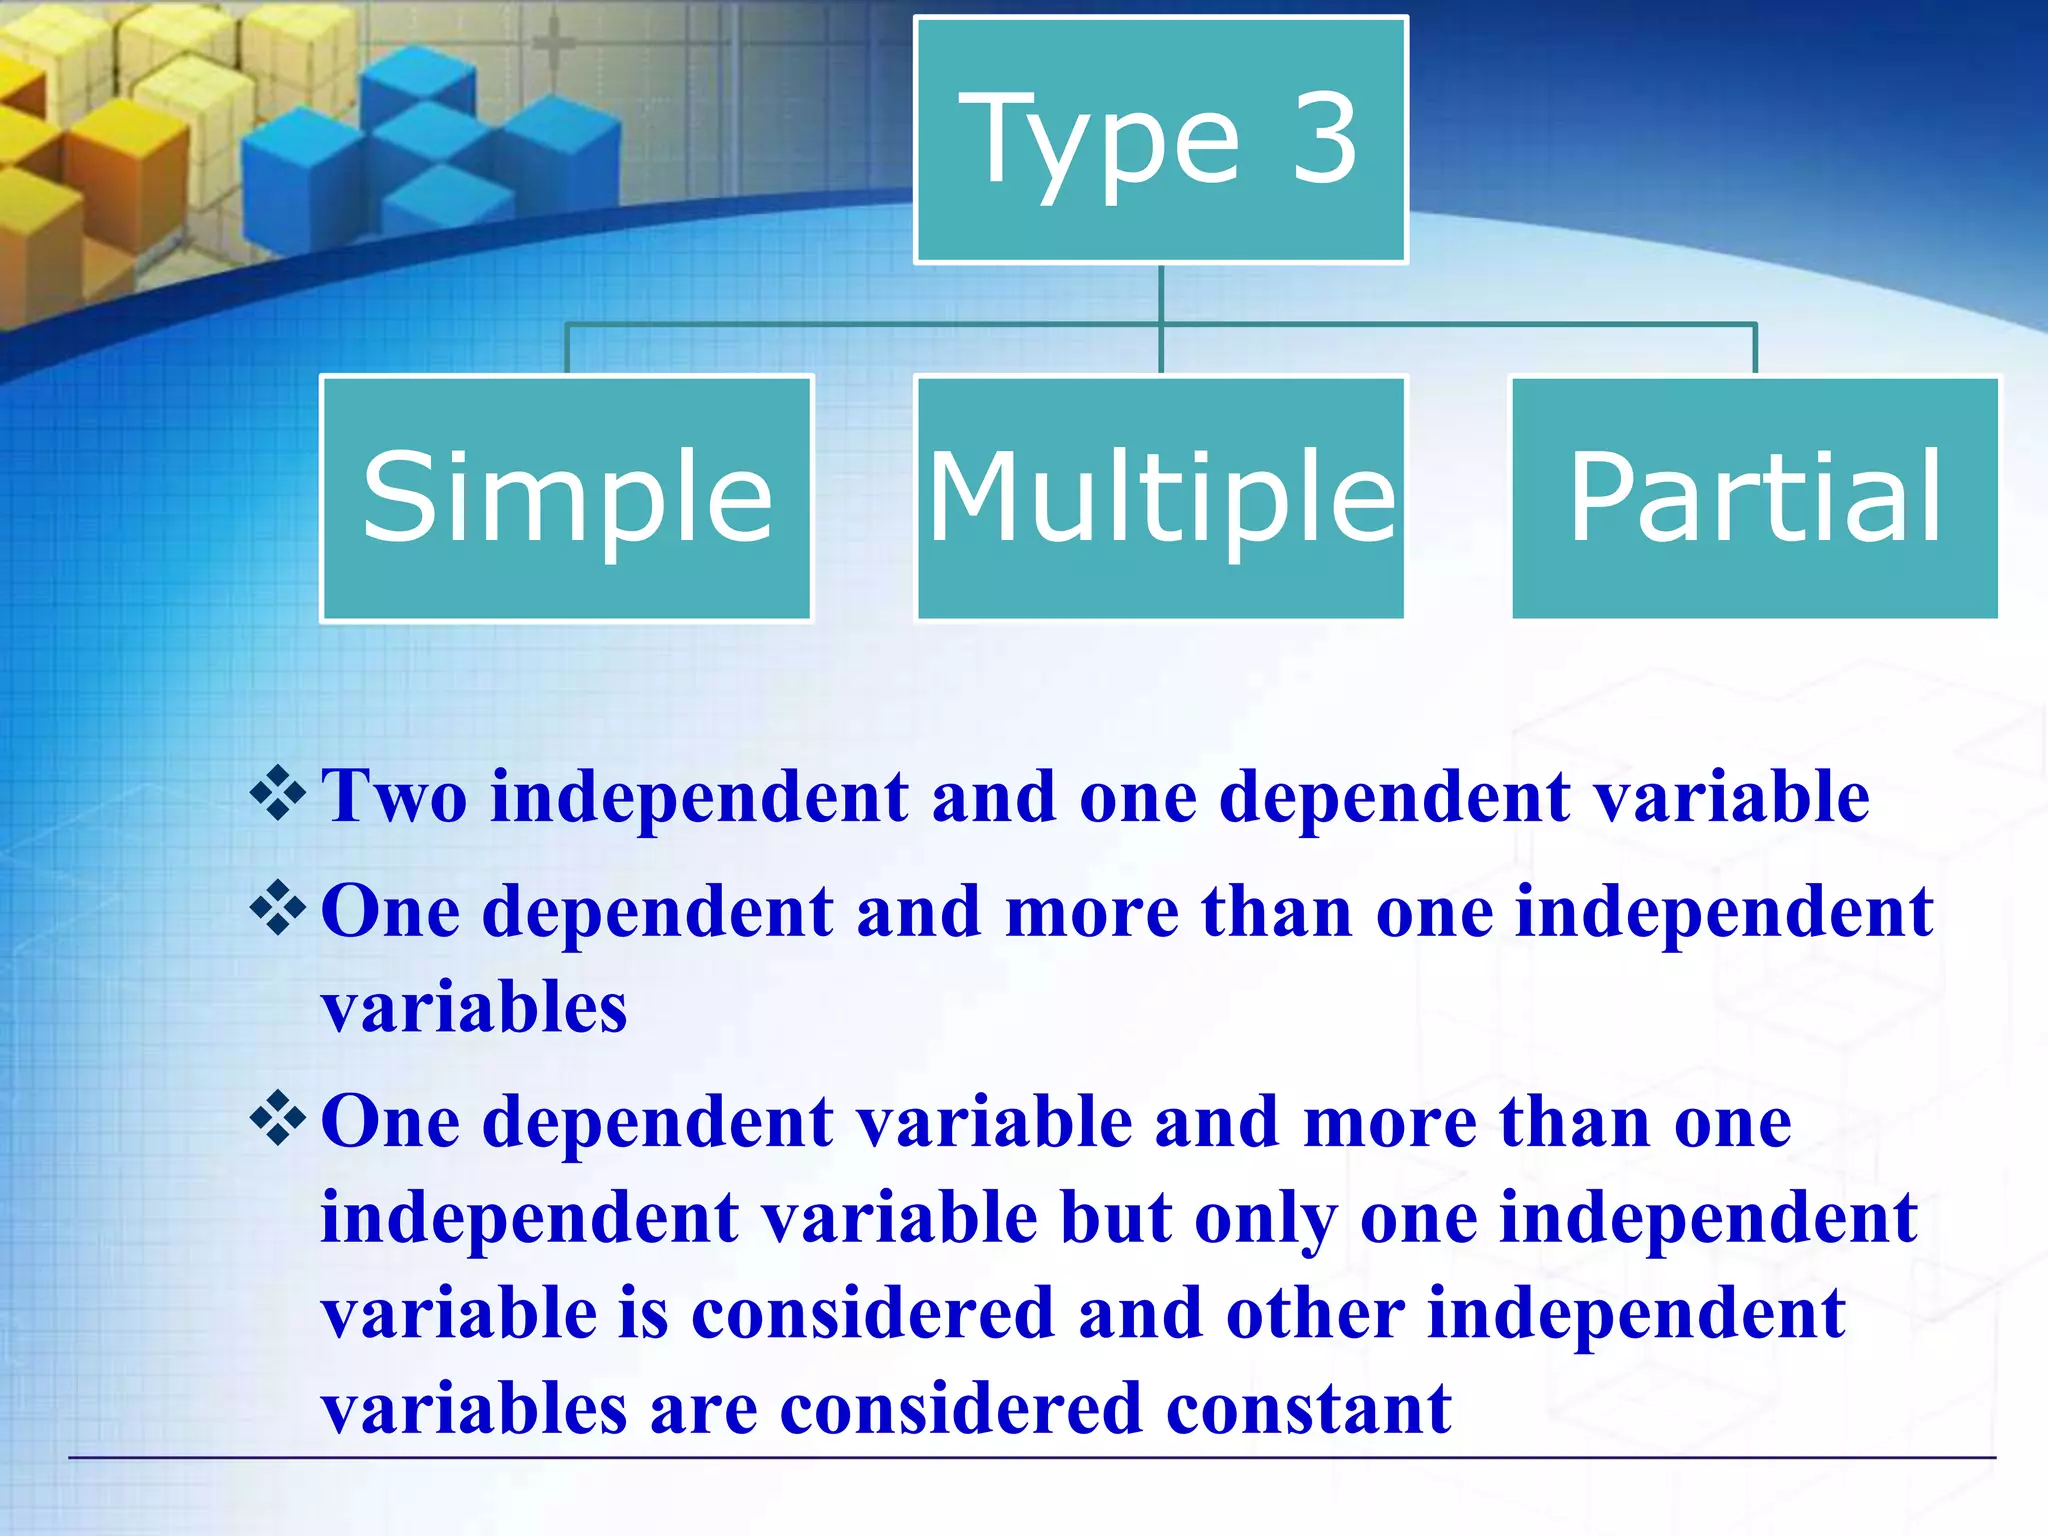
3) Simple vs multiple vs partial correlation based on the number of variables.
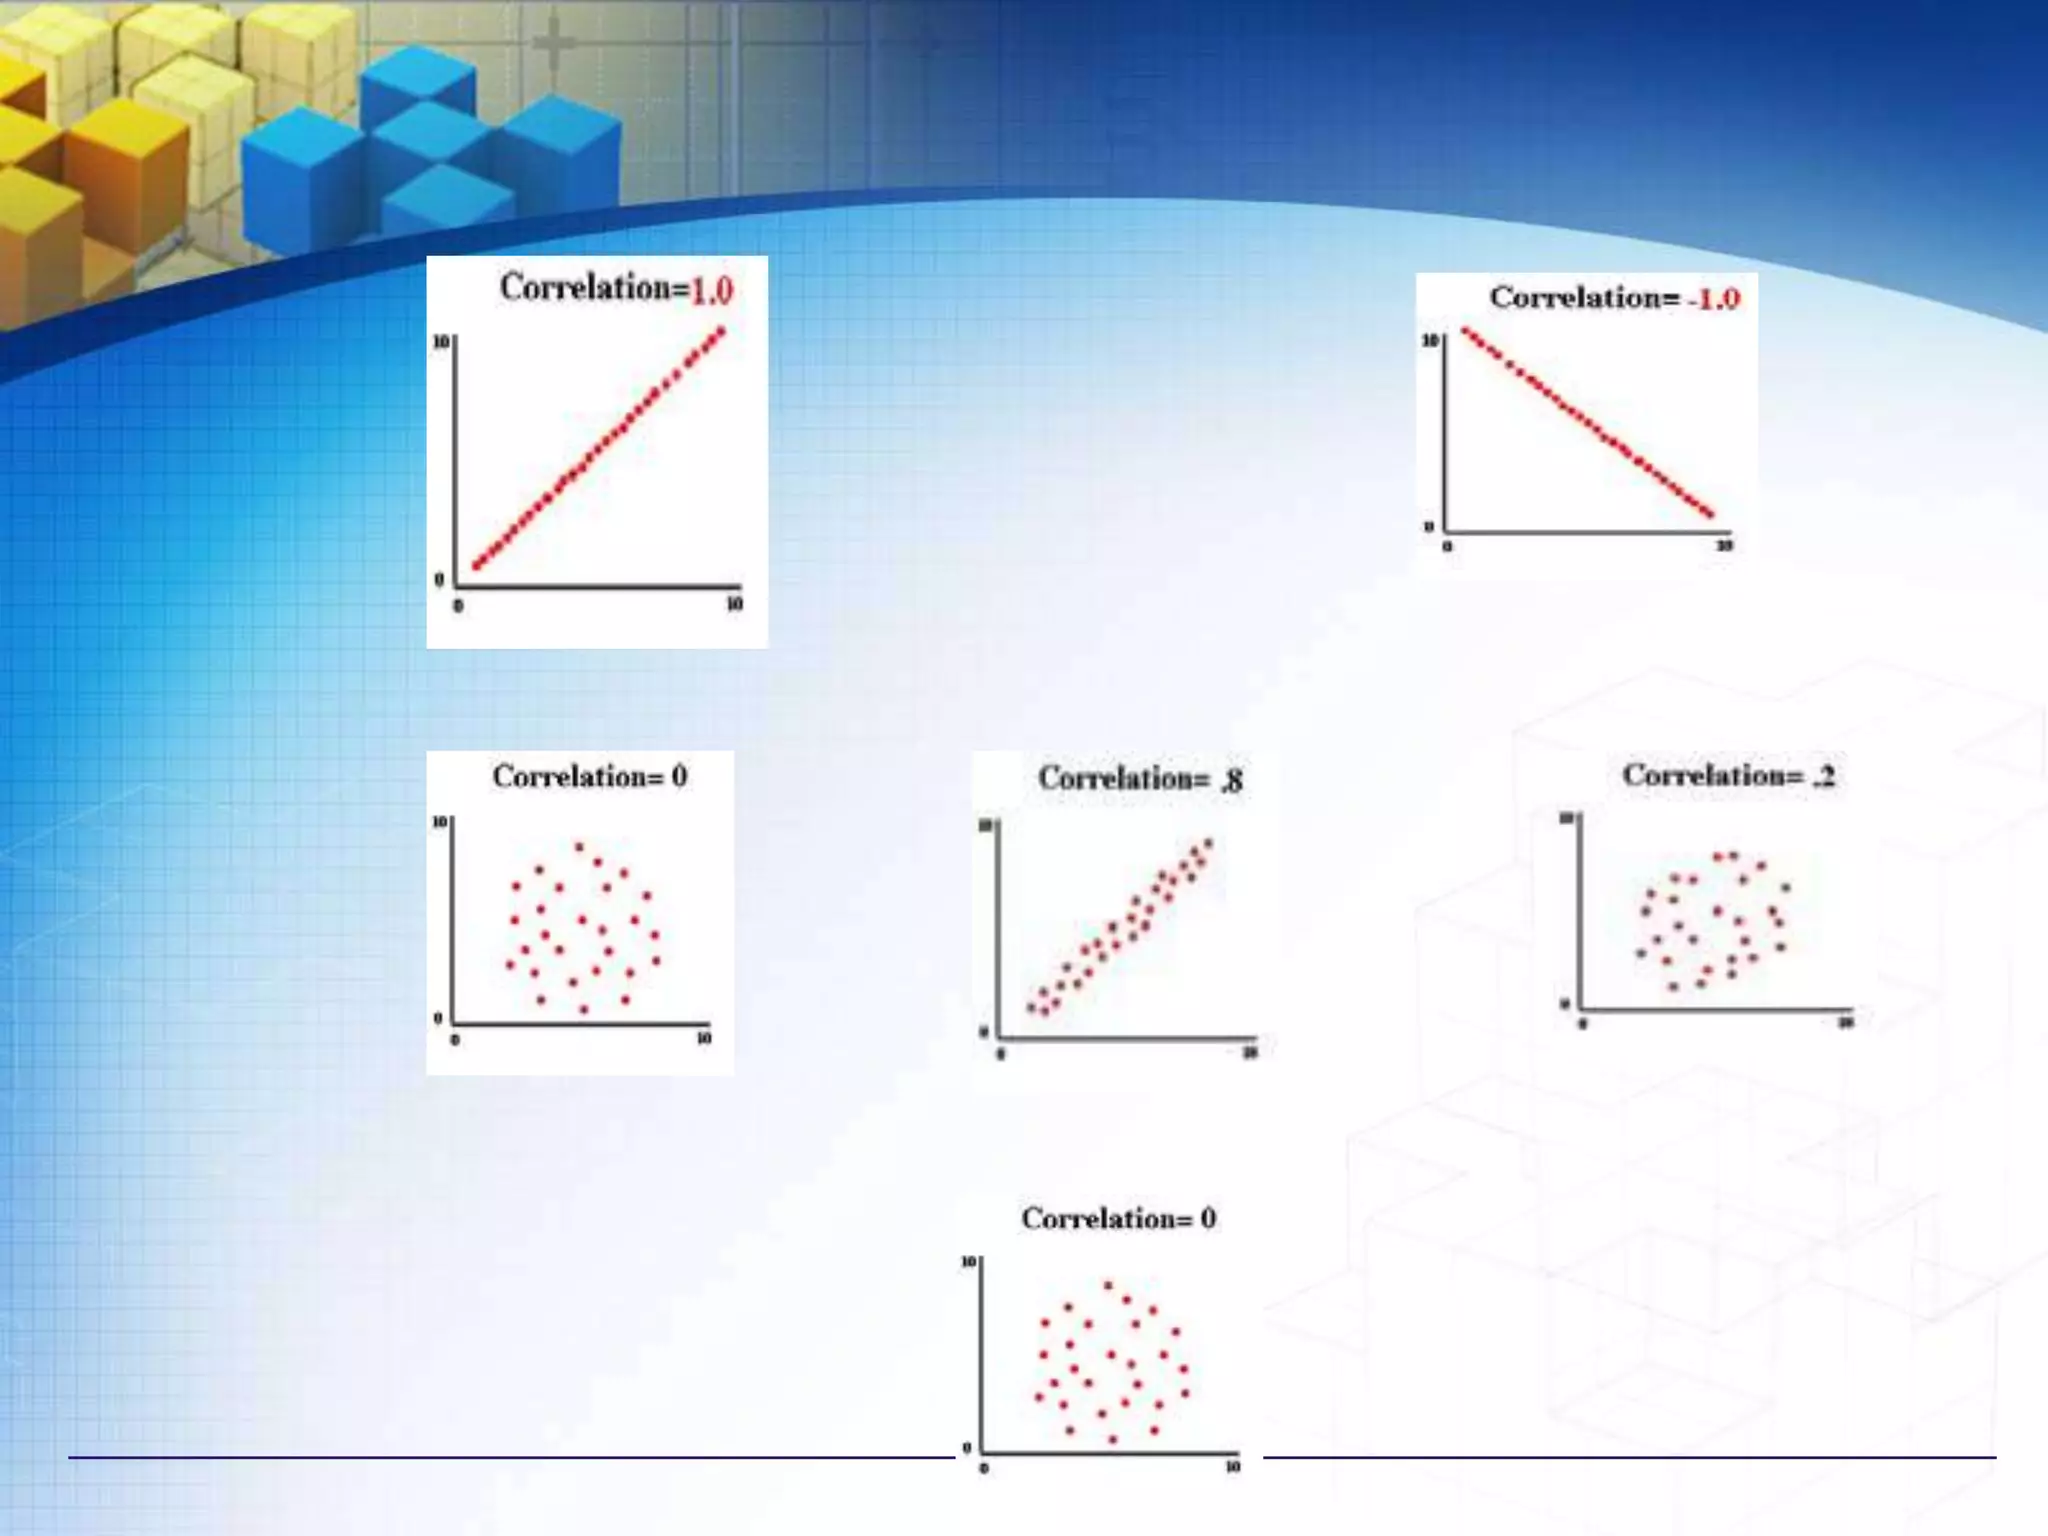
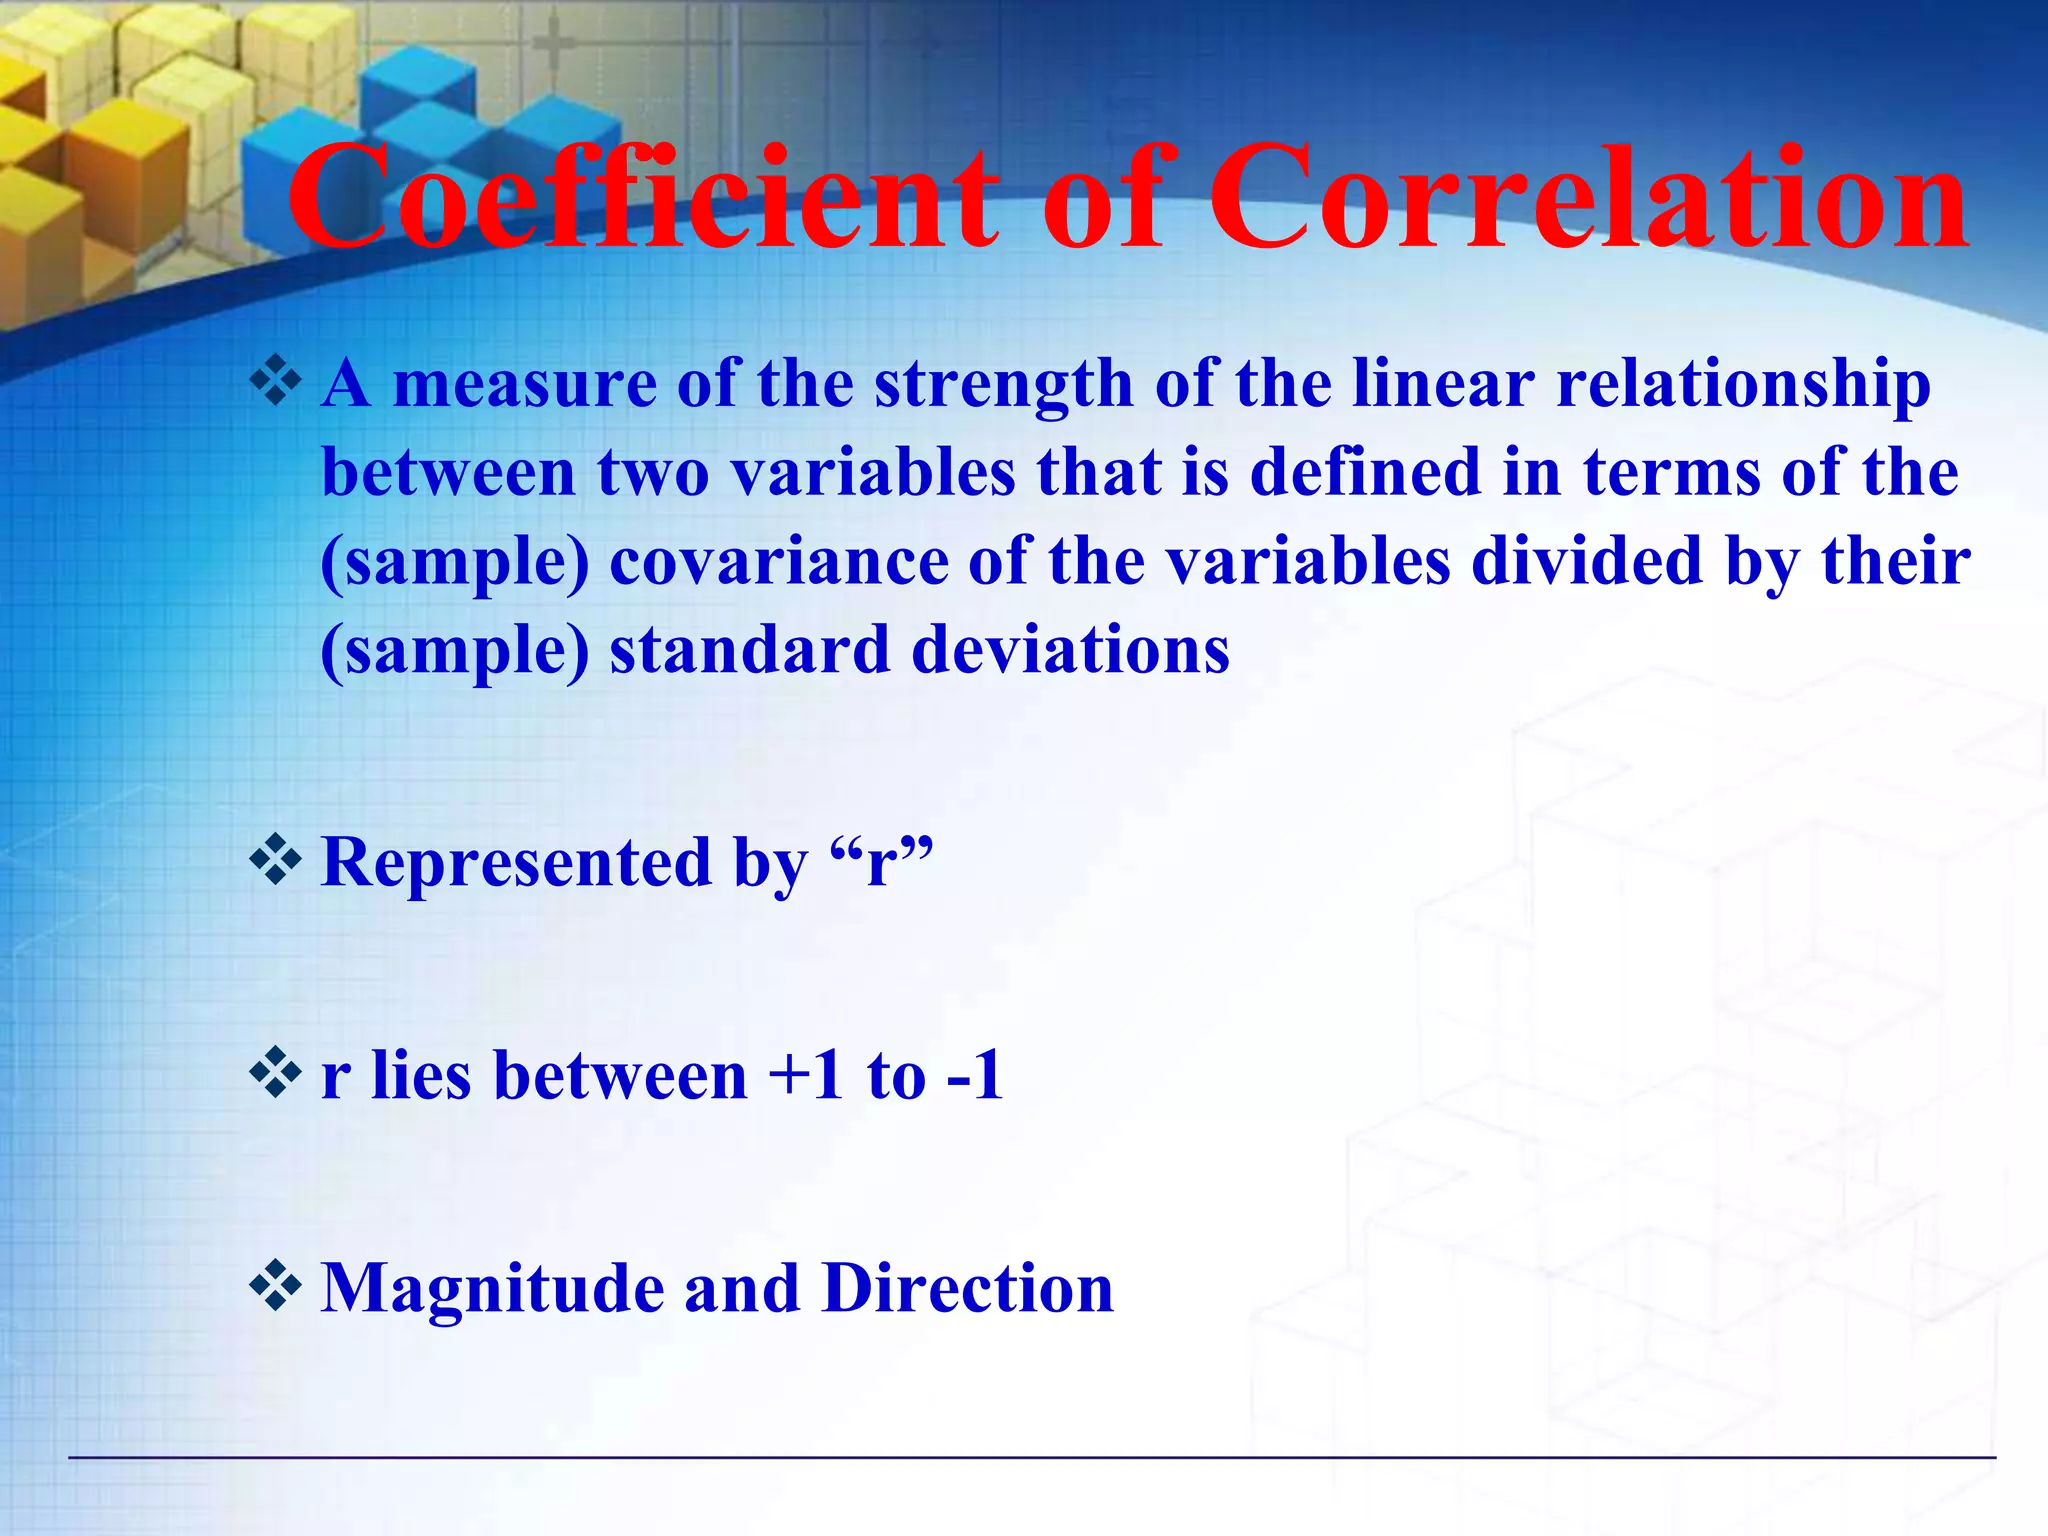
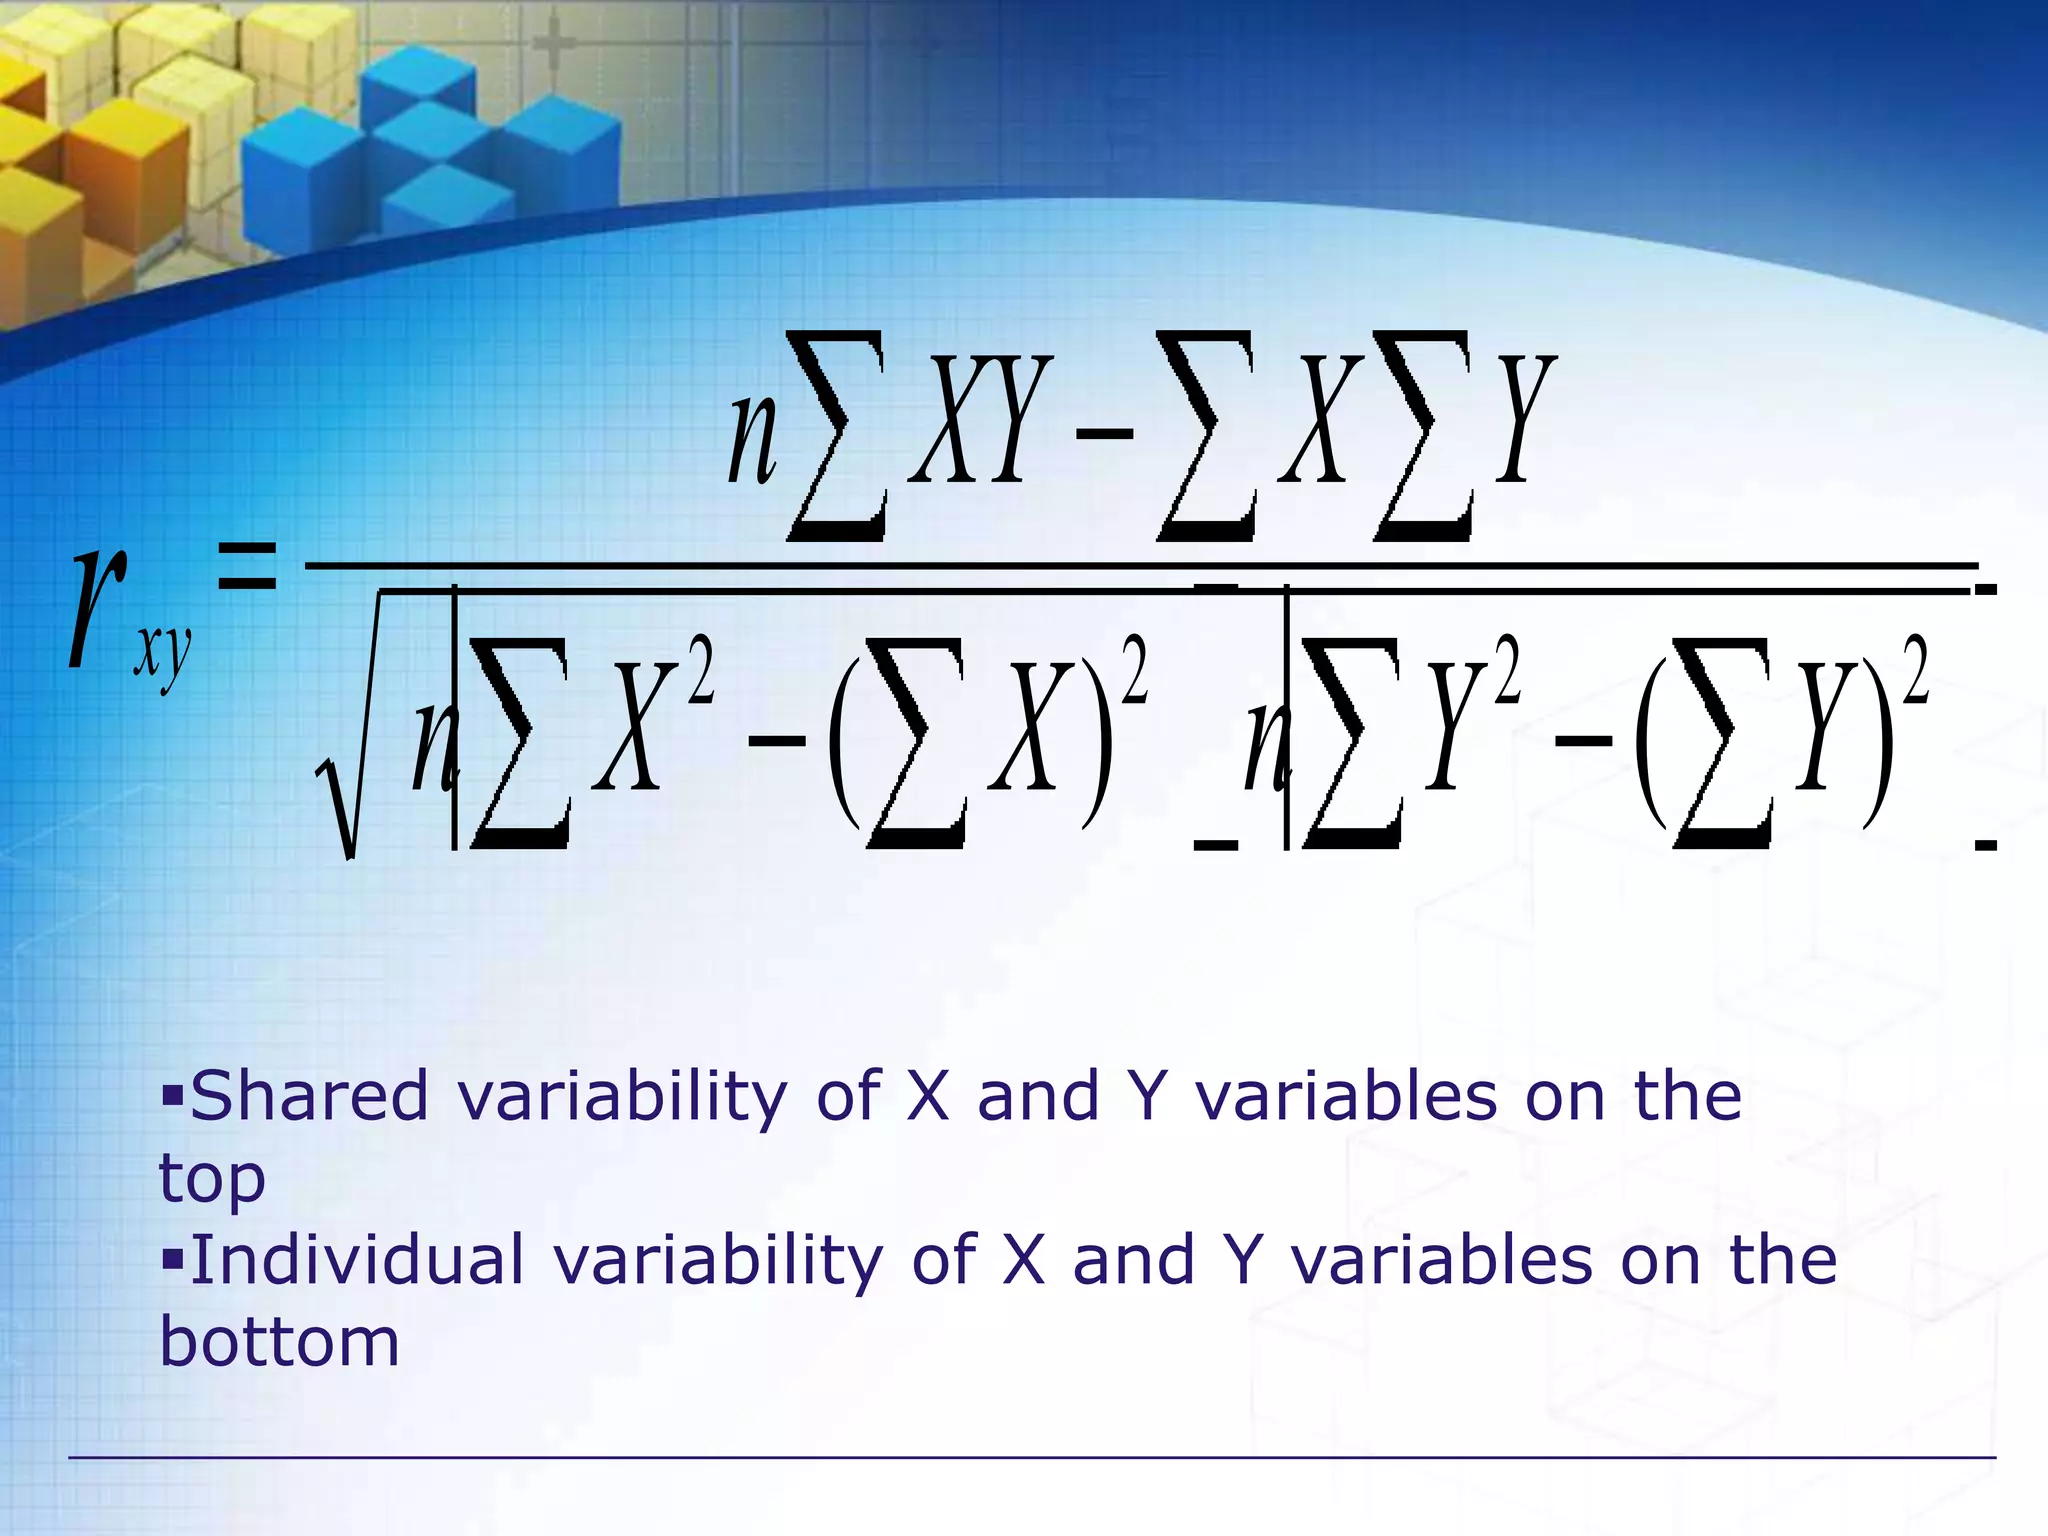
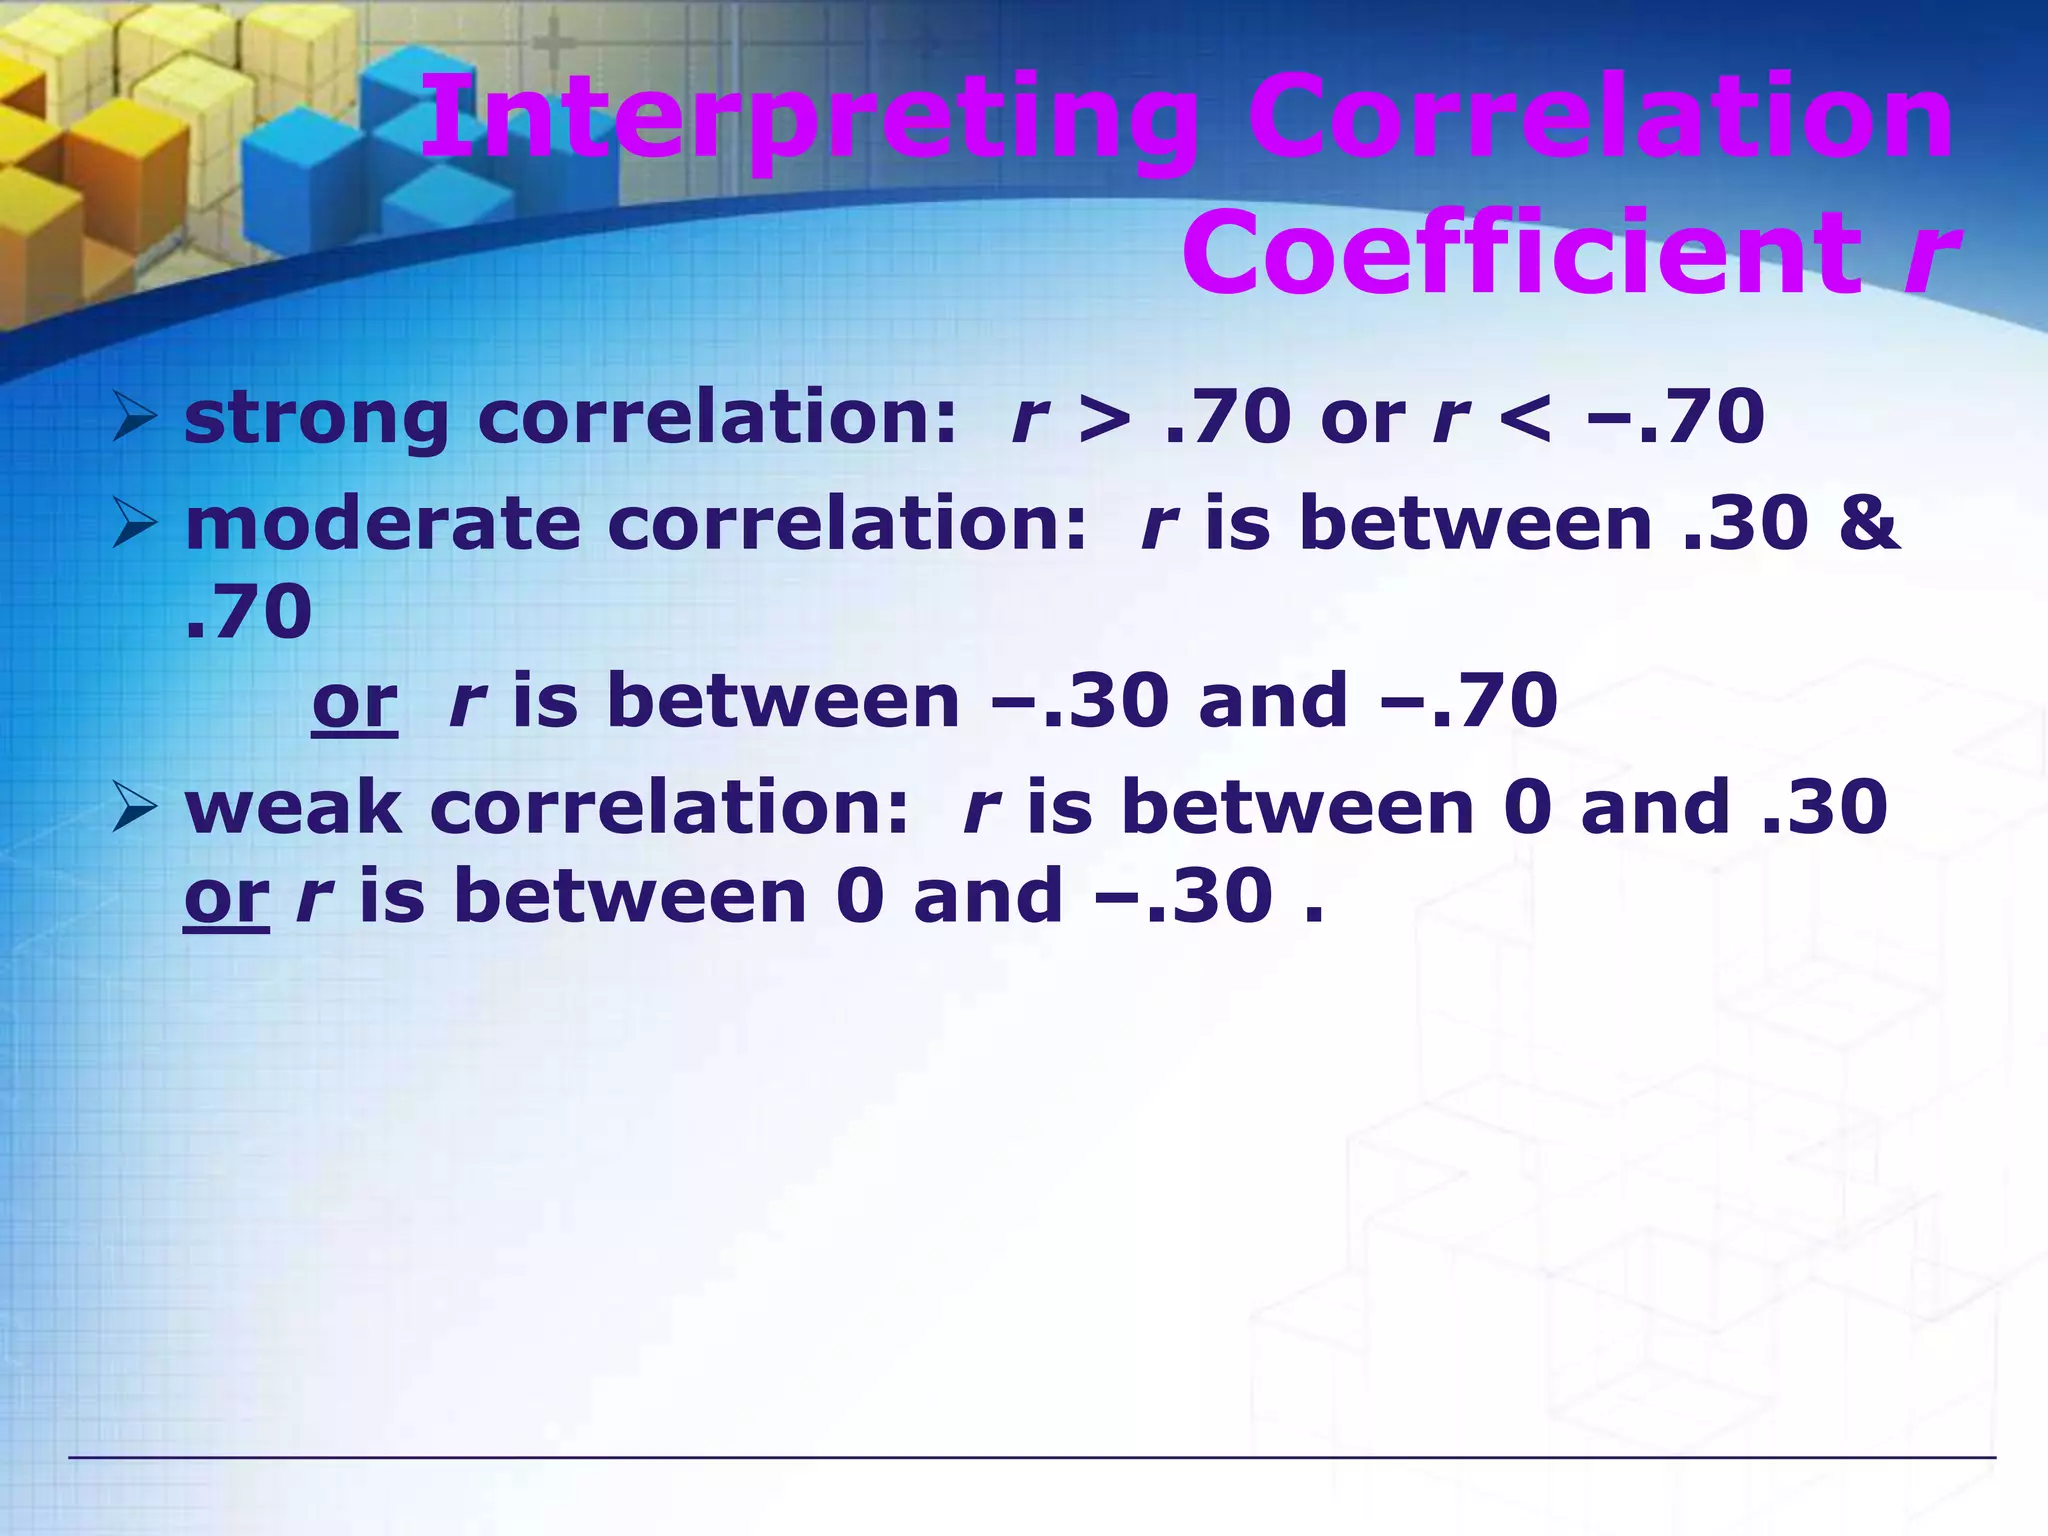
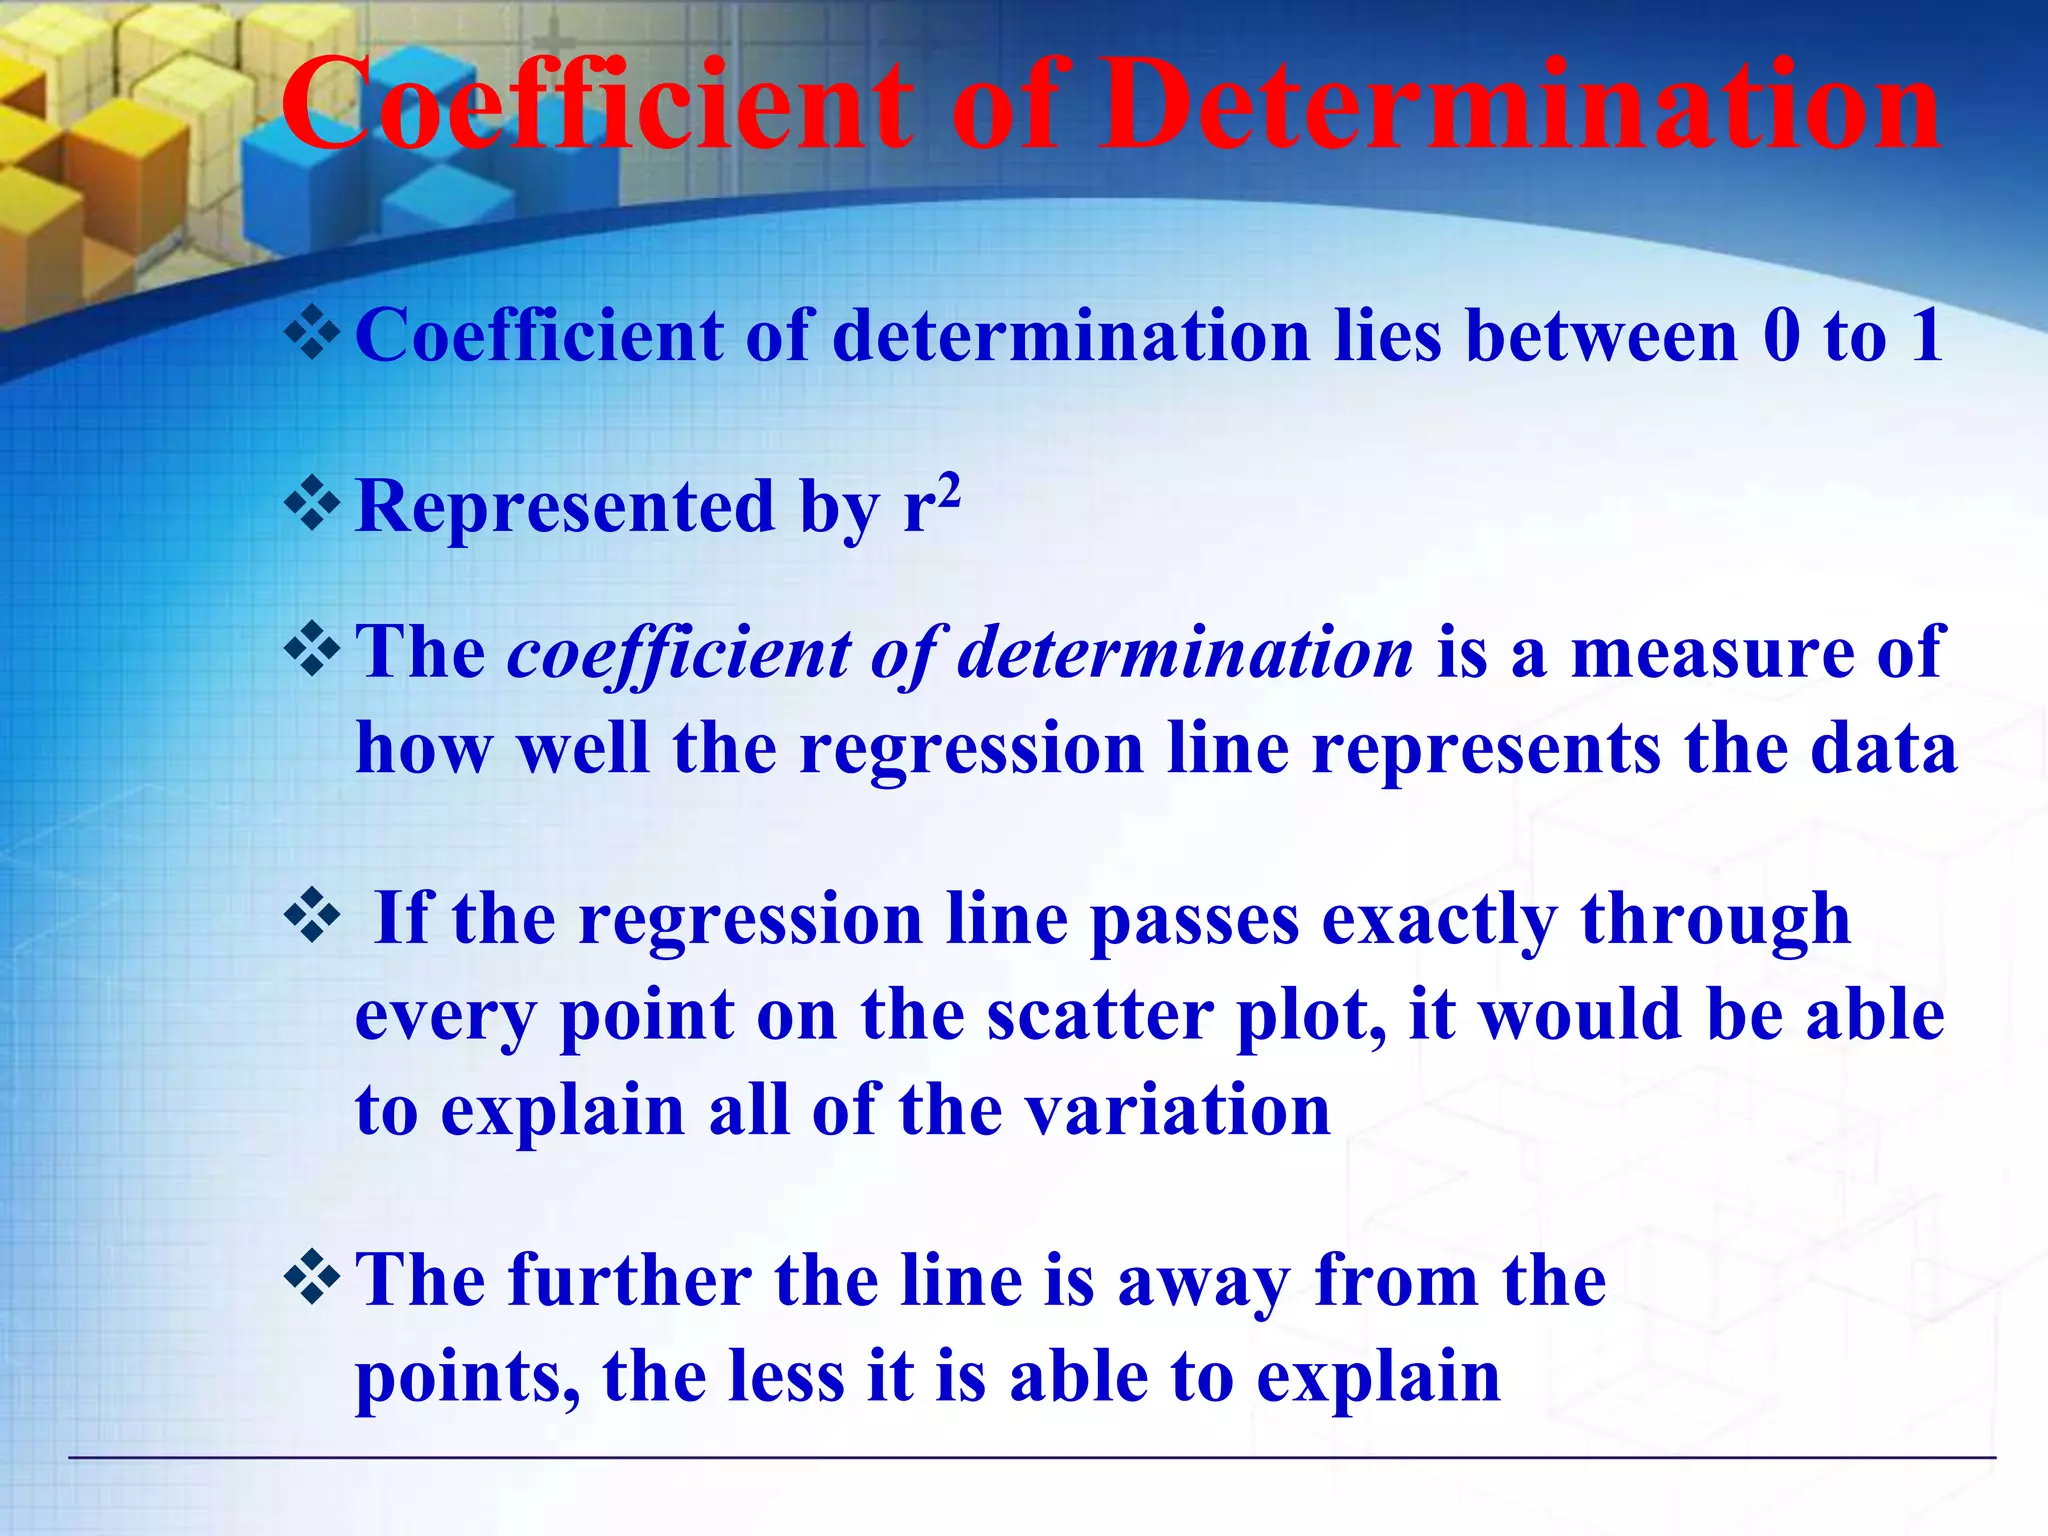
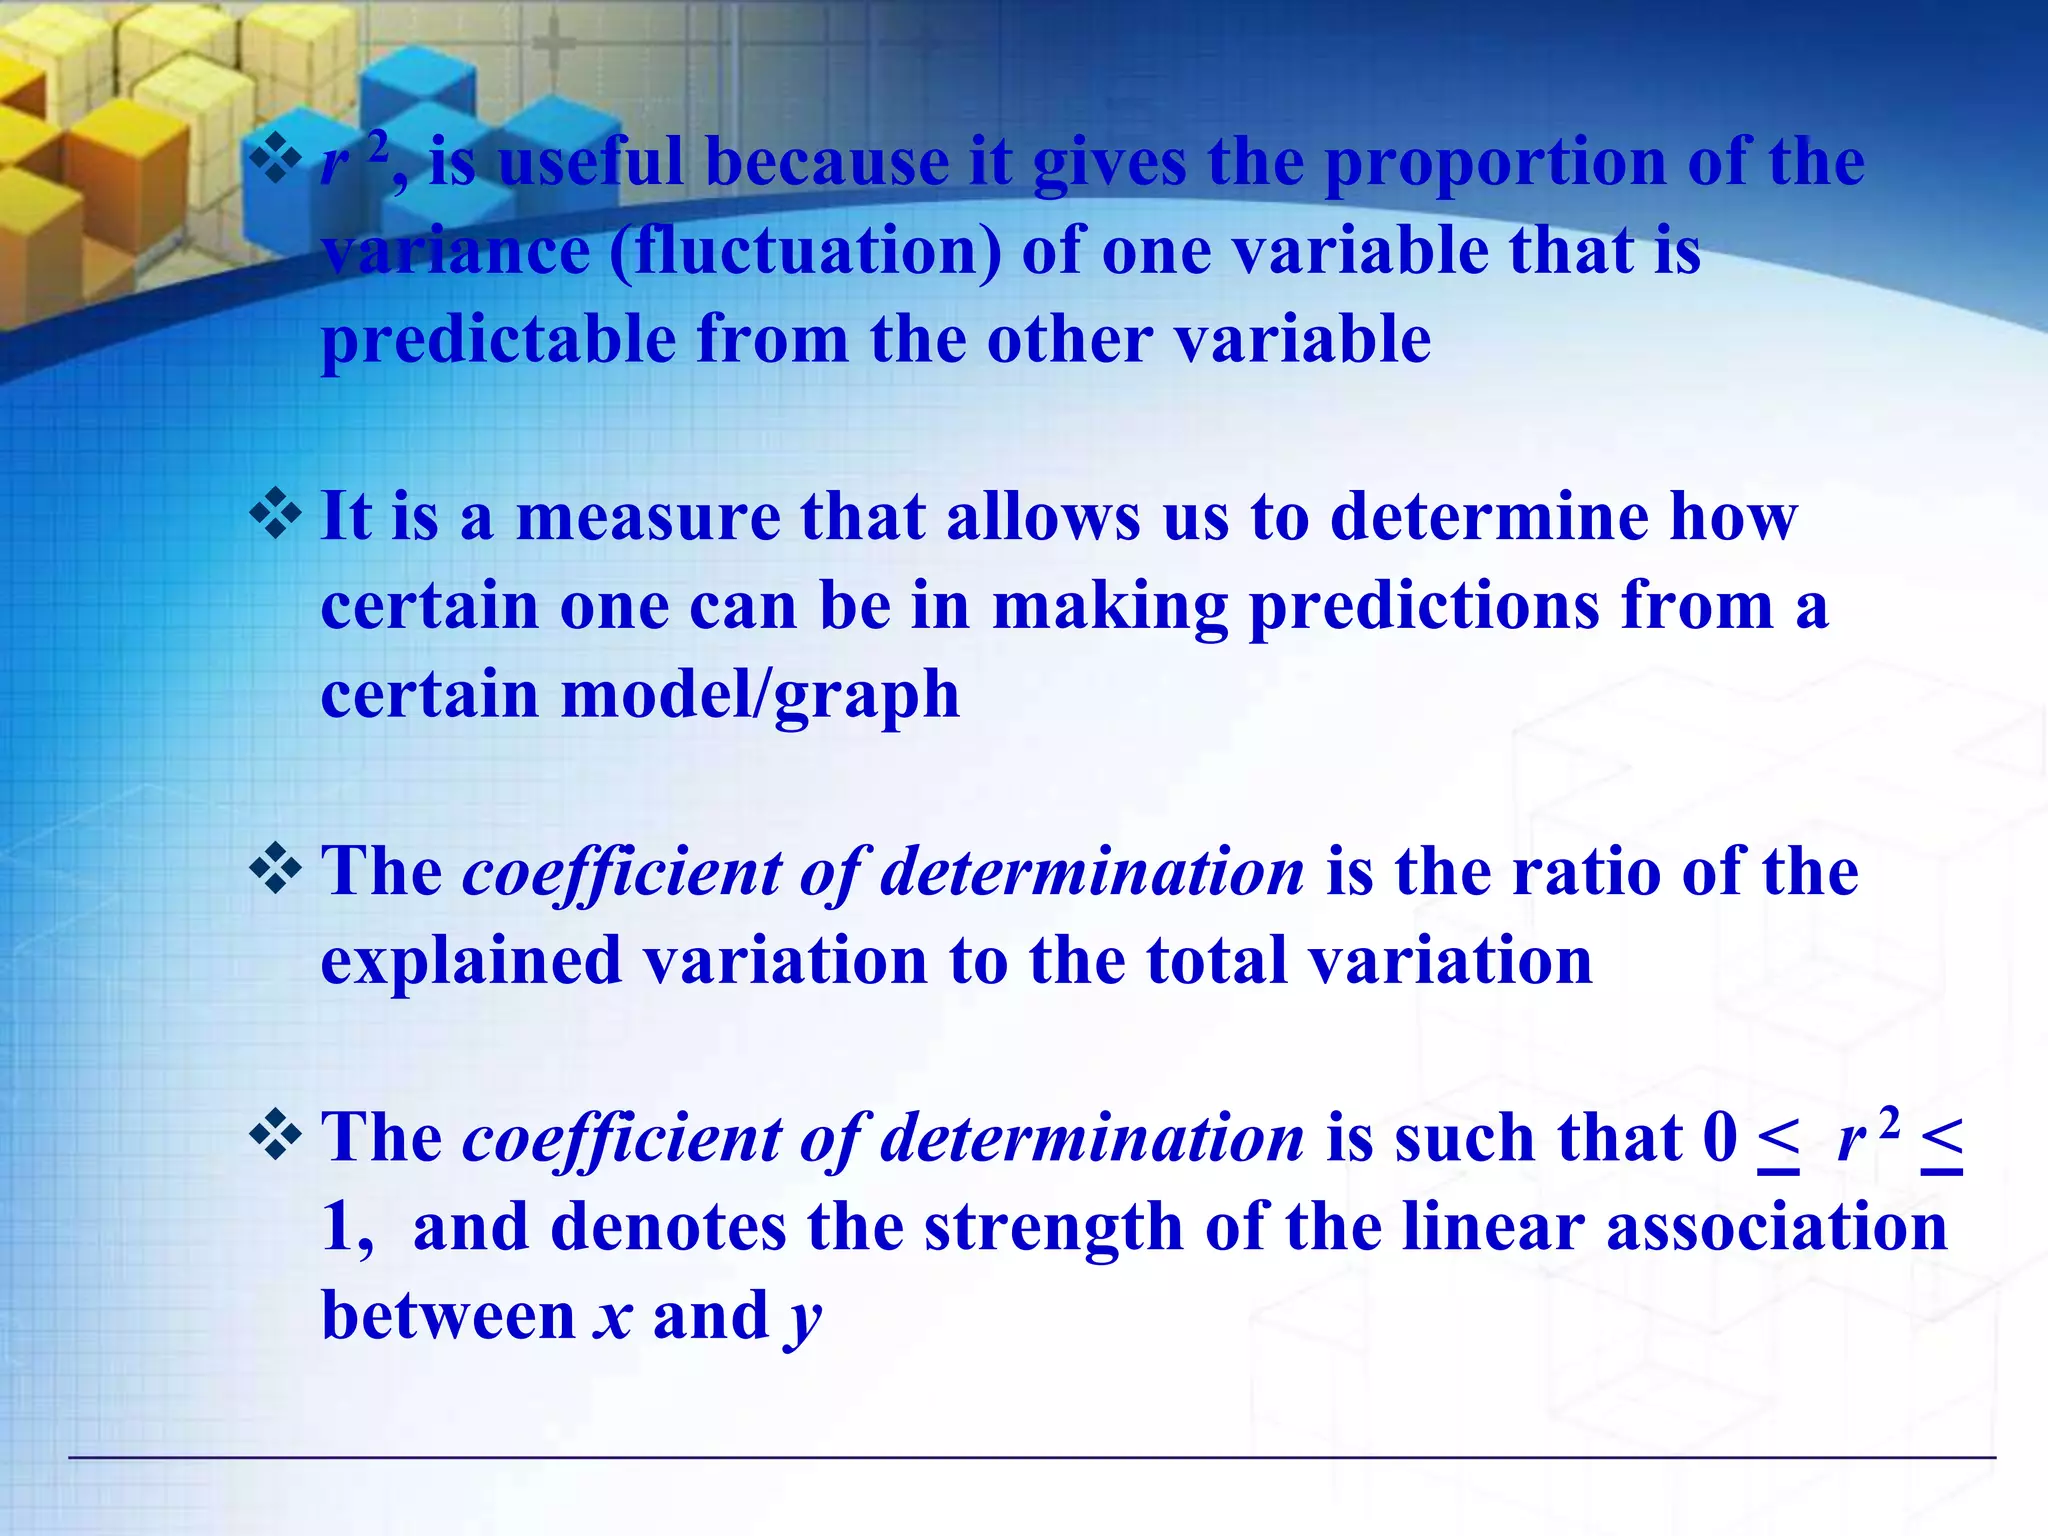
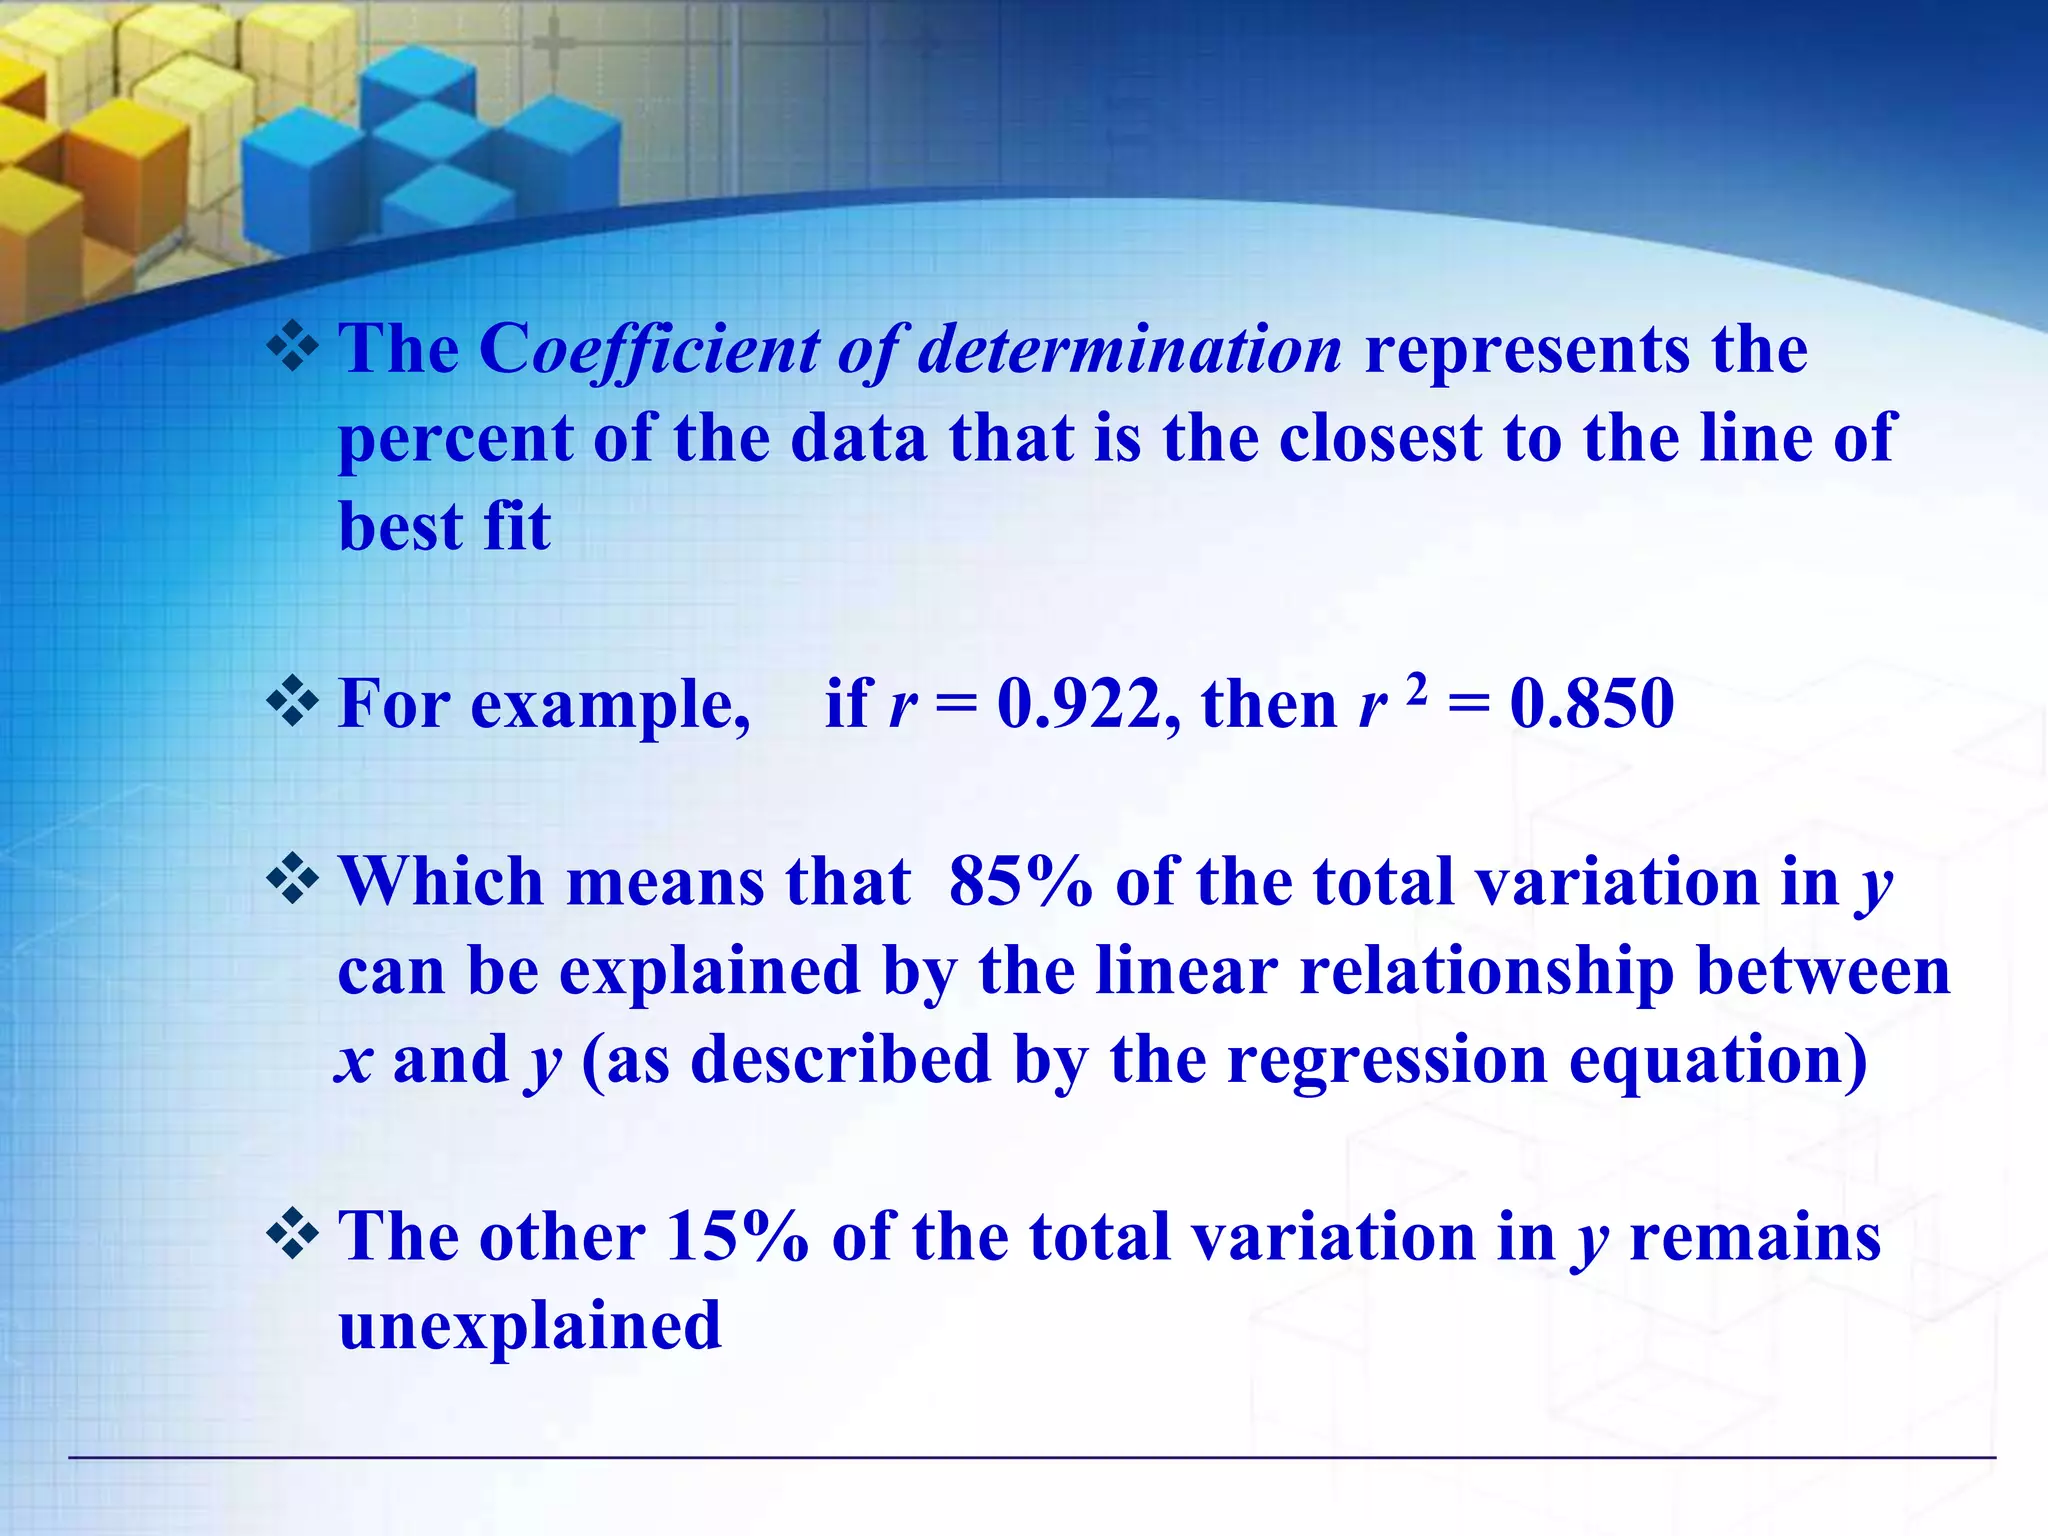
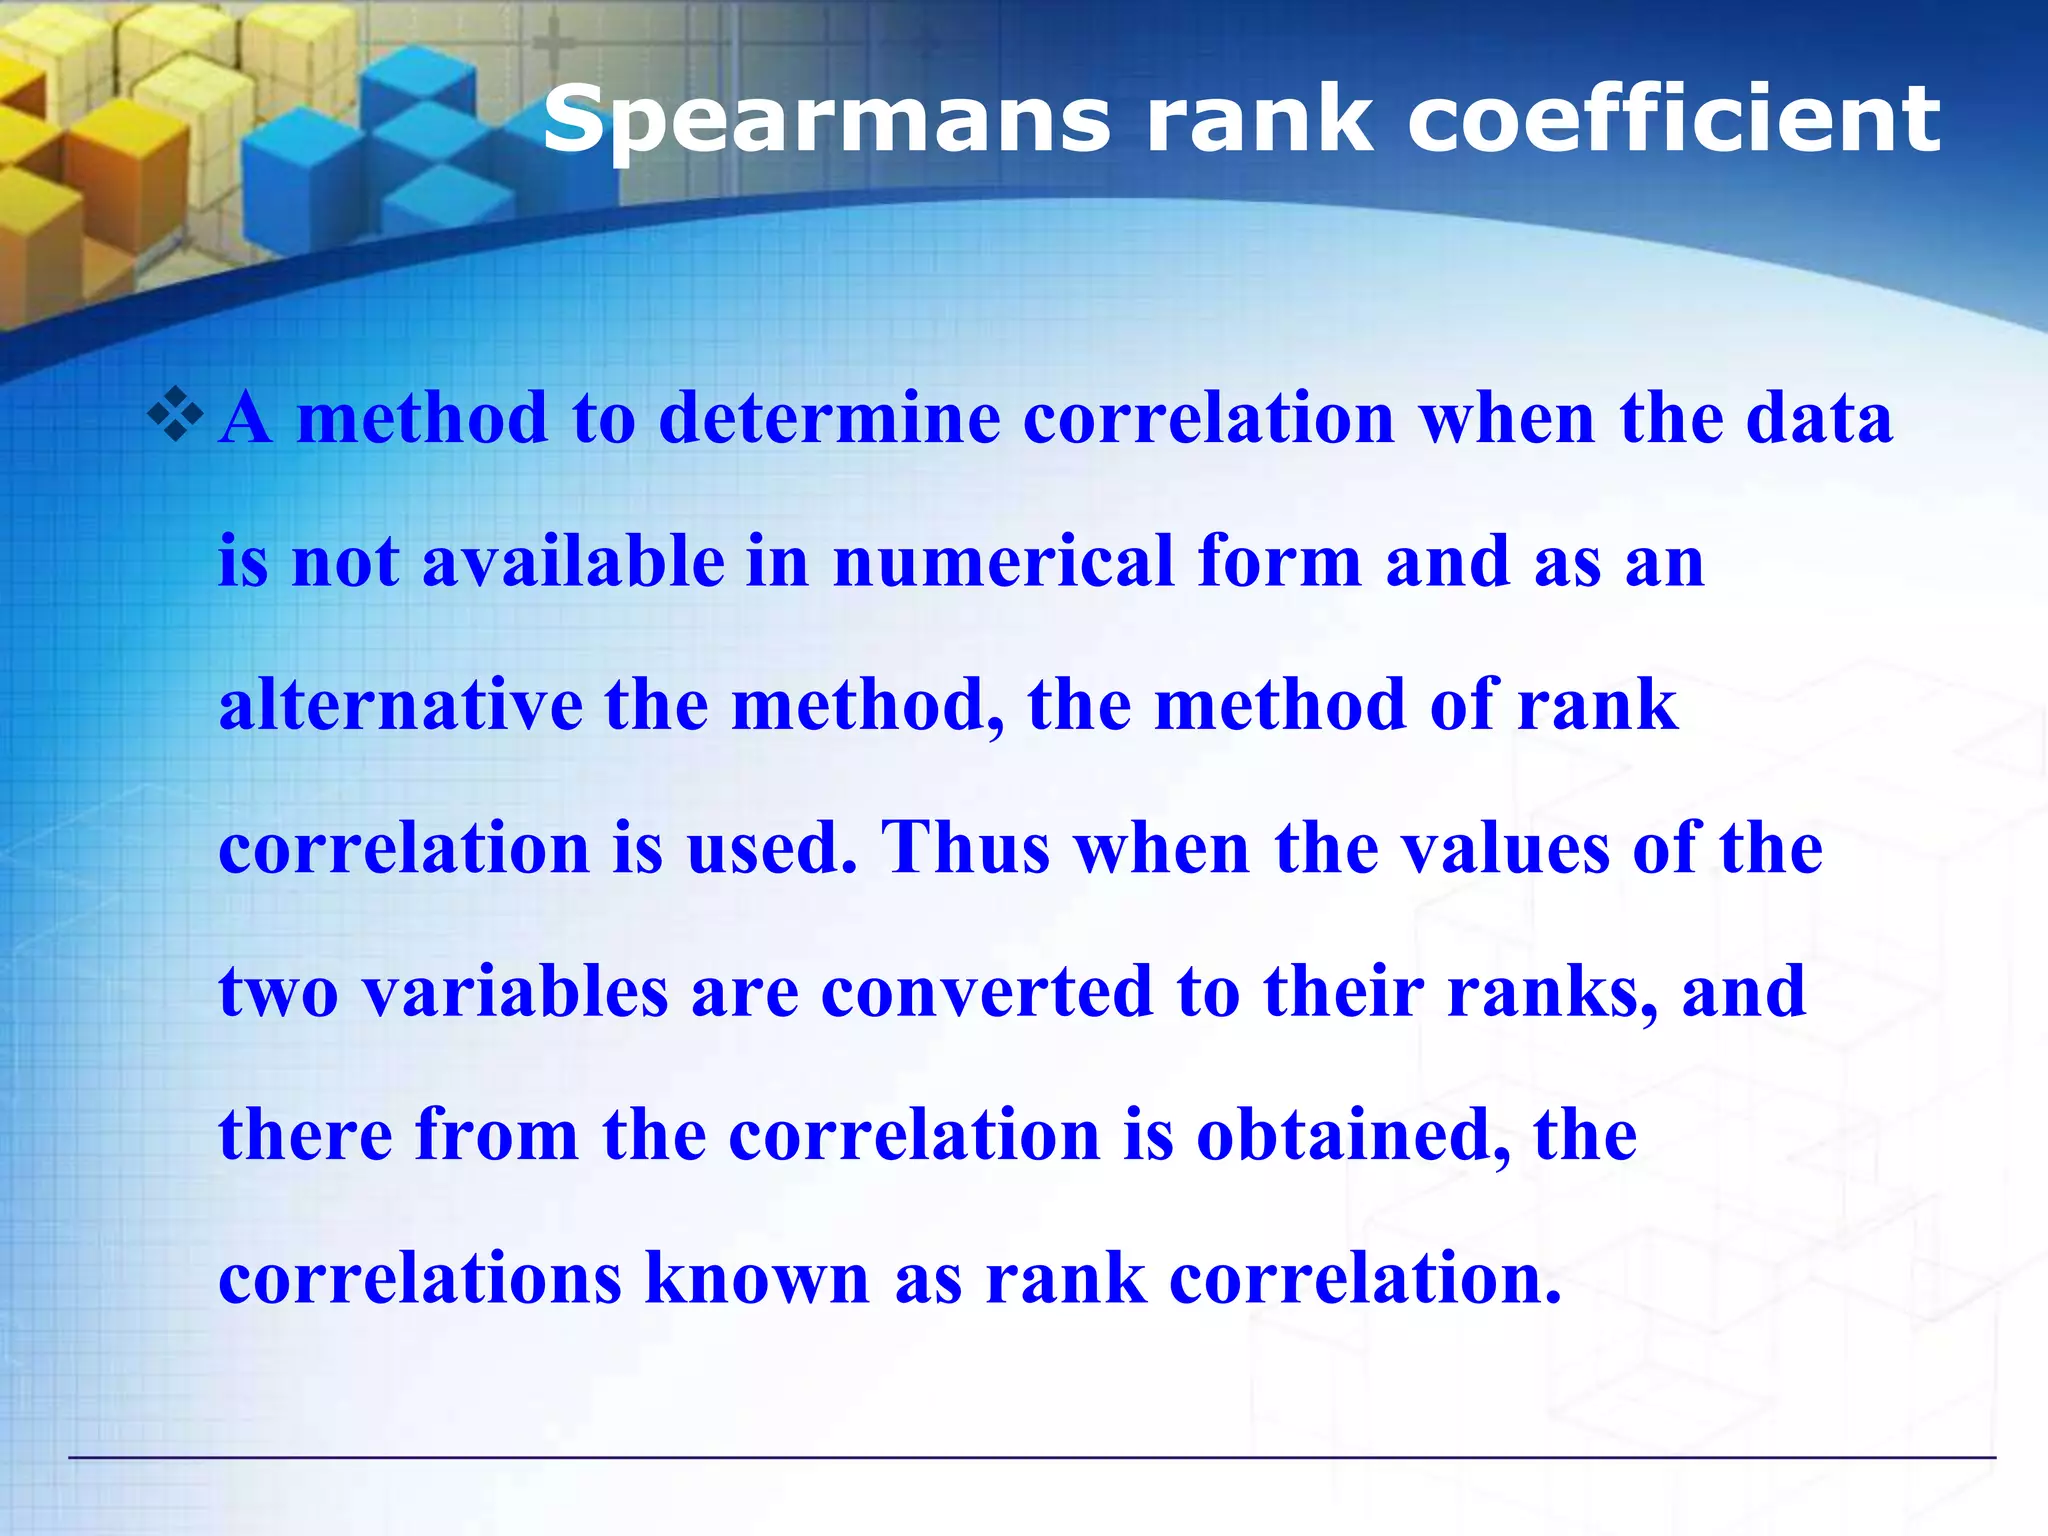
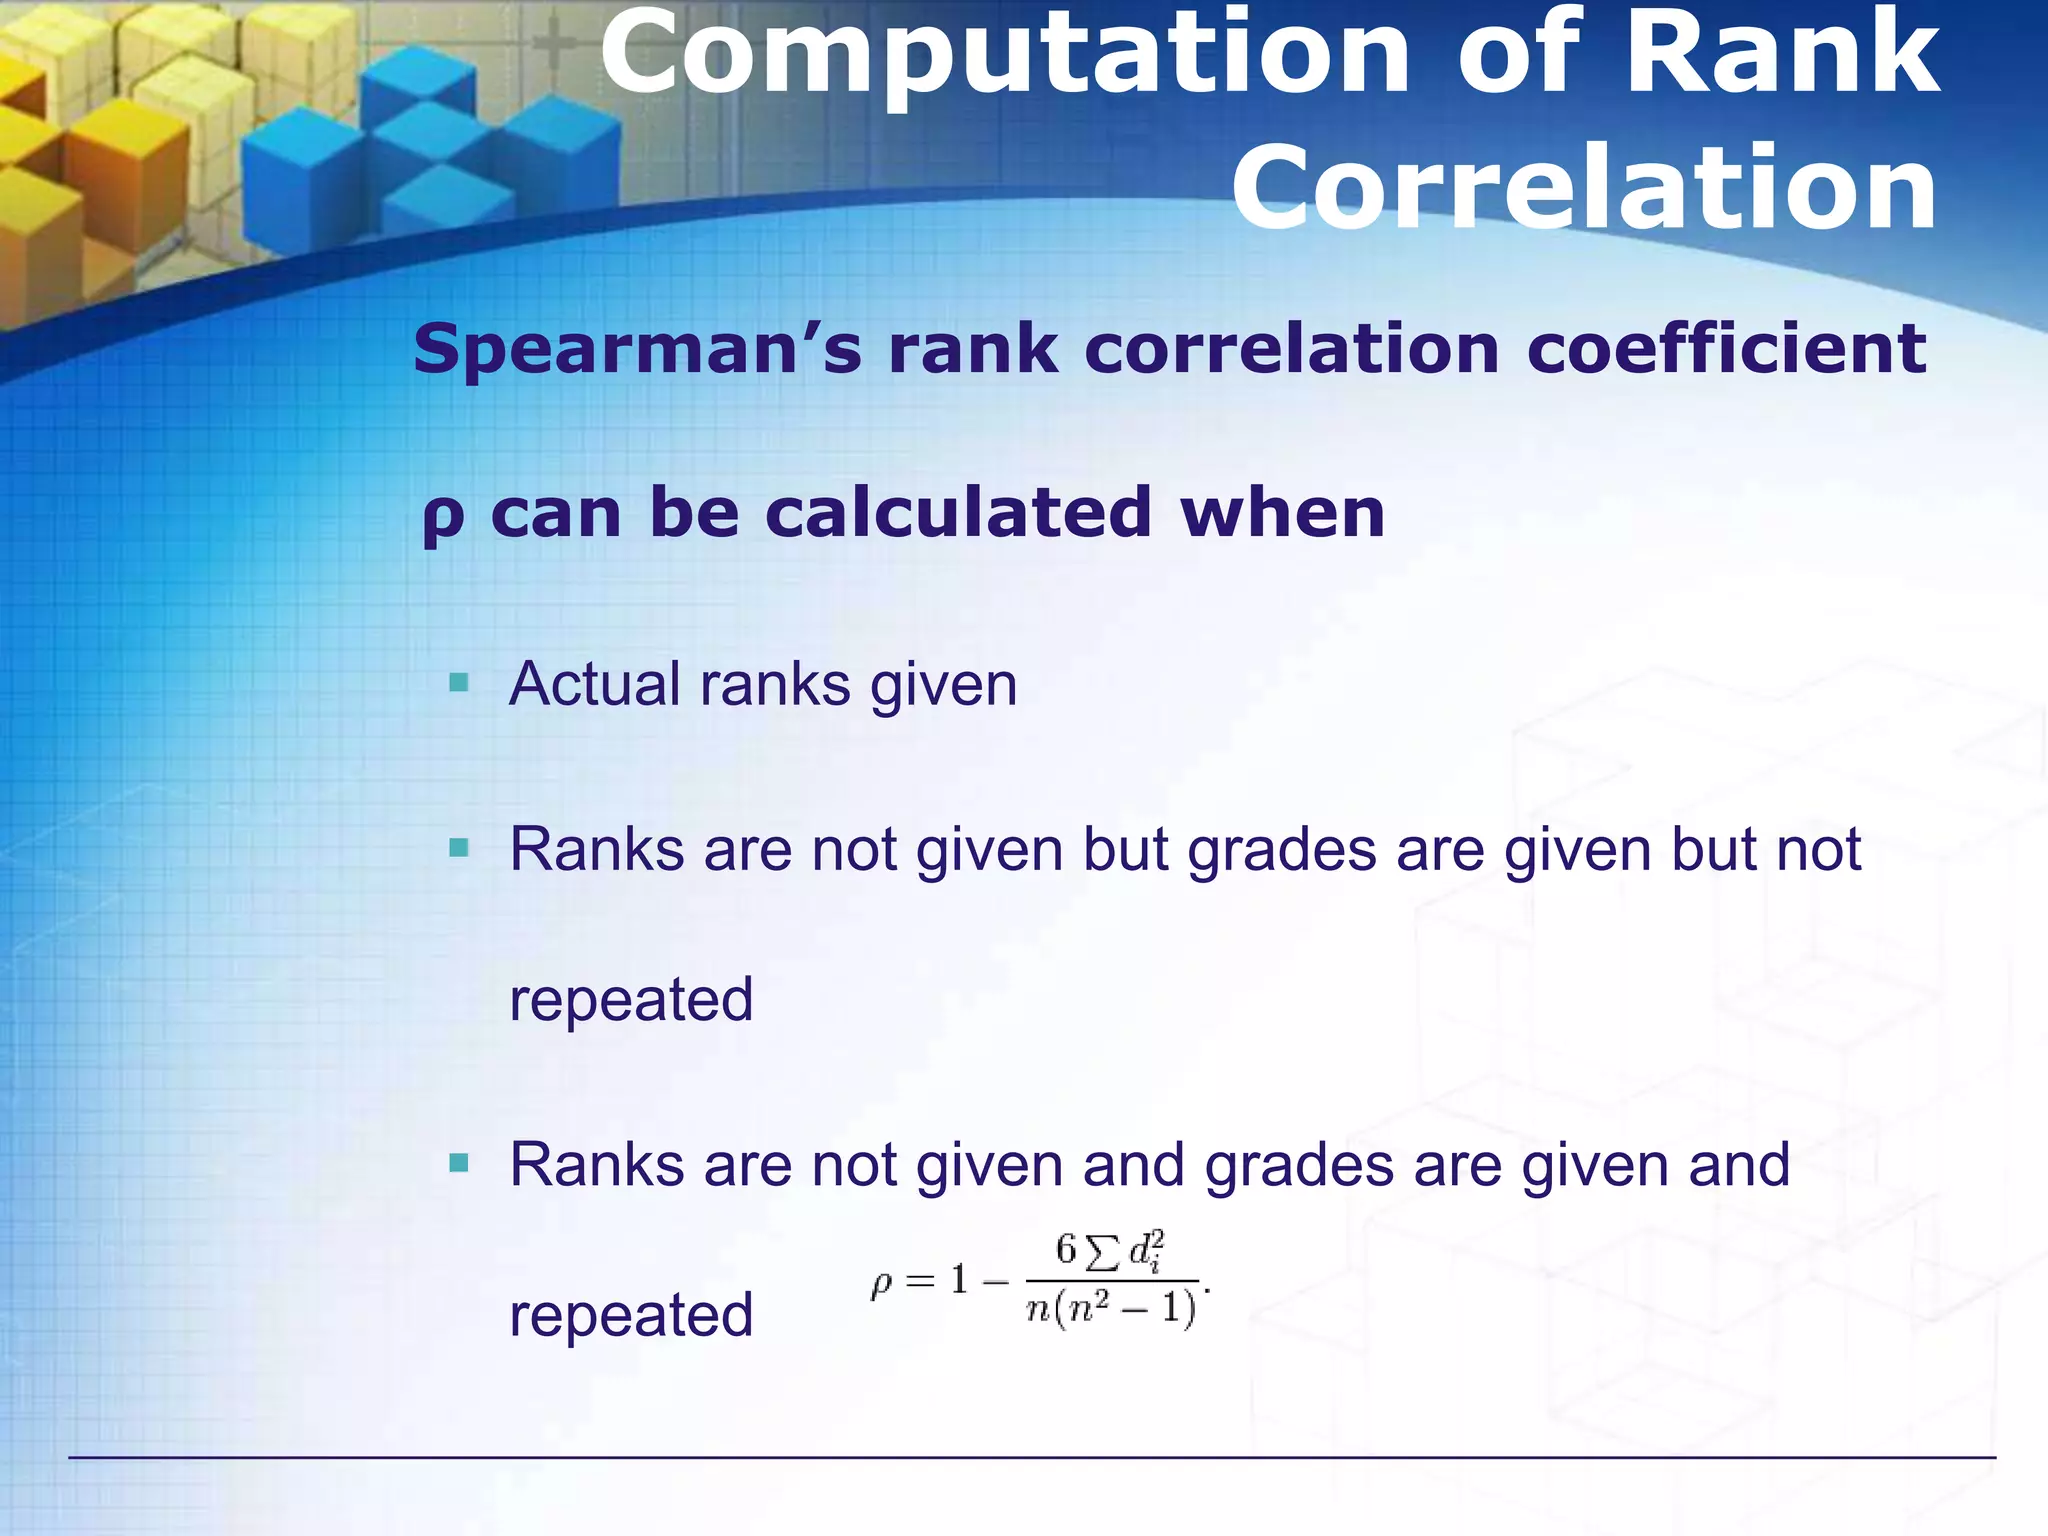
The document also discusses methods for studying correlation including scatter plots, Karl Pearson's coefficient of correlation r, and Spearman's rank correlation coefficient. It provides interpretations of the correlation coefficient r and coefficient of determination r2.