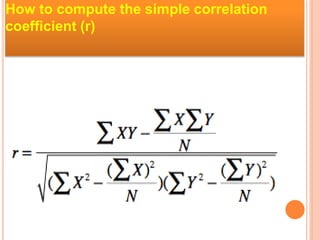
Presented by
Name:-
SAAD SAIF
Roll No:-
FA17-BSCS-359
Submitted To:-
Sir Arshad Hameed
Subject:-
Probability & Statistics
Welcome To
Probability & Statistics
TOPIC
Contents
Definition
Types Of Correlation
Simple Correlation Coefficient
Applications
Introduction
The End
Introduction
Correlation analysis show us how to determine both the
nature and strength of relationship between two
variables.
The word Correlation is made of Co- (meaning
"together"), and Relation
One of the best statistical tests out there, in my opinion, is
the correlation. Correlation is a mutual relationship
between two variables.
DEFINITION
A correlation is a linear relationship between
two variables. Correlation measures the linear
association between two variables.
Types of correlation
On the basis of
degree of
correlation
On the basis of
number of variables
On the basis of
linearity
•Positive
correlation
•Negative
correlation
•Simple
correlation
•Partial correlation
•Multiple
correlation
•Linear
correlation
•Non–linear
correlation
x
y
It is a
relationship
between two
variables where
if one variable
increases, the
other one also
increases. A
positive
correlation also
exists in one
decreases and
the other also
decreases.
POSITIVE CORRELATION
That means
there Is an
inverse
relationship
between two
variables.When
one variable
decreases,The
other increases
x
y
Negative Correlation
Simple Correlation coefficient (r)
1. It is also called Pearson's correlation or product moment correlation
coefficient.
2. It measures the nature and strength between two variables of
the quantitative type.
.The sign of r denotes the nature of association
.While the value of r denotes the strength of
association.
If the sign is +ve this means the relation is direct (an increase
in one variable is associate with an increase in the other
variable and a decrease in one variable is associated with a
decrease in the other variable).
While if the sign is -ve this means an inverse or indirect
relationship (which means an increase in one variable is
associated with a decrease in the other).
If r = Zero this means no association or correlation between
the two variables.
If 0 < r < 0.25 = weak correlation.
If 0.25 ≤ r < 0.75 = intermediate correlation.
If 0.75 ≤ r < 1 = strong correlation.
If r = l = perfect correlation.
How to compute the simple correlation
coefficient (r)
Example
A sample of 6 children was selected, data about their age in years and
weight in kilograms was recorded as shown in the following table . It is
required to find the correlation between age and weight.
Serial No Age(Years) Weight(Kg)
1 7 12
2 6 8
3 8 12
4 5 10
5 6 11
6 9 13
These 2 variables are of the quantitative type, one variable (Age) is
called the independent and denoted as (X) variable and the other
(weight) is called the dependent and denoted as (Y) variables to find
the relation between age and weight compute the simple correlation
coefficient using the following formula:
Serial No Age(Years)
(X)
Weight(Kg)
(Y)
XY X2 Y2
1 7 12 84 49 144
2 6 8 48 36 64
3 8 12 96 64 144
4 5 10 50 25 100
5 6 11 66 36 121
6 9 13 117 81 169
Total ∑x=41 ∑y=66 ∑xy= 461 ∑x2=291 ∑y2=742
r = 0.759
Strong direct correlation
Application
1.As the number of trees cut down increases, the probability
of erosion increases.
2.As a student’s study time increases, so does his test
average.
3.As a child grows, so does his clothing size.
4.As her salary increased, so did her spending.
REAL LIFE Application Of Positive Correlation :
Application
•student absences --------- grades
•weather cooling --------air conditioning costs
•train speed -------- length of final point
•chicken age --------amount of eggs producing
REAL LIFE Application Of Negative Correlation:
Application
Temperature
Sales in ˚C
17.2 ˚C
22.6 ˚C
18.1 ˚C
23.4 ˚C
25.1 ˚C
19.4 ˚C
22.1 ˚C
18.5 ˚C
15.2 ˚C
11.9 ˚C
16.4 ˚C
14.2 ˚C
$408
$445
$421
$544
$614
$412
$522
$406
$332
$185
$325
$215
##Temperature --- Sales Income
Application
On a scatter plot, here is the same data:
So, we can
see that
more sales
occur during
warmer
weather
Application
##amount of exercise ---- % body fat
Hours of exercise
Bodyfat
Application
Weather gets so hot--- sales start
Here is the latest graph:
The correlation is now 0: "No Correlation" ... !
The End
Thank You

Correlation Coefficient

  • 1.
    Presented by Name:- SAAD SAIF RollNo:- FA17-BSCS-359 Submitted To:- Sir Arshad Hameed Subject:- Probability & Statistics
  • 2.
  • 3.
  • 5.
    Contents Definition Types Of Correlation SimpleCorrelation Coefficient Applications Introduction The End
  • 6.
    Introduction Correlation analysis showus how to determine both the nature and strength of relationship between two variables. The word Correlation is made of Co- (meaning "together"), and Relation One of the best statistical tests out there, in my opinion, is the correlation. Correlation is a mutual relationship between two variables.
  • 7.
    DEFINITION A correlation isa linear relationship between two variables. Correlation measures the linear association between two variables.
  • 8.
    Types of correlation Onthe basis of degree of correlation On the basis of number of variables On the basis of linearity •Positive correlation •Negative correlation •Simple correlation •Partial correlation •Multiple correlation •Linear correlation •Non–linear correlation
  • 9.
    x y It is a relationship betweentwo variables where if one variable increases, the other one also increases. A positive correlation also exists in one decreases and the other also decreases. POSITIVE CORRELATION
  • 10.
    That means there Isan inverse relationship between two variables.When one variable decreases,The other increases x y Negative Correlation
  • 11.
    Simple Correlation coefficient(r) 1. It is also called Pearson's correlation or product moment correlation coefficient. 2. It measures the nature and strength between two variables of the quantitative type. .The sign of r denotes the nature of association .While the value of r denotes the strength of association.
  • 12.
    If the signis +ve this means the relation is direct (an increase in one variable is associate with an increase in the other variable and a decrease in one variable is associated with a decrease in the other variable). While if the sign is -ve this means an inverse or indirect relationship (which means an increase in one variable is associated with a decrease in the other).
  • 13.
    If r =Zero this means no association or correlation between the two variables. If 0 < r < 0.25 = weak correlation. If 0.25 ≤ r < 0.75 = intermediate correlation. If 0.75 ≤ r < 1 = strong correlation. If r = l = perfect correlation.
  • 14.
    How to computethe simple correlation coefficient (r)
  • 15.
    Example A sample of6 children was selected, data about their age in years and weight in kilograms was recorded as shown in the following table . It is required to find the correlation between age and weight. Serial No Age(Years) Weight(Kg) 1 7 12 2 6 8 3 8 12 4 5 10 5 6 11 6 9 13
  • 16.
    These 2 variablesare of the quantitative type, one variable (Age) is called the independent and denoted as (X) variable and the other (weight) is called the dependent and denoted as (Y) variables to find the relation between age and weight compute the simple correlation coefficient using the following formula:
  • 17.
    Serial No Age(Years) (X) Weight(Kg) (Y) XYX2 Y2 1 7 12 84 49 144 2 6 8 48 36 64 3 8 12 96 64 144 4 5 10 50 25 100 5 6 11 66 36 121 6 9 13 117 81 169 Total ∑x=41 ∑y=66 ∑xy= 461 ∑x2=291 ∑y2=742
  • 18.
    r = 0.759 Strongdirect correlation
  • 19.
    Application 1.As the numberof trees cut down increases, the probability of erosion increases. 2.As a student’s study time increases, so does his test average. 3.As a child grows, so does his clothing size. 4.As her salary increased, so did her spending. REAL LIFE Application Of Positive Correlation :
  • 20.
    Application •student absences ---------grades •weather cooling --------air conditioning costs •train speed -------- length of final point •chicken age --------amount of eggs producing REAL LIFE Application Of Negative Correlation:
  • 21.
    Application Temperature Sales in ˚C 17.2˚C 22.6 ˚C 18.1 ˚C 23.4 ˚C 25.1 ˚C 19.4 ˚C 22.1 ˚C 18.5 ˚C 15.2 ˚C 11.9 ˚C 16.4 ˚C 14.2 ˚C $408 $445 $421 $544 $614 $412 $522 $406 $332 $185 $325 $215 ##Temperature --- Sales Income
  • 22.
    Application On a scatterplot, here is the same data: So, we can see that more sales occur during warmer weather
  • 23.
    Application ##amount of exercise---- % body fat Hours of exercise Bodyfat
  • 24.
    Application Weather gets sohot--- sales start Here is the latest graph: The correlation is now 0: "No Correlation" ... !
  • 25.