Downloaded 934 times
![Considerations
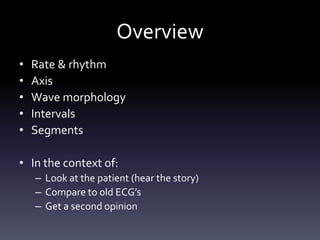
• Methodical systematic approach
– “More is missed by not looking than by not
knowing"[Thomas McCrae, 1870-1935]
• Consider patients clinical condition
• Obtain previous ECG’s for comparison
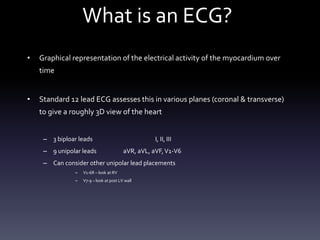
• Limitations of ECG – Electrical activity, not
contractility etc…
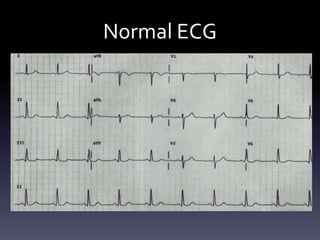
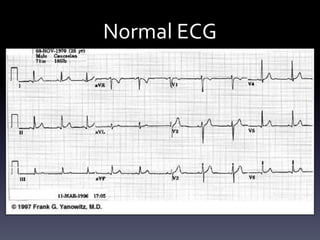
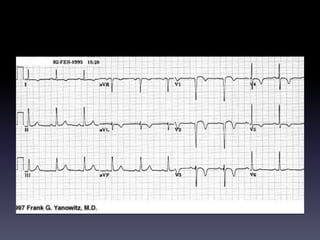
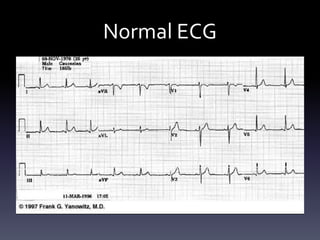
• The “ normal” ECG
– All normal ECG’s do not look the same
– But they do have features in common](https://image.slidesharecdn.com/ecginterpretation-s-150311230402-conversion-gate01/85/Systematic-ECG-Interpretation-7-320.jpg)
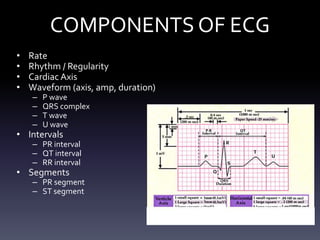
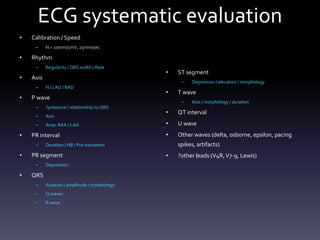


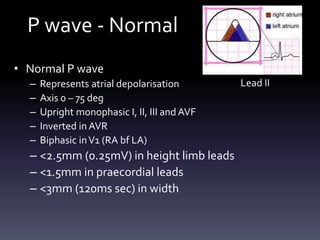

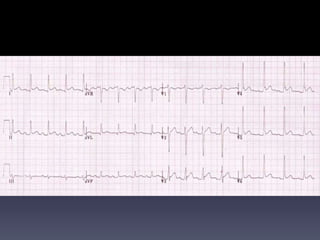


This document provides an overview of electrocardiogram (ECG) interpretation. It discusses the components of a normal ECG tracing including rate, rhythm, axis, waveforms such as P, QRS, ST segments, and T waves. It describes how to systematically evaluate an ECG and identify abnormalities. Common abnormalities are outlined such as arrhythmias, conduction blocks, myocardial infarction, hypertrophy, and electrolyte disturbances. Causes of abnormalities in various ECG components are also reviewed. The goal is to provide clinicians a methodical approach to ECG interpretation.


![Hypothalamus short ppt by Dr. Neha [PT].pptx](https://cdn.slidesharecdn.com/ss_thumbnails/hypothalamusbydr-260124145759-b9f94a93-thumbnail.jpg?width=640&height=640&fit=bounds)

