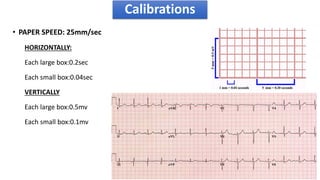
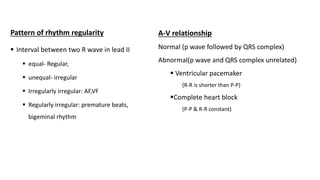
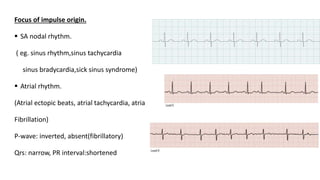
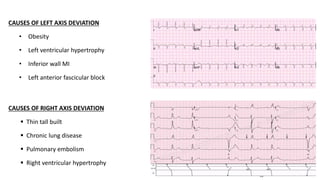
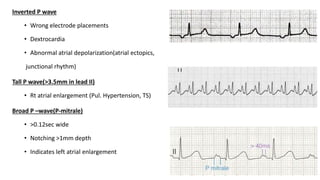
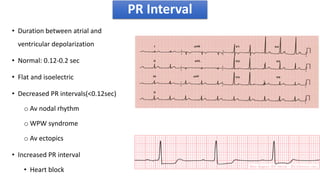
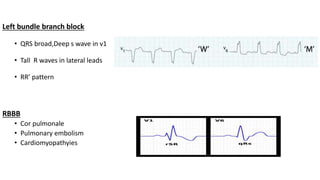
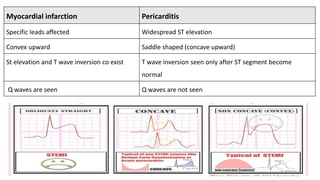
ELECTROCARDIOGRAM (ECG)
Prepared by
Dr. Rupesh Sangraula
Moderator
Dr. Bindu Pandey KC
To have basic understanding of:
• ECG waves and intervals
• Recording and interpretations of normal and abnormal ECG
Objectives
• Graphical representation of the electrical activity
of the heart.
• Electrical depolarization of myocardial tissue-
produces an electrical current- detected by
electrode pairs on body surface- signals amplified
and are printed in the form of graph.
• Electrocardiograph: Machine used to record the
electrical activity of the heart.(ECG machine).
Introduction
SYMPTOMS
• Chest pain
• Epigastric pain
• Back, neck, jaw or arm pain without
chest pain
• Palpitations
• Syncope
• Exertional dyspnea
• Ingestion of toxic substances
• Seizures
Indications
EVALUATION OF
• Suspected arrhythmias, CAD
• Suspected electrolyte imbalances.
• Cases like drowning, poisoning, electrocution
• Patients with implanted defibrillators and
pacemakers
• Resuscitations
Done by standard 12-lead ECG which includes:
 3 bipolar limb leads.(I, II and III),
 3 augmented limb leads(aVR, aVF and aVL)
 6 chest leads(v1-v6)
ECG Recording
Anatomical representation of ECG leads
1. Calibration and technical features
2. Rhythm
3. Heart rate
4. Axis
5. P-wave
6. PR- interval
7. Q- wave
8. QRS complex
9. T- wave
10. ST segment
11. QT interval
12. U wave
ECG interpretations
• PAPER SPEED: 25mm/sec
HORIZONTALLY:
Each large box:0.2sec
Each small box:0.04sec
VERTICALLY
Each large box:0.5mv
Each small box:0.1mv
Calibrations
Refers to what is driving the ventricular rate
Assessed by
1. Pattern of rhythm regularity
2. AV nodal relationship
3. Heart rate
4. Focus of impulse origin
Rhythm
Pattern of rhythm regularity
 Interval between two R wave in lead II
 equal- Regular,
 unequal- irregular
 Irregularly irregular: AF,VF
 Regularly irregular: premature beats,
bigeminal rhythm
A-V relationship
Normal (p wave followed by QRS complex)
Abnormal(p wave and QRS complex unrelated)
 Ventricular pacemaker
(R-R is shorter than P-P)
Complete heart block
(P-P & R-R constant)
Focus of impulse origin.
 SA nodal rhythm.
( eg. sinus rhythm,sinus tachycardia
sinus bradycardia,sick sinus syndrome)
 Atrial rhythm.
(Atrial ectopic beats, atrial tachycardia, atria
Fibrillation)
P-wave: inverted, absent(fibrillatory)
Qrs: narrow, PR interval:shortened
JUNCTIONAL RHYTHM
• Arises from AV node or bundle of his
• P wave: inverted(precede, follow or merge
with QRS complex.
• QRS: narrow.
VENTRICULAR RHYTHM
• Arises from ventricles.
• P wave: inverted or discerned
• QRS: wide and bizarre.
• (ventricular ectopic beats, VT, VF)
• If heart rhythm is regular and paper speed 25mm/sec
• Heart rate= 300/(no. of large boxes between 2 consecutive QRS complex)
OR
• Heart rate= 1500/(no. of small square boxes between 2 consecutive QRS complex.
• If heart rhythm- irregular,
Heart rate=no. of QRS complex in 50 large square multiplied by six.
Heart Rate
Normal heart rate= 60-100/min
Bradycardia <60/min
• Physiological(athletes)
• Sinus bradycardia
• Heart block
• Escape rhythm
• Asystole
Heart Rate
Tachycardia >100/min
 Physiological (young age, pain, anxiety, pregnancy)
 Narrow complex (AF, atrial flutter, atrial tachycardia)
 Board complex (VT, torsades de pointes)
• General direction of electrical flow through ventricles.
• Normal QRS axis: between -30 to 90
• Measurement of QRS axis:
• We look at lead I and avF as they are right angle to each
other.
• Polarity of QRS complex (+ or -) in these leads tells the
direction of electrical impulse in these leads.
QRS Axis
Quick method
look at avR n make sure its negative
look at leadI and II
CAUSES OF LEFT AXIS DEVIATION
• Obesity
• Left ventricular hypertrophy
• Inferior wall MI
• Left anterior fascicular block
CAUSES OF RIGHT AXIS DEVIATION
 Thin tall built
 Chronic lung disease
 Pulmonary embolism
 Right ventricular hypertrophy
• Produced by atrial depolarization.
• Normally, upright in all leads except avR. Biphasic in lead I
• Height <2.5mm(2.5 small square box)
• Width <0.12 sec(3 small square box)
• Absent P wave(no coordinated atrial depolarization
• Atrial fibrillation formed but not obvious)
• Atrial flutter (Sawtooth appearances)
• Hyperkalemia
• Junctional rhythm
• Ventricular tachycardia
P-wave
Inverted P wave
• Wrong electrode placements
• Dextrocardia
• Abnormal atrial depolarization(atrial ectopics,
junctional rhythm)
Tall P wave(>3.5mm in lead II)
• Rt atrial enlargement (Pul. Hypertension, TS)
Broad P –wave(P-mitrale)
• >0.12sec wide
• Notching >1mm depth
• Indicates left atrial enlargement
• Duration between atrial and
ventricular depolarization
• Normal: 0.12-0.2 sec
• Flat and isoelectric
• Decreased PR intervals(<0.12sec)
o Av nodal rhythm
o WPW syndrome
o Av ectopics
• Increased PR interval
• Heart block
PR Interval
Depressed PR intervals
• Pericarditis
All leads except avR and v1
• Atrial involvement in ACS
Q wave
• Initial negative deflection of QRS complex
• Normally present in leads that look at heart from left
• (lead I, II, aVL, V5 and V6)
• ABNORMAL IF,
• >2 small square deep
• >1/4 of height of following R wave
• >1 small square wide
QRS complex
Abnormal q wave
• ST elevation MI
• Pulmonary embolism
• LVH
• Bundle branch block
• R wave
• Upright in all leads except aVR.
• Increases in height from V1-V5.
• R<S in V1, V2. R>S in V5,V6
• S wave
• Negative deflection that follows r wave
Lead V1 (>4 mm) Lead V6 (>25 mm)
RVH LVH
RBBB LBBB
WPW syndrome
Abnormally tall R wave
Produced by ventricular depolarization.
• Normal width: 0.08-0.12 secs
Narrow QRS complex(0.08secs)
• Supraventricular tachycardia
Broad QRS complex(>0.12 secs)
• Ventricular arrhythmias
• Bundle branch blocks
• Hyperkalemia
QRS complex
Left bundle branch block
• QRS broad,Deep s wave in v1
• Tall R waves in lateral leads
• RR’ pattern
RBBB
• Cor pulmonale
• Pulmonary embolism
• Cardiomyopathyies
• Produced by ventricular repolarization
• Normally upright in all leads except aVR
• <5mm in limb leads, <10mm in chest
leads
• Tall t wave
• Hyperkalemia(loss of P waves, sine
wave)
• Hyper acute MI
T-wave
T wave inversion
• Coronary ischemia
• Ventricular hypertrophy
(strain) pattern
• Digoxin toxicity
• pericarditis
T-wave
• Portion of baseline between the end of S
wave and onset of T wave.
• Isoelectric
St elevation
(>1mm in limb lead, >2mm in chest lead)
• Coronary artery disease
• Pericarditis
• Ventricular aneurysm
ST-segment
Myocardial infarction Pericarditis
Specific leads affected Widespread ST elevation
Convex upward Saddle shaped (concave upward)
St elevation and T wave inversion co exist T wave inversion seen only after ST segment become
normal
Q waves are seen Q waves are not seen
ST depression
• >0.5mm in 2 contiguous leads
.>1mm in relation to baseline
Causes
• Myocardial ischemia
• Ventricular hypertrophy with strain
• Reciprocal changes in STEMI
• Drugs like digoxin
QT Interval
• Time from the start of the Q wave to the end of the T wave
• Represents time taken for ventricular depolarization and repolarization
• QT interval shortens at faster heart rates
• The QT interval lengthens at slower heart rates
• An abnormally prolonged QT increased risk of Torsades de Pointes
• Follows T wave. seen best in v2
• Seen in
 Bradycardia
 Hypokalemia
 ST depression, small T waves
• Inverted U wave
• Ischemic heart disease
• Hypertension
• Dilated cardiomyopathy
U wave
Myocardial infarction
STEMI NSTEMI
Elevated ST wave Depressed ST wave
Progression to Q wave No progression to Q wave
Pulmonary embolism
Asystole
Hyperkalemia VF
• Harrison's Principles of Internal Medicine, Twentieth Edition
• Davidson's Principles and Practice of Medicine - 23rd Edition
• Tintinalli's Emergency Medicine: A Comprehensive Study Guide, 9e.
• The ECG Manual: An Evidence-Based Approach, Book by Marc Gertsch
References
Ecg made easy
Ecg made easy

Ecg made easy

  • 1.
    ELECTROCARDIOGRAM (ECG) Prepared by Dr.Rupesh Sangraula Moderator Dr. Bindu Pandey KC
  • 2.
    To have basicunderstanding of: • ECG waves and intervals • Recording and interpretations of normal and abnormal ECG Objectives
  • 3.
    • Graphical representationof the electrical activity of the heart. • Electrical depolarization of myocardial tissue- produces an electrical current- detected by electrode pairs on body surface- signals amplified and are printed in the form of graph. • Electrocardiograph: Machine used to record the electrical activity of the heart.(ECG machine). Introduction
  • 4.
    SYMPTOMS • Chest pain •Epigastric pain • Back, neck, jaw or arm pain without chest pain • Palpitations • Syncope • Exertional dyspnea • Ingestion of toxic substances • Seizures Indications EVALUATION OF • Suspected arrhythmias, CAD • Suspected electrolyte imbalances. • Cases like drowning, poisoning, electrocution • Patients with implanted defibrillators and pacemakers • Resuscitations
  • 5.
    Done by standard12-lead ECG which includes:  3 bipolar limb leads.(I, II and III),  3 augmented limb leads(aVR, aVF and aVL)  6 chest leads(v1-v6) ECG Recording
  • 6.
  • 7.
    1. Calibration andtechnical features 2. Rhythm 3. Heart rate 4. Axis 5. P-wave 6. PR- interval 7. Q- wave 8. QRS complex 9. T- wave 10. ST segment 11. QT interval 12. U wave ECG interpretations
  • 8.
    • PAPER SPEED:25mm/sec HORIZONTALLY: Each large box:0.2sec Each small box:0.04sec VERTICALLY Each large box:0.5mv Each small box:0.1mv Calibrations
  • 9.
    Refers to whatis driving the ventricular rate Assessed by 1. Pattern of rhythm regularity 2. AV nodal relationship 3. Heart rate 4. Focus of impulse origin Rhythm
  • 10.
    Pattern of rhythmregularity  Interval between two R wave in lead II  equal- Regular,  unequal- irregular  Irregularly irregular: AF,VF  Regularly irregular: premature beats, bigeminal rhythm A-V relationship Normal (p wave followed by QRS complex) Abnormal(p wave and QRS complex unrelated)  Ventricular pacemaker (R-R is shorter than P-P) Complete heart block (P-P & R-R constant)
  • 11.
    Focus of impulseorigin.  SA nodal rhythm. ( eg. sinus rhythm,sinus tachycardia sinus bradycardia,sick sinus syndrome)  Atrial rhythm. (Atrial ectopic beats, atrial tachycardia, atria Fibrillation) P-wave: inverted, absent(fibrillatory) Qrs: narrow, PR interval:shortened
  • 12.
    JUNCTIONAL RHYTHM • Arisesfrom AV node or bundle of his • P wave: inverted(precede, follow or merge with QRS complex. • QRS: narrow. VENTRICULAR RHYTHM • Arises from ventricles. • P wave: inverted or discerned • QRS: wide and bizarre. • (ventricular ectopic beats, VT, VF)
  • 13.
    • If heartrhythm is regular and paper speed 25mm/sec • Heart rate= 300/(no. of large boxes between 2 consecutive QRS complex) OR • Heart rate= 1500/(no. of small square boxes between 2 consecutive QRS complex. • If heart rhythm- irregular, Heart rate=no. of QRS complex in 50 large square multiplied by six. Heart Rate
  • 14.
    Normal heart rate=60-100/min Bradycardia <60/min • Physiological(athletes) • Sinus bradycardia • Heart block • Escape rhythm • Asystole Heart Rate Tachycardia >100/min  Physiological (young age, pain, anxiety, pregnancy)  Narrow complex (AF, atrial flutter, atrial tachycardia)  Board complex (VT, torsades de pointes)
  • 15.
    • General directionof electrical flow through ventricles. • Normal QRS axis: between -30 to 90 • Measurement of QRS axis: • We look at lead I and avF as they are right angle to each other. • Polarity of QRS complex (+ or -) in these leads tells the direction of electrical impulse in these leads. QRS Axis
  • 16.
    Quick method look atavR n make sure its negative look at leadI and II
  • 17.
    CAUSES OF LEFTAXIS DEVIATION • Obesity • Left ventricular hypertrophy • Inferior wall MI • Left anterior fascicular block CAUSES OF RIGHT AXIS DEVIATION  Thin tall built  Chronic lung disease  Pulmonary embolism  Right ventricular hypertrophy
  • 18.
    • Produced byatrial depolarization. • Normally, upright in all leads except avR. Biphasic in lead I • Height <2.5mm(2.5 small square box) • Width <0.12 sec(3 small square box) • Absent P wave(no coordinated atrial depolarization • Atrial fibrillation formed but not obvious) • Atrial flutter (Sawtooth appearances) • Hyperkalemia • Junctional rhythm • Ventricular tachycardia P-wave
  • 19.
    Inverted P wave •Wrong electrode placements • Dextrocardia • Abnormal atrial depolarization(atrial ectopics, junctional rhythm) Tall P wave(>3.5mm in lead II) • Rt atrial enlargement (Pul. Hypertension, TS) Broad P –wave(P-mitrale) • >0.12sec wide • Notching >1mm depth • Indicates left atrial enlargement
  • 20.
    • Duration betweenatrial and ventricular depolarization • Normal: 0.12-0.2 sec • Flat and isoelectric • Decreased PR intervals(<0.12sec) o Av nodal rhythm o WPW syndrome o Av ectopics • Increased PR interval • Heart block PR Interval
  • 21.
    Depressed PR intervals •Pericarditis All leads except avR and v1 • Atrial involvement in ACS
  • 22.
    Q wave • Initialnegative deflection of QRS complex • Normally present in leads that look at heart from left • (lead I, II, aVL, V5 and V6) • ABNORMAL IF, • >2 small square deep • >1/4 of height of following R wave • >1 small square wide QRS complex
  • 23.
    Abnormal q wave •ST elevation MI • Pulmonary embolism • LVH • Bundle branch block
  • 24.
    • R wave •Upright in all leads except aVR. • Increases in height from V1-V5. • R<S in V1, V2. R>S in V5,V6 • S wave • Negative deflection that follows r wave Lead V1 (>4 mm) Lead V6 (>25 mm) RVH LVH RBBB LBBB WPW syndrome Abnormally tall R wave
  • 25.
    Produced by ventriculardepolarization. • Normal width: 0.08-0.12 secs Narrow QRS complex(0.08secs) • Supraventricular tachycardia Broad QRS complex(>0.12 secs) • Ventricular arrhythmias • Bundle branch blocks • Hyperkalemia QRS complex
  • 26.
    Left bundle branchblock • QRS broad,Deep s wave in v1 • Tall R waves in lateral leads • RR’ pattern RBBB • Cor pulmonale • Pulmonary embolism • Cardiomyopathyies
  • 27.
    • Produced byventricular repolarization • Normally upright in all leads except aVR • <5mm in limb leads, <10mm in chest leads • Tall t wave • Hyperkalemia(loss of P waves, sine wave) • Hyper acute MI T-wave
  • 28.
    T wave inversion •Coronary ischemia • Ventricular hypertrophy (strain) pattern • Digoxin toxicity • pericarditis T-wave
  • 29.
    • Portion ofbaseline between the end of S wave and onset of T wave. • Isoelectric St elevation (>1mm in limb lead, >2mm in chest lead) • Coronary artery disease • Pericarditis • Ventricular aneurysm ST-segment
  • 30.
    Myocardial infarction Pericarditis Specificleads affected Widespread ST elevation Convex upward Saddle shaped (concave upward) St elevation and T wave inversion co exist T wave inversion seen only after ST segment become normal Q waves are seen Q waves are not seen
  • 31.
    ST depression • >0.5mmin 2 contiguous leads .>1mm in relation to baseline Causes • Myocardial ischemia • Ventricular hypertrophy with strain • Reciprocal changes in STEMI • Drugs like digoxin
  • 32.
    QT Interval • Timefrom the start of the Q wave to the end of the T wave • Represents time taken for ventricular depolarization and repolarization • QT interval shortens at faster heart rates • The QT interval lengthens at slower heart rates • An abnormally prolonged QT increased risk of Torsades de Pointes
  • 33.
    • Follows Twave. seen best in v2 • Seen in  Bradycardia  Hypokalemia  ST depression, small T waves • Inverted U wave • Ischemic heart disease • Hypertension • Dilated cardiomyopathy U wave
  • 35.
    Myocardial infarction STEMI NSTEMI ElevatedST wave Depressed ST wave Progression to Q wave No progression to Q wave
  • 37.
  • 38.
    • Harrison's Principlesof Internal Medicine, Twentieth Edition • Davidson's Principles and Practice of Medicine - 23rd Edition • Tintinalli's Emergency Medicine: A Comprehensive Study Guide, 9e. • The ECG Manual: An Evidence-Based Approach, Book by Marc Gertsch References

Editor's Notes