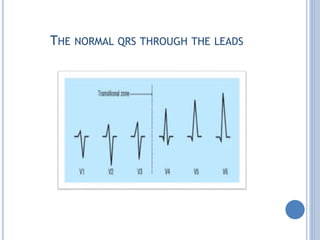
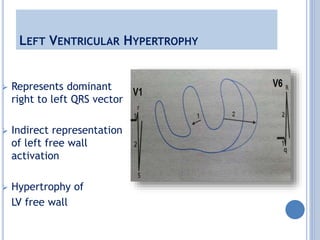
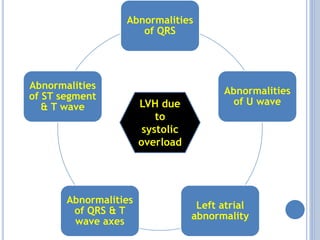
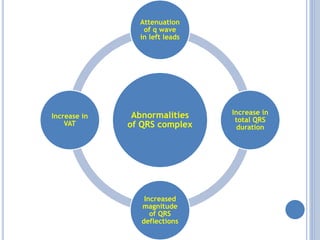
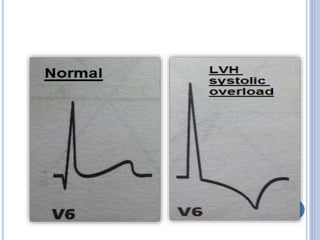
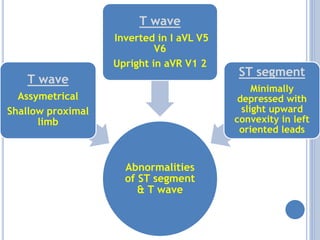
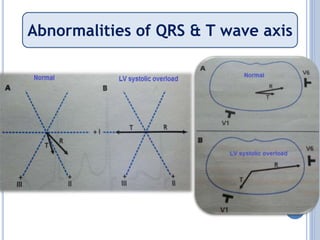
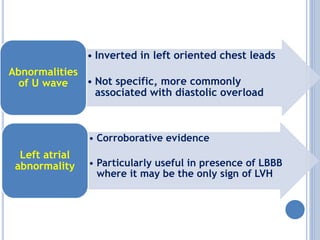
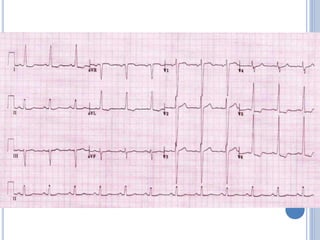
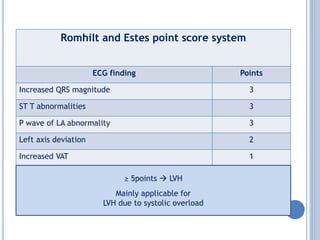
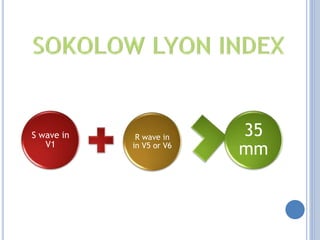
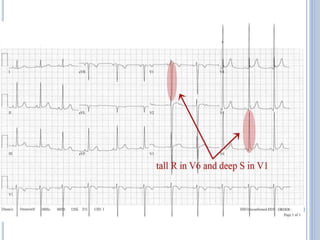
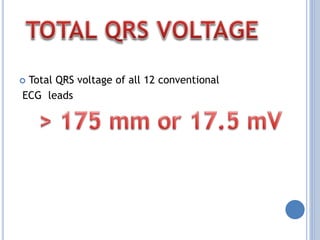
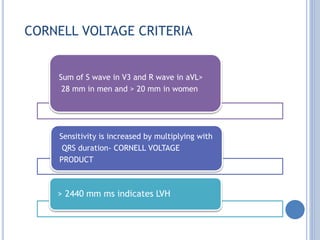
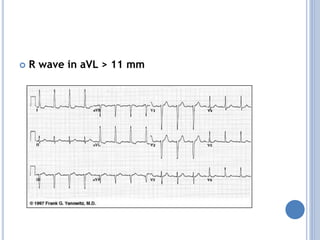
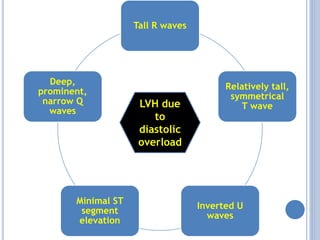
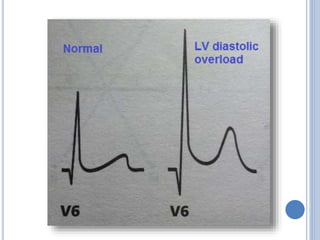
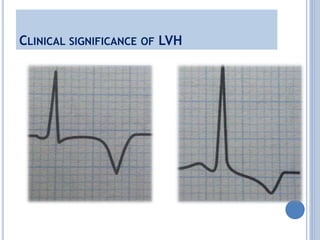
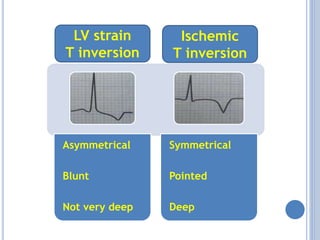
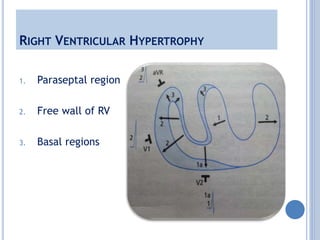
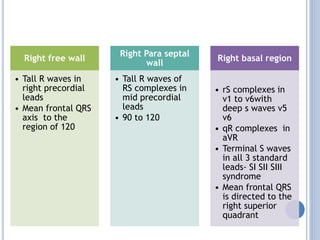
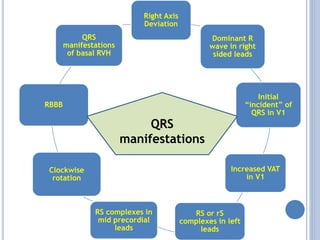
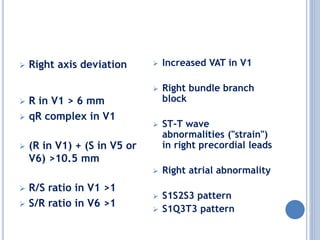
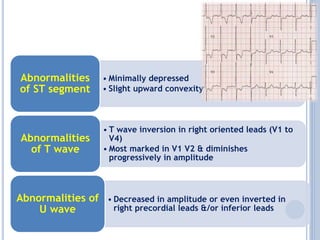
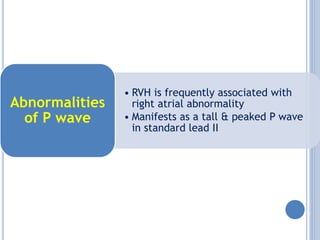
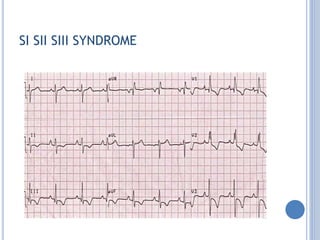
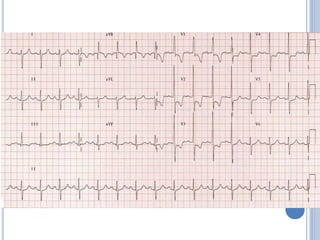
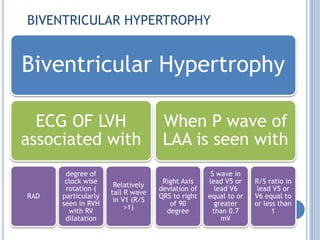
LVH AND RVH
Dr. Mohammed Niyaz
MEM Y2
ASTER MIMS
OVERVIEW
LVH
 Definition
 Types of LVH
 ECG changes in systolic overload
 Criteria to diagnose LVH
 ECG changes in diastolic overload
RVH
 Definition
 ECG changes
 Clinical correlation
DEFINITION OF LVH
Increase in the mass of the left ventricle, which
can be secondary to an increase in wall thickness,
an increase in cavity size, or both.
THE NORMAL QRS THROUGH THE LEADS
 Represents dominant
right to left QRS vector
 Indirect representation
of left free wall
activation
 Hypertrophy of
LV free wall
LEFT VENTRICULAR HYPERTROPHY
Systolic overload
 aka Pressure overload
 Resistance to LV systolic
outflow
 LV compromise occurs in
systole
 AS, HTN, HCM,
Coarctation of aorta
Diastolic overload
 aka Volume overload
 Overfilling of the LV in
diastole
 LV compromise occurs in
diastole
 PDA, VSD ( moderate to large
L  R shunts), AR, MR
LEFT VENTRICULAR HYPERTROPHY
Abnormalities
of QRS
Abnormalities
of U wave
Left atrial
abnormality
Abnormalities
of QRS & T
wave axes
Abnormalities
of ST segment
& T wave LVH due
to
systolic
overload
Abnormalities
of QRS complex
Attenuation
of q wave
in left leads
Increase in
total QRS
duration
Increased
magnitude
of QRS
deflections
Increase in
VAT
Abnormalities
of ST segment
& T wave
T wave
Assymetrical
Shallow proximal
limb
T wave
Inverted in I aVL V5
V6
Upright in aVR V1 2
ST segment
Minimally
depressed with
slight upward
convexity in left
oriented leads
Abnormalities of QRS & T wave axis
• Inverted in left oriented chest leads
• Not specific, more commonly
associated with diastolic overload
Abnormalities
of U wave
• Corroborative evidence
• Particularly useful in presence of LBBB
where it may be the only sign of LVH
Left atrial
abnormality
QRS T WAVE AXIS
 Early stage – no change in axis
 Due to symmetric increase in bulk
 Late stage- Left Axis deviation
 Due to left anterior hemiblock
Progressive
widening of
QRS T angle
beyond the
normal 45
degree
T wave
tends to be
flat in lead I
Longstanding
hypertension
T wave is
maximally to
the right(+-
180 degree)
Wide frontal
and
horizontal
plane QRS –T
angles
Romhilt and Estes point score system
ECG finding Points
Increased QRS magnitude 3
ST T abnormalities 3
P wave of LA abnormality 3
Left axis deviation 2
Increased VAT 1
≥ 5points  LVH
Mainly applicable for
LVH due to systolic overload
S wave in
V1
R wave in
in V5 or V6
35
mm
 Total QRS voltage of all 12 conventional
ECG leads
CORNELL VOLTAGE CRITERIA
Sum of S wave in V3 and R wave in aVL>
28 mm in men and > 20 mm in women
Sensitivity is increased by multiplying with
QRS duration- CORNELL VOLTAGE
PRODUCT
> 2440 mm ms indicates LVH
 R wave in aVL > 11 mm
Tall R waves
Relatively tall,
symmetrical
T wave
Inverted U
waves
Minimal ST
segment
elevation
Deep,
prominent,
narrow Q
waves
LVH due
to
diastolic
overload
CLINICAL SIGNIFICANCE OF LVH
Asymmetrical
Blunt
Not very deep
Symmetrical
Pointed
Deep
LV strain
T inversion
Ischemic
T inversion
RIGHT VENTRICULAR
HYPERTROPHY
RIGHT VENTRICULAR HYPERTROPHY
1. Paraseptal region
2. Free wall of RV
3. Basal regions
Right free wall
• Tall R waves in
right precordial
leads
• Mean frontal QRS
axis to the
region of 120
Right Para septal
wall
• Tall R waves of
RS complexes in
mid precordial
leads
• 90 to 120
Right basal region
• rS complexes in
v1 to v6with
deep s waves v5
v6
• qR complexes in
aVR
• Terminal S waves
in all 3 standard
leads- SI SII SIII
syndrome
• Mean frontal QRS
is directed to the
right superior
quadrant
Right Axis
Deviation
Dominant R
wave in right
sided leads
Initial
“incident” of
QRS in V1
Increased VAT
in V1
RS or rS
complexes in left
leads
RS complexes in
mid precordial
leads
Clockwise
rotation
RBBB
QRS
manifestations
of basal RVH
QRS
manifestations
 Right axis deviation
 R in V1 > 6 mm
 qR complex in V1
 (R in V1) + (S in V5 or
V6) >10.5 mm
 R/S ratio in V1 >1
 S/R ratio in V6 >1
 Increased VAT in V1
 Right bundle branch
block
 ST-T wave
abnormalities ("strain")
in right precordial leads
 Right atrial abnormality
 S1S2S3 pattern
 S1Q3T3 pattern
• Minimally depressed
• Slight upward convexity
Abnormalities
of ST segment
• T wave inversion in right oriented leads (V1 to
V4)
• Most marked in V1 V2 & diminishes
progressively in amplitude
Abnormalities
of T wave
• Decreased in amplitude or even inverted in
right precordial leads &/or inferior leads
Abnormalities of
U wave
• RVH is frequently associated with
right atrial abnormality
• Manifests as a tall & peaked P wave
in standard lead II
Abnormalities
of P wave
SI SII SIII SYNDROME
CLINICAL CORRELATION
BIVENTRICULAR HYPERTROPHY
Biventricular Hypertrophy
ECG OF LVH
associated with
RAD
degree of
clock wise
rotation (
particularly
seen in RVH
with RV
dilatation
Relatively
tall R wave
in V1 (R/S
>1)
When P wave of
LAA is seen with
Right Axis
deviation of
QRS to right
of 90
degree
S wave in
lead V5 or
lead V6
equal to or
greater
than 0.7
mV
R/S ratio in
lead V5 or
V6 equal to
or less than
1
TAKE HOME MESSAGE
 DIAGNOSING LVH
 SOKOLOV LYON CRITERIA
 VOLTAGE IN aVL
 NON VOLTAGE CRITERIA
 CLINICAL CORRELATION
 DIAGNOSING RVH
Thank you

Lvh & rvh

  • 1.
    LVH AND RVH Dr.Mohammed Niyaz MEM Y2 ASTER MIMS
  • 2.
    OVERVIEW LVH  Definition  Typesof LVH  ECG changes in systolic overload  Criteria to diagnose LVH  ECG changes in diastolic overload RVH  Definition  ECG changes  Clinical correlation
  • 3.
    DEFINITION OF LVH Increasein the mass of the left ventricle, which can be secondary to an increase in wall thickness, an increase in cavity size, or both.
  • 4.
    THE NORMAL QRSTHROUGH THE LEADS
  • 5.
     Represents dominant rightto left QRS vector  Indirect representation of left free wall activation  Hypertrophy of LV free wall LEFT VENTRICULAR HYPERTROPHY
  • 6.
    Systolic overload  akaPressure overload  Resistance to LV systolic outflow  LV compromise occurs in systole  AS, HTN, HCM, Coarctation of aorta Diastolic overload  aka Volume overload  Overfilling of the LV in diastole  LV compromise occurs in diastole  PDA, VSD ( moderate to large L  R shunts), AR, MR LEFT VENTRICULAR HYPERTROPHY
  • 7.
    Abnormalities of QRS Abnormalities of Uwave Left atrial abnormality Abnormalities of QRS & T wave axes Abnormalities of ST segment & T wave LVH due to systolic overload
  • 8.
    Abnormalities of QRS complex Attenuation ofq wave in left leads Increase in total QRS duration Increased magnitude of QRS deflections Increase in VAT
  • 10.
    Abnormalities of ST segment &T wave T wave Assymetrical Shallow proximal limb T wave Inverted in I aVL V5 V6 Upright in aVR V1 2 ST segment Minimally depressed with slight upward convexity in left oriented leads
  • 11.
    Abnormalities of QRS& T wave axis
  • 12.
    • Inverted inleft oriented chest leads • Not specific, more commonly associated with diastolic overload Abnormalities of U wave • Corroborative evidence • Particularly useful in presence of LBBB where it may be the only sign of LVH Left atrial abnormality
  • 14.
    QRS T WAVEAXIS  Early stage – no change in axis  Due to symmetric increase in bulk  Late stage- Left Axis deviation  Due to left anterior hemiblock
  • 15.
    Progressive widening of QRS Tangle beyond the normal 45 degree T wave tends to be flat in lead I Longstanding hypertension T wave is maximally to the right(+- 180 degree) Wide frontal and horizontal plane QRS –T angles
  • 16.
    Romhilt and Estespoint score system ECG finding Points Increased QRS magnitude 3 ST T abnormalities 3 P wave of LA abnormality 3 Left axis deviation 2 Increased VAT 1 ≥ 5points  LVH Mainly applicable for LVH due to systolic overload
  • 17.
    S wave in V1 Rwave in in V5 or V6 35 mm
  • 19.
     Total QRSvoltage of all 12 conventional ECG leads
  • 20.
    CORNELL VOLTAGE CRITERIA Sumof S wave in V3 and R wave in aVL> 28 mm in men and > 20 mm in women Sensitivity is increased by multiplying with QRS duration- CORNELL VOLTAGE PRODUCT > 2440 mm ms indicates LVH
  • 21.
     R wavein aVL > 11 mm
  • 22.
    Tall R waves Relativelytall, symmetrical T wave Inverted U waves Minimal ST segment elevation Deep, prominent, narrow Q waves LVH due to diastolic overload
  • 24.
  • 25.
    Asymmetrical Blunt Not very deep Symmetrical Pointed Deep LVstrain T inversion Ischemic T inversion
  • 26.
  • 27.
    RIGHT VENTRICULAR HYPERTROPHY 1.Paraseptal region 2. Free wall of RV 3. Basal regions
  • 28.
    Right free wall •Tall R waves in right precordial leads • Mean frontal QRS axis to the region of 120 Right Para septal wall • Tall R waves of RS complexes in mid precordial leads • 90 to 120 Right basal region • rS complexes in v1 to v6with deep s waves v5 v6 • qR complexes in aVR • Terminal S waves in all 3 standard leads- SI SII SIII syndrome • Mean frontal QRS is directed to the right superior quadrant
  • 30.
    Right Axis Deviation Dominant R wavein right sided leads Initial “incident” of QRS in V1 Increased VAT in V1 RS or rS complexes in left leads RS complexes in mid precordial leads Clockwise rotation RBBB QRS manifestations of basal RVH QRS manifestations
  • 32.
     Right axisdeviation  R in V1 > 6 mm  qR complex in V1  (R in V1) + (S in V5 or V6) >10.5 mm  R/S ratio in V1 >1  S/R ratio in V6 >1  Increased VAT in V1  Right bundle branch block  ST-T wave abnormalities ("strain") in right precordial leads  Right atrial abnormality  S1S2S3 pattern  S1Q3T3 pattern
  • 33.
    • Minimally depressed •Slight upward convexity Abnormalities of ST segment • T wave inversion in right oriented leads (V1 to V4) • Most marked in V1 V2 & diminishes progressively in amplitude Abnormalities of T wave • Decreased in amplitude or even inverted in right precordial leads &/or inferior leads Abnormalities of U wave
  • 34.
    • RVH isfrequently associated with right atrial abnormality • Manifests as a tall & peaked P wave in standard lead II Abnormalities of P wave
  • 35.
    SI SII SIIISYNDROME
  • 37.
  • 38.
    BIVENTRICULAR HYPERTROPHY Biventricular Hypertrophy ECGOF LVH associated with RAD degree of clock wise rotation ( particularly seen in RVH with RV dilatation Relatively tall R wave in V1 (R/S >1) When P wave of LAA is seen with Right Axis deviation of QRS to right of 90 degree S wave in lead V5 or lead V6 equal to or greater than 0.7 mV R/S ratio in lead V5 or V6 equal to or less than 1
  • 39.
    TAKE HOME MESSAGE DIAGNOSING LVH  SOKOLOV LYON CRITERIA  VOLTAGE IN aVL  NON VOLTAGE CRITERIA  CLINICAL CORRELATION  DIAGNOSING RVH
  • 40.

Editor's Notes

  • #4 LVH as a consequence of hypertension usually presents with an increase in wall thickness, with or without an increase in cavity size..
  • #5 R wave progression Standard lead I-left oriented lead – qR complex similar to V6 rS in right oriented leads (V1 V2) RS Rs in v3 v4 qR in the left oriented leads (I aVL V4 V5 V6)
  • #6 What does S wave in right leads & R wave in left leads represent?
  • #11 In LVH, LV is under strain, probably d/t relative LV ischemia, so T wave vector runs away towards the right… bad friend !!!!! T wave has a relatively blunt apex or nadir ST segment has opposite changes in right oriented leads (Minimally elevated with slight upward concavity in left oriented leads)
  • #12 QRS & T wave axis in frontal & horizontal planes; In longstanding LVH, axis deviates to left bcz of fibrosis which affects the anterosuperior division of LBB l/t LAHB (initially incomplete & progressively becomes more advanced). When LVH is complicated by AR or cardiac failure, LAD maybe even more marked; indicates an adverse prognosis
  • #13 Inverted U wave: reason unknown; sensitive sign of impaired LV, but rarely sought
  • #15 In early stage mean QRS vector is increased in amplitude but no change in axis ( 50 to 60 degree) Commonly directed to the direction of 0 in the hemiaxial referrance system When LVH of systolic overload is complicated by aortic incompetence or cardiac failure the left axis deviation is more marked. This is an adverse prognostic sign
  • #17 Cornell voltage sensitivity is increased by multiplying with QRS; For calculating CV Product, a correction factor of mm is added to cornell voltage Cornell Voltage Product overestimates LVH in the presence of obesity whereas Sokolow Lyon criteria underestimates it QRS voltages are affected by many factors including age, gender, body habitus, race etc. The common criteria best apply to adults >35yrs of normal built
  • #18 Sum of S wave in V1 and R wave in V5 or V6 exceeds 3.5 mV ( 35 mm with normal standardisation) Sensitivity 22%
  • #21 The common criteria is best applied for adults >35 years of age and moderate build Correction factor of 8 mm is added for women for cornell voltage pdt
  • #23 All above manifestations are in left oriented leads
  • #28 RVH results in generation of increased QRS forces that directed anteriorly & to the right. (??? so positive QRS in V1 , V2 & aVR) In basal region hypertrophy, QRS forces are directed superiorly, somewhat posteriorly & to the right
  • #31 RAD: most common manifestation; if hypertrophy of basal region is involved,it goes further to the right & in extreme cases may cause NWAD If RVH + NWAD is present, it indicates the presence of additional complicating factors like IV conduction defects like LAHB (seen in TOF, noonans syndrm) 2) Dominant R wave in right sided leads: due to combined effect of R paraseptal & R free wall vectors, but principally the RV free wall vector 3) Initial “incident” of QRS in V1: small initial slurring of QRS or rR’ deflections (in ASD) or qR complex (indicates RVH + RAA Eg: TR) 4) Increased VAT: corroborative evidence of right free wall ventricular hypertrophy, provided there is no RBBB 5) RS or rS complexes in I aVL V5 V6: rS complex in V6 is particularly indicative of RVH 6) RS complexes in mid precordial leads: 7) Clockwise electrical rotation in longitudinal axis: transition zone shifted to left (V4,V5 or V5,V6) 8) QRS manifestations of basal RVH: uncommon; V1 V2  dominantly negative or rS complex V5 V6 deep S waves of rS complexes aVR tall R waves of qR complex Frontal plane QRS axis may be deviated to the NW axis there may be terminal S waves in all 3 standard leads SI SII SIII syndrome
  • #34 T wave runs away from the area of mischeif.
  • #38 Katz Wachtel phenomenon: VSD in newborns & infants shows tall biphasic QRS complexes in midprecordial leads (R + S >40mm)
  • #39 3. R/S >1 seen in eisenmenger syndrome(VSD with PAH)